
Abstract
Keywords
Introduction
Retinal vein occlusions (RVOs) are the second leading cause of retinal vascular blindness, and their prevalence is expected to increase 20% by 2050. 1 Because of their efficacy and safety, antivascular endothelial growth factor (anti-VEGF) agents are the mainstay treatment for macular edema (ME) associated with RVOs, as shown in clinical trials.2 –4 Recent meta-analysis data found an average increase of more than 15 letters of best-corrected visual acuity (BCVA) 1 year after treatment with intravitreal aflibercept. 5 The baseline BCVA remains a crucial prognostic consideration in RVO treatment trials. 2
Optical coherence tomography (OCT) imaging has allowed for anatomic assessment and the correlation to treatment progression. 6 However, measurements used in initial pivotal clinical trials, such as central subfield thickness (CST), have recently shown a poor correlation with BCVA outcomes.7 –10 Although analysis of intraretinal fluid (IRF) and subretinal fluid (SRF) has shown promise in predicting functional deficits in ME caused by RVOs, showing a correlation, further work is needed to examine combined biomarkers and their relationship to BCVA.8,11 With increased expectations for an accurate prognosis of visual outcomes, more diverse imaging biomarkers will be crucial for the assessment of RVO.
The exact influence of individual morphologic OCT changes on visual outcomes in patients with RVO remains unclear. However, the quantification of IRF and other morphologic OCT features has been shown to be clinically relevant.8,11 For example, decreases in IRF are known to correlate with improvements in BCVA. 11 Simultaneous quantification of fluid volumes and retinal layer segmentation through a deep learning–based method of swept-source OCT (SS-OCT) scans could provide new biomarkers to aid in the diagnosis and prognosis of RVOs.
Machine learning has revolutionized image analysis and provides significant insights into layer and fluid segmentation2 –7,12,13 and evaluation8 –10 of retinal diseases. Despite these advances, little has been done to predict the recurrence of RVO-related disease or therapeutic needs in anti-VEGF therapy. Machine learning models have not been fully used as a deep learning–based approach for fluid segmentation and the development of clinically relevant biomarkers for RVOs.
In the pathology of RVOs, both the superficial and deep venous complexes are affected. Furthermore, it is known that the deep venous complex supplies the inner nuclear layer (INL) and outer plexiform layer (OPL). 14 The deep venous complex is preferentially affected over the superficial venous complex, and the deep venous complex is known to be the principal venous outflow system for the retinal capillary plexuses. 15 Obstruction of this complex by ischemia or occlusion can lead to the development of ME, with cystoid spaces seen in the INL, ganglion cell layer, and Henle fiber layer. 14
Although recent developments in artificial intelligence (AI) models have shown promise in OCT fluid segmentation and the predictive value in anti-VEGF treatment outcomes, at present there are no trials of machine learning with SS-OCT images in concordance with OCT angiography (OCTA) analysis for patients with RVO. This follow-up phase 4 proof-of-concept trial evaluated the use of a deep learning algorithm to develop new biomarkers for outcomes in patients with RVO and derive further insights into disease pathology.
Methods
Study Design
Patients diagnosed with branch RVO (BRVO) or central RVO (CRVO) were enrolled in this phase 4 retrospective open-label proof-of-concept trial—the REVOLT study. Analysis began in July 2021 and ended in June 2022. The study was approved by the Institutional Review Board, Advarra, and followed the tenets of the Declaration of Helsinki. Informed consent was obtained from all participants using a general consent form and was in accordance with section 4.8.10 of the current International Council on Harmonisation Good Clinical Practice guidelines.
Inclusion and Exclusion Criteria
Patients were included in the study if they were 25 years or older, were diagnosed with a treatment-naïve RVO that was subsequently treated with aflibercept, and had provided consent. Patients with uncontrolled systemic hypertension or thromboembolic events (eg, ictus, transient ischemic attack, myocardial infarction) within 6 months of baseline data, ocular conditions affecting VA other than RVO (eg, amblyopia, ischemic optic neuropathy, clinically significant diabetic ME, severe nonproliferative diabetic retinopathy, glaucoma, retinal detachment, retinal dystrophies, other retinal degenerations), uncontrolled glaucoma, ocular or periocular infection, active or previous intraocular inflammation, and poor-quality images precluding AI evaluation were excluded from the study.
Imaging
All patients had SS-OCT and OCTA testing with the Topcon Triton SS-OCT device (Topcon) to identify the baseline CST and foveal avascularity. 10 The SS-OCTA system has a scanning speed of 100 000 A-scans per second and uses a wavelength-sweeping laser with a central wavelength of 1050 nm and a sweeping range of approximately 100 nm, producing 6.0 mm × 6.0 mm scans for analysis. 16
Three-dimensional 7.0 mm × 7.0 mm baseline macula volume scans containing 512 A-scans and 256 B-scans were segmented with a validated version of Orion software (Voxeleron LLC). Layer segmentation is performed as a preprocessing step to fluid segmentation and uses a deep learning–based algorithm. Performance of the fluid segmentation was previously validated by 2 expert graders.
Statistical Analysis
All data are presented as the mean or mean ± SD. The BCVA was converted to logMAR notation for statistical purposes. Counting fingers VA was given a value of 1.85, and hand motions VA was given a value of 2.30. 17 Statistical analysis was performed with R statistical software (R Project for Statistical Computing). 18 The Pearson correlation coefficient (r) was used to quantify the correlation between the BCVA and fluid volume and the BCVA and area of nonperfusion using the ischemic index. Statistical significance was set at P < .05.
Deep Learning Algorithm and Fluid Analysis
A deep learning–based algorithm was implemented to segment fluid regions within each OCT volume (Figure 1). As reported previously, the method takes each OCT B-scan as input and a segmentation mask is generated automatically using Orion software. 19 The deep learning architecture used, first for training and subsequently for testing, was U-Net, which is a version of the autoencoder that uses skip connections to maintain better detail across different scales.20,21 U-Net uses 3 encoding/decoding levels, with learning based on minimization of the model’s loss, where the loss function combines categorical cross entropy and a weighted dice similarity coefficient. The subsequent fluid analysis examined linear trends between the baseline fluid levels in different regions of the macula and compared them with the 6-month change in BCVA. This relationship was measured with the Pearson correlation coefficient and was confirmed if the correlation coefficient remained strong when comparing the 6-month change in fluid levels with the 6-month change in BCVA.
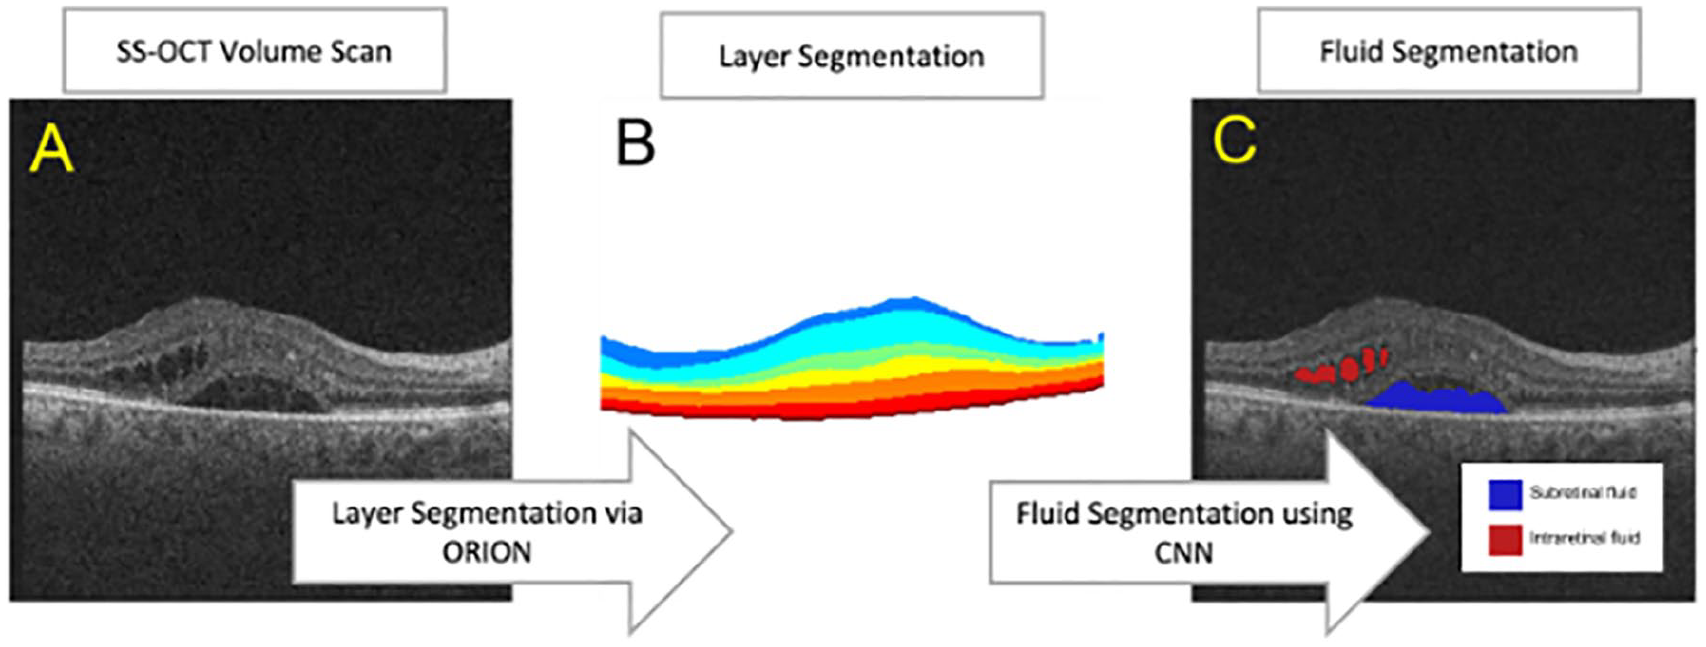
(A) The fluid segmentation algorithm first segments each SS-OCT volume scan into layers using Orion software. (B) The encoded layer information is then analyzed to segment the location of retinal fluid between (C) intraretinal fluid and subretinal fluid.
Analysis of Areas of Nonperfusion
As a proof-of-concept experiment, an algorithm was used to analyze OCTA images of the deep venous complex that consisted of 6.0 mm × 6.0 mm square snapshots (Figure 2). OCTA scans with poor image quality were discarded. Images were analyzed in Python programming language to estimate areas of nonperfusion, as described in previous studies. 22 These estimated areas of nonperfusion were converted into indices of ischemia based on the following formula:

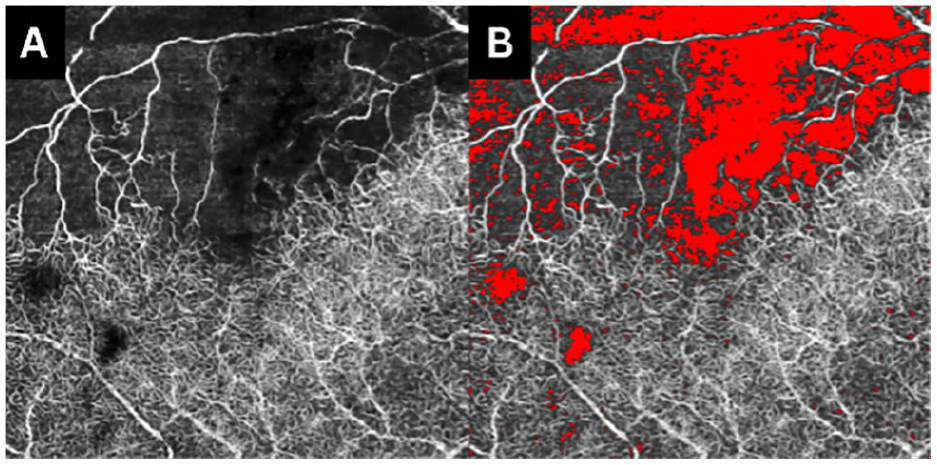
(A and B) Branch retinal vein occlusion visualization of the ischemic index at baseline.
Results
Patient Characteristics
Forty-nine patients (49 eyes) were enrolled in this study. The mean age of the 20 women and 29 men was 66.5 years. For the entire cohort, the mean logMAR BCVA at baseline was 0.885 logMAR, which improved to 0.484 logMAR by 6 months (P < .001). SS-OCT volume scans of the macula, comprising 12 544 images from the 49 patients, were used to quantify IRF, SRF, and fluid in the Early Treatment Diabetic Retinopathy Study quadrants and ellipse regions. Assessment used 10-fold cross-validation, where each fold ensured no patient’s eye data were included in the training or in the testing data.
Predictive Analysis
In the CRVO group, thickness in the OPL region showed the closest correlation to improvement in BCVA at 6 months (r = 0.782; P < .05). Total retinal fluid (IRF and SRF) in the fovea correlated with moderate improvement in BCVA at 6 months (r = 0.5340; P < .05). In the BRVO group, thickness in the OPL had the strongest correlation with improvement in BCVA at 6 months (r = 0.735; P < .05) (Figure 3). A significant correlation was also found with the total retinal fluid in the peripheral temporal region (r = 0.420; P < .05) (Tables 1 and 2 and Supplemental Tables 1 and 2). Although individual fluid volumes were weakly correlated, a combined model of thickness in the OPL, RNFL, and IRF volume had the strongest overall correlation in the CRVO group (r = 0.865; P < .05) (Supplemental Table 1). In the BRVO group, the addition of IRF to the OPL thickness model was strongly correlated (r = 0.803; P < .05) (Supplemental Table 2). Overall, thickness in the OPL region had the highest correlation with improvement in BCVA at 6 months in both the CRVO group and BRVO group.
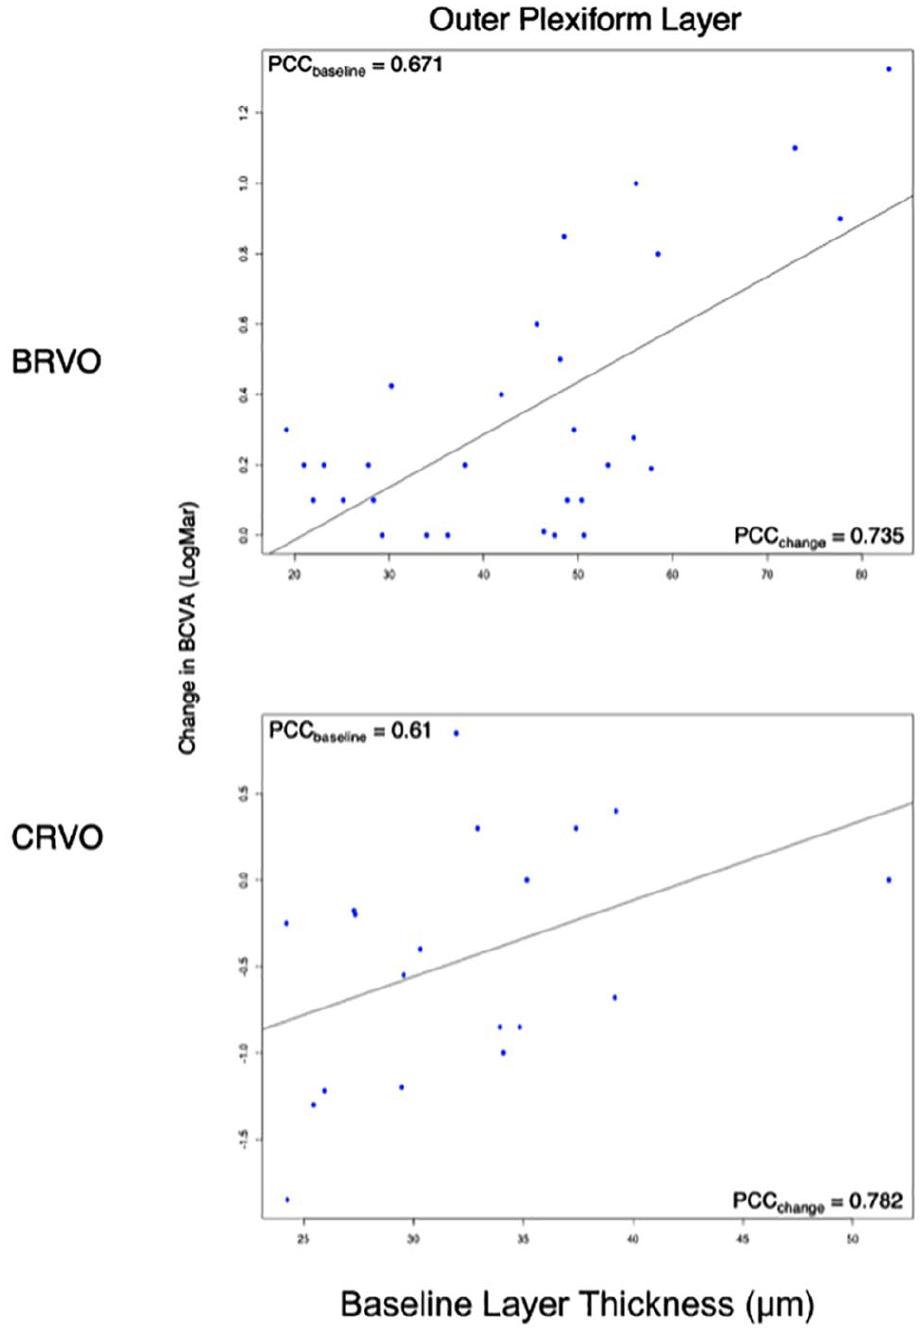
The relationship between layer thickness segmentations for the outer plexiform layer and the change in BCVA.
Regression Summary for Combined Fluid and Layer Thickness for CRVO Patients.

Abbreviations: CRVO, central retinal vein occlusion; IRF, intraretinal fluid; OPL, outer plexiform layer; PCC, Pearson correlation coefficient; RNFL, retinal nerve fiber layer.
Regression coefficients.
Overall model performance.
Regression Summary for Combined Fluid and Layer Thickness for Patients With BRVO.

Abbreviations: BRVO, branch retinal vein occlusion; IRF, intraretinal fluid; OPL, outer plexiform layer; PCC, Pearson correlation coefficient.
Regression coefficients.
Overall model performance.
Ischemic Index Analysis
The ischemic index analysis included 6 eyes with CRVO and 9 eyes with BRVO. In the CRVO group, the baseline ischemic index had a notable correlation with the 6-month change in BCVA (r = 0.9101; P < .001). In the BRVO group, the baseline ischemic index was strongly correlated with the 6-month change in BCVA (r = 0.9200; P < .001) (Figure 4, A and B).
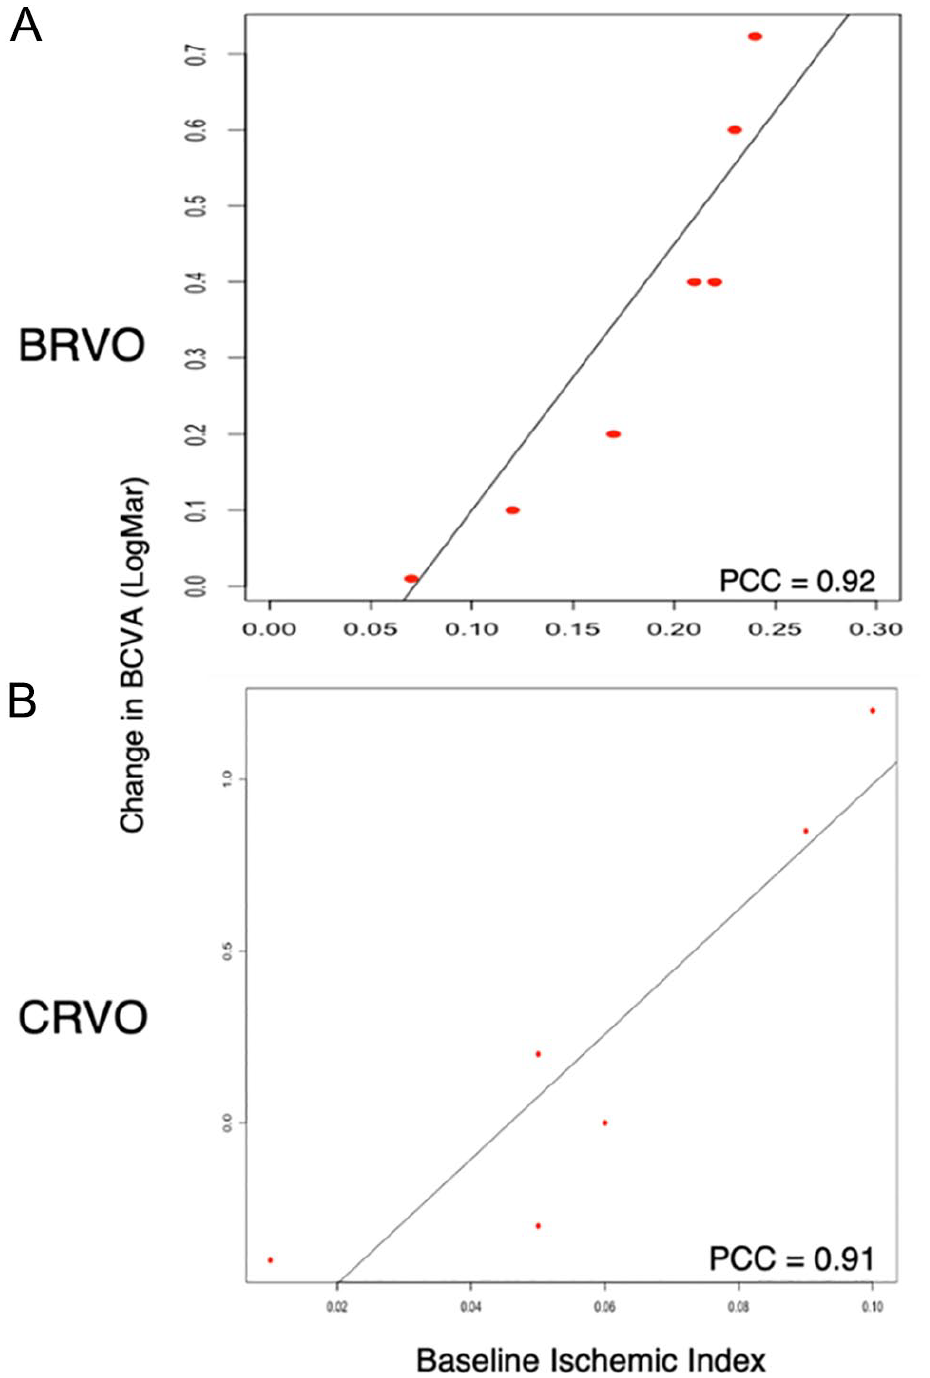
Comparison of baseline ischemic indices to the 6-month change in BCVA. (A) Branch retinal vein occlusion (BRVO) group. (B) Central retinal vein occlusion (CRVO) group.
Conclusions
The use of AI to automate the analysis of ophthalmic images and to quantify retinal biomarkers has increased in popularity globally. Previous studies of RVOs have used spectral-domain OCT (SD-OCT) to quantify fluid, and these data have been used to predict BCVA outcomes.10,23,24 Our study used a new deep learning algorithm to predict BCVA outcomes at 6 months in patients with RVOs and is, to our knowledge, the first to offer an automated approach to segment and quantify retinal fluid in SS-OCT scans. In addition, our study provides further evidence of the relationship between ischemia of the deep venous complex, development of intraretinal macular fluid, and subsequent atrophy of the retinal layers.
Our results show that a combined model of IRF, OPL thickness, and ischemic indices of the deep venous complex provided the best correlation with a change in BCVA. According to known pathophysiology, increased fluid with atrophy of layers leads to poor visual function. 15 The proposed pathophysiology of RVOs involves ischemia or occlusion preferentially affecting the deep venous complex, which supplies the OPL. 16 In response to ischemia, VEGF is released; however, the new vessels produced are prone to causing ME. As the macular fluid builds up, the vessels in the deep venous complex have reduced flexibility and ability to accommodate the fluid and become more occluded, causing further damage to the OPL and RNFL. 14 In summary, flow derangement within the deep venous complex is a critical aspect to vision loss in eyes with ME secondary to RVO. This finding could be related to our sample size; however, recent literature also shows a strong significant correlation between persistent IRF and BCVA outcomes, although there was no relationship with SRF. 23
The use of SS-OCT scans has the potential to increase the precision and recall of our automated algorithm because these devices capture 100 000 A-scans per second vs the approximately 68 000 A-scans per second captured by SD-OCT devices. 24 The increased frequency allows for quicker image acquisition and denser scan patterns at wider fields of view than standard SD-OCT. 11 Furthermore, SS-OCT penetrates the choroid deeper, is less affected by a poor tear film, and penetrates poor media, all of which improve signal-to-noise ratios and image quality. 23 This is clinically significant because it can reduce motion artifact in the data as well as reduce patient imaging time, enhancing the quality of the data and the patient experience.
Several OCT and OCTA biomarkers have been linked to visual outcomes in RVOs, including, but not limited to, a 100 µm increase in CST of intraretinal cysts at the center point, SRF at the center point, and hyperreflective foci in the central B-scan. 7 In the current study, we analyzed a subset of these biomarkers; however, others should be studied to expand the list of features that are predictive of long-term visual outcomes. In our study, the accumulation of IRF and the increased thickness in the OPL segment were predictive of visual function (Figure 1). The predictive outcomes of specific fluid types (eg, IRF or SRF) may also vary depending on the patients included in a study.
A limitation of our study is the number of included patients. This was intended to be a proof-of-concept trial to provide a signal and early evidence of the relationship between ischemia, layer thickness, retinal fluid quantities, and VA outcomes. Thus, to have a more robust fluid analysis for future studies, a larger sample is needed and all evaluated fluid subtypes should have a similar number of scans analyzed. Increasing the number of timepoints can also provide further insight into which biomarkers are predictive early or later in treatment.
Another significant biomarker examined in this study was the ischemic index. Analysis of this biomarker, although statistically significant, was performed for only 6 eyes in the CRVO group and 9 eyes in the BRVO group. This is the result of image-quality issues with the OCTA scans for the remaining patients because OCTA images can be further disrupted in patients with severe disease pathology.
Our group previously reported on automated fluid segmentation models in neovascular age-related macular degeneration, 25 and we have further shown its use in RVO. Our results are clinically consistent given that the deep venous complex supplies the OPL and as macular fluid accumulates, these vessels’ flexibility is reduced; thus, the vessels become more occluded and cause further damage to the OPL. This approach has potential for future application in telemedicine. Furthermore, with larger studies examining biomarkers in RVOs, this approach could continue to enhance the prediction of visual outcomes.
Supplemental Material
sj-docx-1-vrd-10.1177_24741264241308495 – Supplemental material for Machine Learning Quantification of Fluid Volume in Eyes With Retinal Vein Occlusion Treated With Aflibercept: The REVOLT Study
Supplemental material, sj-docx-1-vrd-10.1177_24741264241308495 for Machine Learning Quantification of Fluid Volume in Eyes With Retinal Vein Occlusion Treated With Aflibercept: The REVOLT Study by Mohammad A. Khan, Simrat K. Sodhi, Samantha Orr, John Golding, Austin Pereira, Ashley Patel, Jonathan D. Oakley, Daniel B. Russakoff, Anuradha Dhawan, Niveditha Pattathil and Netan Choudhry in Journal of VitreoRetinal Diseases
Supplemental Material
sj-docx-2-vrd-10.1177_24741264241308495 – Supplemental material for Machine Learning Quantification of Fluid Volume in Eyes With Retinal Vein Occlusion Treated With Aflibercept: The REVOLT Study
Supplemental material, sj-docx-2-vrd-10.1177_24741264241308495 for Machine Learning Quantification of Fluid Volume in Eyes With Retinal Vein Occlusion Treated With Aflibercept: The REVOLT Study by Mohammad A. Khan, Simrat K. Sodhi, Samantha Orr, John Golding, Austin Pereira, Ashley Patel, Jonathan D. Oakley, Daniel B. Russakoff, Anuradha Dhawan, Niveditha Pattathil and Netan Choudhry in Journal of VitreoRetinal Diseases
Footnotes
Ethical Approval
The study was approved by the Institutional Review Board, Advarra, and followed the tenets of the Declaration of Helsinki.
Statement of Informed Consent
Informed consent was obtained from all participants using a general consent form and was in accordance with section 4.8.10 of the current International Council on Harmonisation Good Clinical Practice guidelines.
Declaration of Conflicting Interest
Dr. Choudhry is a consultant to, with research support from, Bayer Inc, Hoffmann-La Roche, Optos, and Topcon; is a consultant to AbbVue, Apellis, Alcon Laboratories, Bausch + Lomb, Bayer Inc, Biogen, Hoffmann-La Roche, Johnson & Johnson Vision, Novartis, Optos PLC, RegenxBio, Topcon, and Viatris. Drs. Oakley and Russakoff are employees of Voxeleron. None of the other authors declared potential conflicts of interest with respect to the research, authorship, and/or publication of the article.
Funding
This study was supported by funding from Bayer Inc. The funding organization had no role in the design or conduct of this research.
Supplemental Material
Supplemental material is available online with this article.
References
Supplementary Material
Please find the following supplemental material available below.
For Open Access articles published under a Creative Commons License, all supplemental material carries the same license as the article it is associated with.
For non-Open Access articles published, all supplemental material carries a non-exclusive license, and permission requests for re-use of supplemental material or any part of supplemental material shall be sent directly to the copyright owner as specified in the copyright notice associated with the article.