
Abstract
Introduction
Dementia with Lewy bodies (DLB) is the second most common cause of neurodegenerative disease after Alzheimer disease, accounting for up to 7.5% of dementia cases.1 –4 Classically, its cardinal symptoms and signs include recurrent visual hallucinations, fluctuating cognition, rapid eye movement (REM) sleep disorder, and symptoms of parkinsonism such as bradykinesia and rigidity.5,6 There is, however, great variability in the relative severity of each of these symptoms. 7 This makes DLB a challenge to distinguish from other neurocognitive disorders such as Alzheimer disease, Parkinson disease, and mild cognitive impairment.7,8
In an effort to improve diagnostic accuracy, the DLB Consortium, a multinational panel of DLB experts, has created diagnostic guidelines.9 –11 The best studied of these guidelines is the 2005 Revised Criteria for the Clinical Diagnosis of DLB, which consisted of tiered diagnostic criteria highlighting various clinical symptoms of DLB. 10 Despite its thoughtful construction, this diagnostic tool had a sensitivity of 32.1%. 12 These guidelines were updated in 2017 to include objective diagnostic biomarkers. 11 However, only 3 biomarkers (reduced dopamine transporter uptake in the basal ganglia, abnormal iodine meta-iodobenzylguanidine myocardial scintigraphy, and polysomnography demonstrating REM sleep without atonia) were identified as “indicative.” 11 This evident lack of robust objective biomarkers shows the need for more accessible, reliable, and noninvasive biomarkers for DLB.
There has been increasing interest in the identification of retinal biomarkers in neurodegenerative disease.13 –16 As an extension of the central nervous system, the retina shares a similar structure to brain tissue with regard to vasculature as well as inflammatory milleu. 17 However, unlike the brain, the retina can be directly visualized, making it an ideal surrogate for monitoring the neuronal changes seen in neurodegenerative disease. 15 There is a growing association between retinal structural alterations and a diagnosis of DLB, with exploratory studies showing phosphorylated alpha-synuclein deposits, parafoveal thinning of the ganglion cell inner-plexiform layer (GC-IPL), and electroretinography alterations.18 –20
In this study, we assessed the use of optical coherence tomography (OCT) and OCT angiography (OCTA) to characterize the retinal and choroidal microvasculature and structure in individuals with DLB compared with controls with normal cognition.
Methods
The Duke Health Institutional Review Board approved this study (Pro00082598), which complied with the US Health Insurance Portability and Accountability Act of 1996 and the tenets of the World Medical Association Declaration of Helsinki. Written informed consent was obtained from all participants or a legally authorized representative before study enrollment.
Participants
Prospective study participants were individuals with a clinical diagnosis of DLB. The diagnosis of DLB was established by Duke neurologists specializing in memory disorders after a review of symptomatology, cognitive evaluation, and adjunct testing when available.
Prospective control participants were individuals with no history of neurodegenerative disease or cognitive impairment. Control participants were recruited from the Duke Neurological Disorders Clinic, the Duke Alzheimer’s Disease Prevention Registry of research volunteers of normal cognition, and the surrounding community. Participants from the Duke Alzheimer’s Disease Prevention Registry were classified as cognitively normal after undergoing an extensive battery of neuropsychological testing.
At the time of imaging, patients and caregivers were queried about a history of ophthalmic and medical conditions, which was then confirmed through medical record review when available. Nonmydriatic ultra-widefield scanning laser ophthalmoscopy imaging (Optos California, Optos) was obtained, and the images were reviewed to exclude participants with retinal pathology. Other exclusion criteria included a history of diabetes mellitus (DM), glaucoma, uncontrolled hypertension, other neurodegenerative disease, a Snellen visual acuity (VA) worse than 20/40 measured at the time of data collection, and a spherical equivalent (SE) of less than −6.00 diopters (D) or greater than +6.00 D.
Participants also had a cognitive evaluation with the Mini-Mental State Examination (MMSE) and completed a brief questionnaire, including a family history of neurodegenerative disorders and years of education at the time of image acquisition.
OCTA and OCT Image Acquisition and Protocols
All patients were imaged using the Cirrus HD-OCT 5000 with AngioPlex OCTA (software version 11.0.0.29946, Carl Zeiss Meditec). 21 The superficial capillary plexus vessel density (VD) and perfusion density (PD) were measured on 3 mm × 3 mm and 6 mm × 6 mm OCTA scans centered on the fovea. The VD was defined as the total length of perfused vasculature over the area measured, while the PD was defined as a percentage of area of perfused vasculature over the total area measured. Both the VD and PD were measured in an Early Treatment Diabetic Retinopathy Study (ETDRS) grid overlay using either the 3.0 mm ETDRS circle and ring or 6.0 mm ETDRS circle with inner and outer rings. The foveal avascular zone (FAZ) boundaries were automatically detected on the 3 mm × 3 mm scan, and the area was recorded. Study staff reviewed all FAZ boundaries and made adjustments when needed. Those that could not be adjusted were excluded from analysis. The radial peripapillary capillary (RPC) plexus, which runs parallel to ganglion cells in the retinal nerve fiber layer (RNFL), was assessed through a series of 4.5 mm × 4.5 mm images centered on the optic nerve head.
A thresholding algorithm was applied to the images to create a binary vessel slab. The vessels were linearized into 1-pixel widths, creating a vessel skeleton map. This was then used to calculate the capillary perfusion density (CPD) and capillary flux index (CFI). The CPD was defined as the percentage of perfused capillary vasculature over the area measured. The CFI was defined as a unitless ratio of perfused capillary vasculature weighted by the normalized flow intensity over the area measured. The flow intensity was quantified by vessel pixel brightness in the en face image. 22 The CFI represents the proportion of red blood cells in a given area at any point in time.
OCT images were acquired, including a 512 µm × 128 µm macular cube, a 200 µm × 200 µm optic disc cube, and a 21-line raster scan of the posterior pole (HD-21 line foveal image) with enhanced depth imaging (EDI). The macular cube image was used to calculate the central subfield thickness (CST) and GC-IPL thickness. The CST was defined as the thickness between the retinal pigment epithelium and inner limiting membrane at the fovea. To calculate the average GC-IPL thickness, a 14.13 mm2 elliptical area was centered on the fovea. The average RNFL thickness was calculated using a 3.46 mm diameter circle centered on the optic disc.
The choroidal vascularity index (CVI) was calculated using the Comprehensive Ocular Imaging Network to analyze high-definition 21-line foveal images with EDI. The CVI was defined as the ratio between the vascular luminal area (LA) and total choroidal area (TCA) and represents the vascularity of the choroid. Methods were previously described by Agrawal et al. 23 The TCA was selected with a polygonal tool, which was then used to segment 1.5 mm of the subfoveal choroidal area. The image was then binarized, converting gray-scale images into binarized images, and the color threshold tool was used to select the dark pixels. The dark pixels selected were defined as the LA. The CVI was then calculated by dividing the LA by the TCA. 24
All images were manually assessed for quality by trained study staff. Those with poor scan quality (less than 7/10 signal strength index or a significant imaging artifact) based on review were excluded from statistical analysis.
Statistical Analysis
Imaging metrics from patients with DLB were compared with those of controls with normal cognition. Statistical analysis was performed using SAS/STAT software (version 9.4, SAS System for Windows, 2002-2012, SAS Institute Inc). Demographic characteristics were compared to assess for possible confounders. The Fisher exact test of differences between proportions was used for categorical variables, and the Wilcoxon rank sum test was used for continuous variables. Generalized estimating equations (GEEs) were used to compare the imaging parameters between groups, accounting for the correlation between 2 eyes of the same study participant. A P value less than 0.05 was considered statistically significant.
Results
In the DLB group, 46 eyes of 23 patients were imaged. Of these, 6 eyes were excluded for the presence of DM, 2 eyes were excluded for the presence of glaucoma, 2 eyes were excluded for a mixed Alzheimer disease and DLB diagnosis, 1 eye was excluded for the presence of a retinal pathology, and 1 eye was excluded for a Snellen VA worse than 20/40. Thus, 34 eyes of 18 patients with DLB and 85 eyes of 48 cognitively normal participants were assessed. Table 1 shows the demographics of the study population. Patients with DLB had lower MMSE scores (P < .001). The DLB group and control group were well matched by age (P = .977) and sex (P = .607).
Demographics.
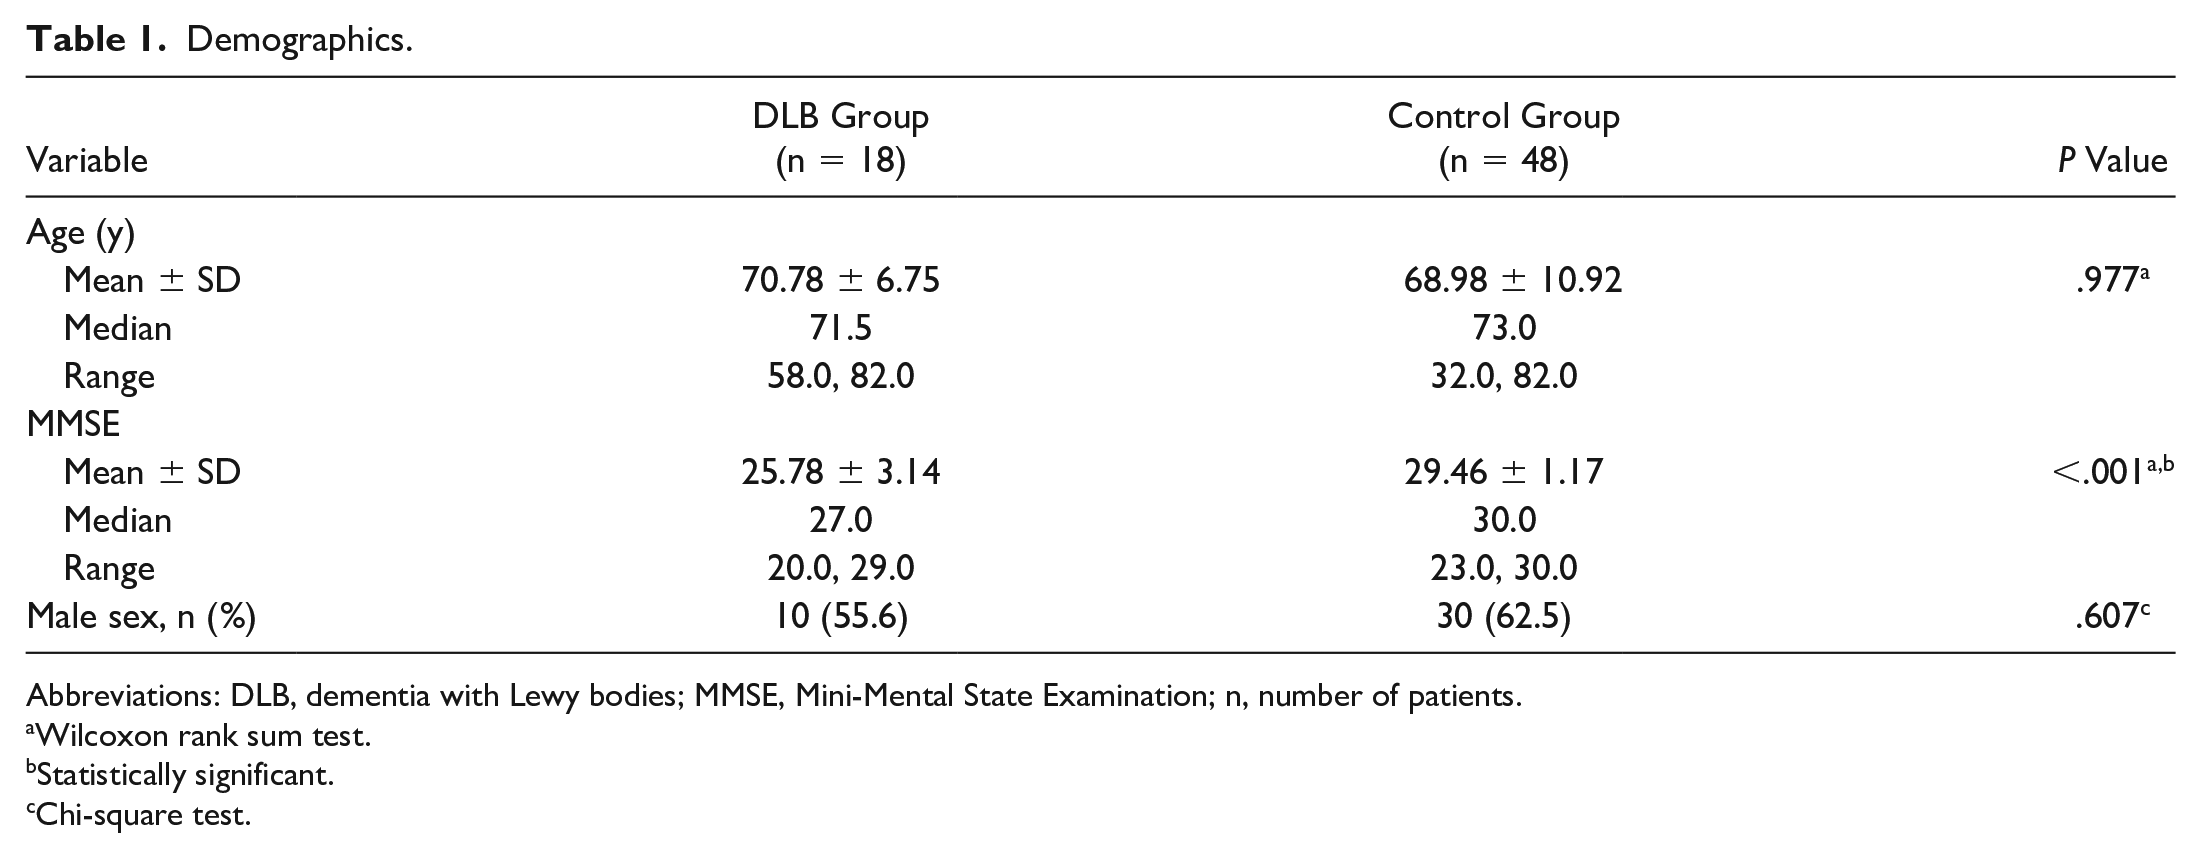
Abbreviations: DLB, dementia with Lewy bodies; MMSE, Mini-Mental State Examination; n, number of patients.
Wilcoxon rank sum test.
Statistically significant.
Chi-square test.
Table 2 shows the results of the GEE analysis of OCTA parameters. The average CPD was higher in patients with DLB than in controls (P = .005). The average CFI was lower in the DLB group than in the control group (P = .016). There were no other between-group differences in the OCTA parameters measured.
Generalized Estimating Equation Analysis of OCTA Parameters.
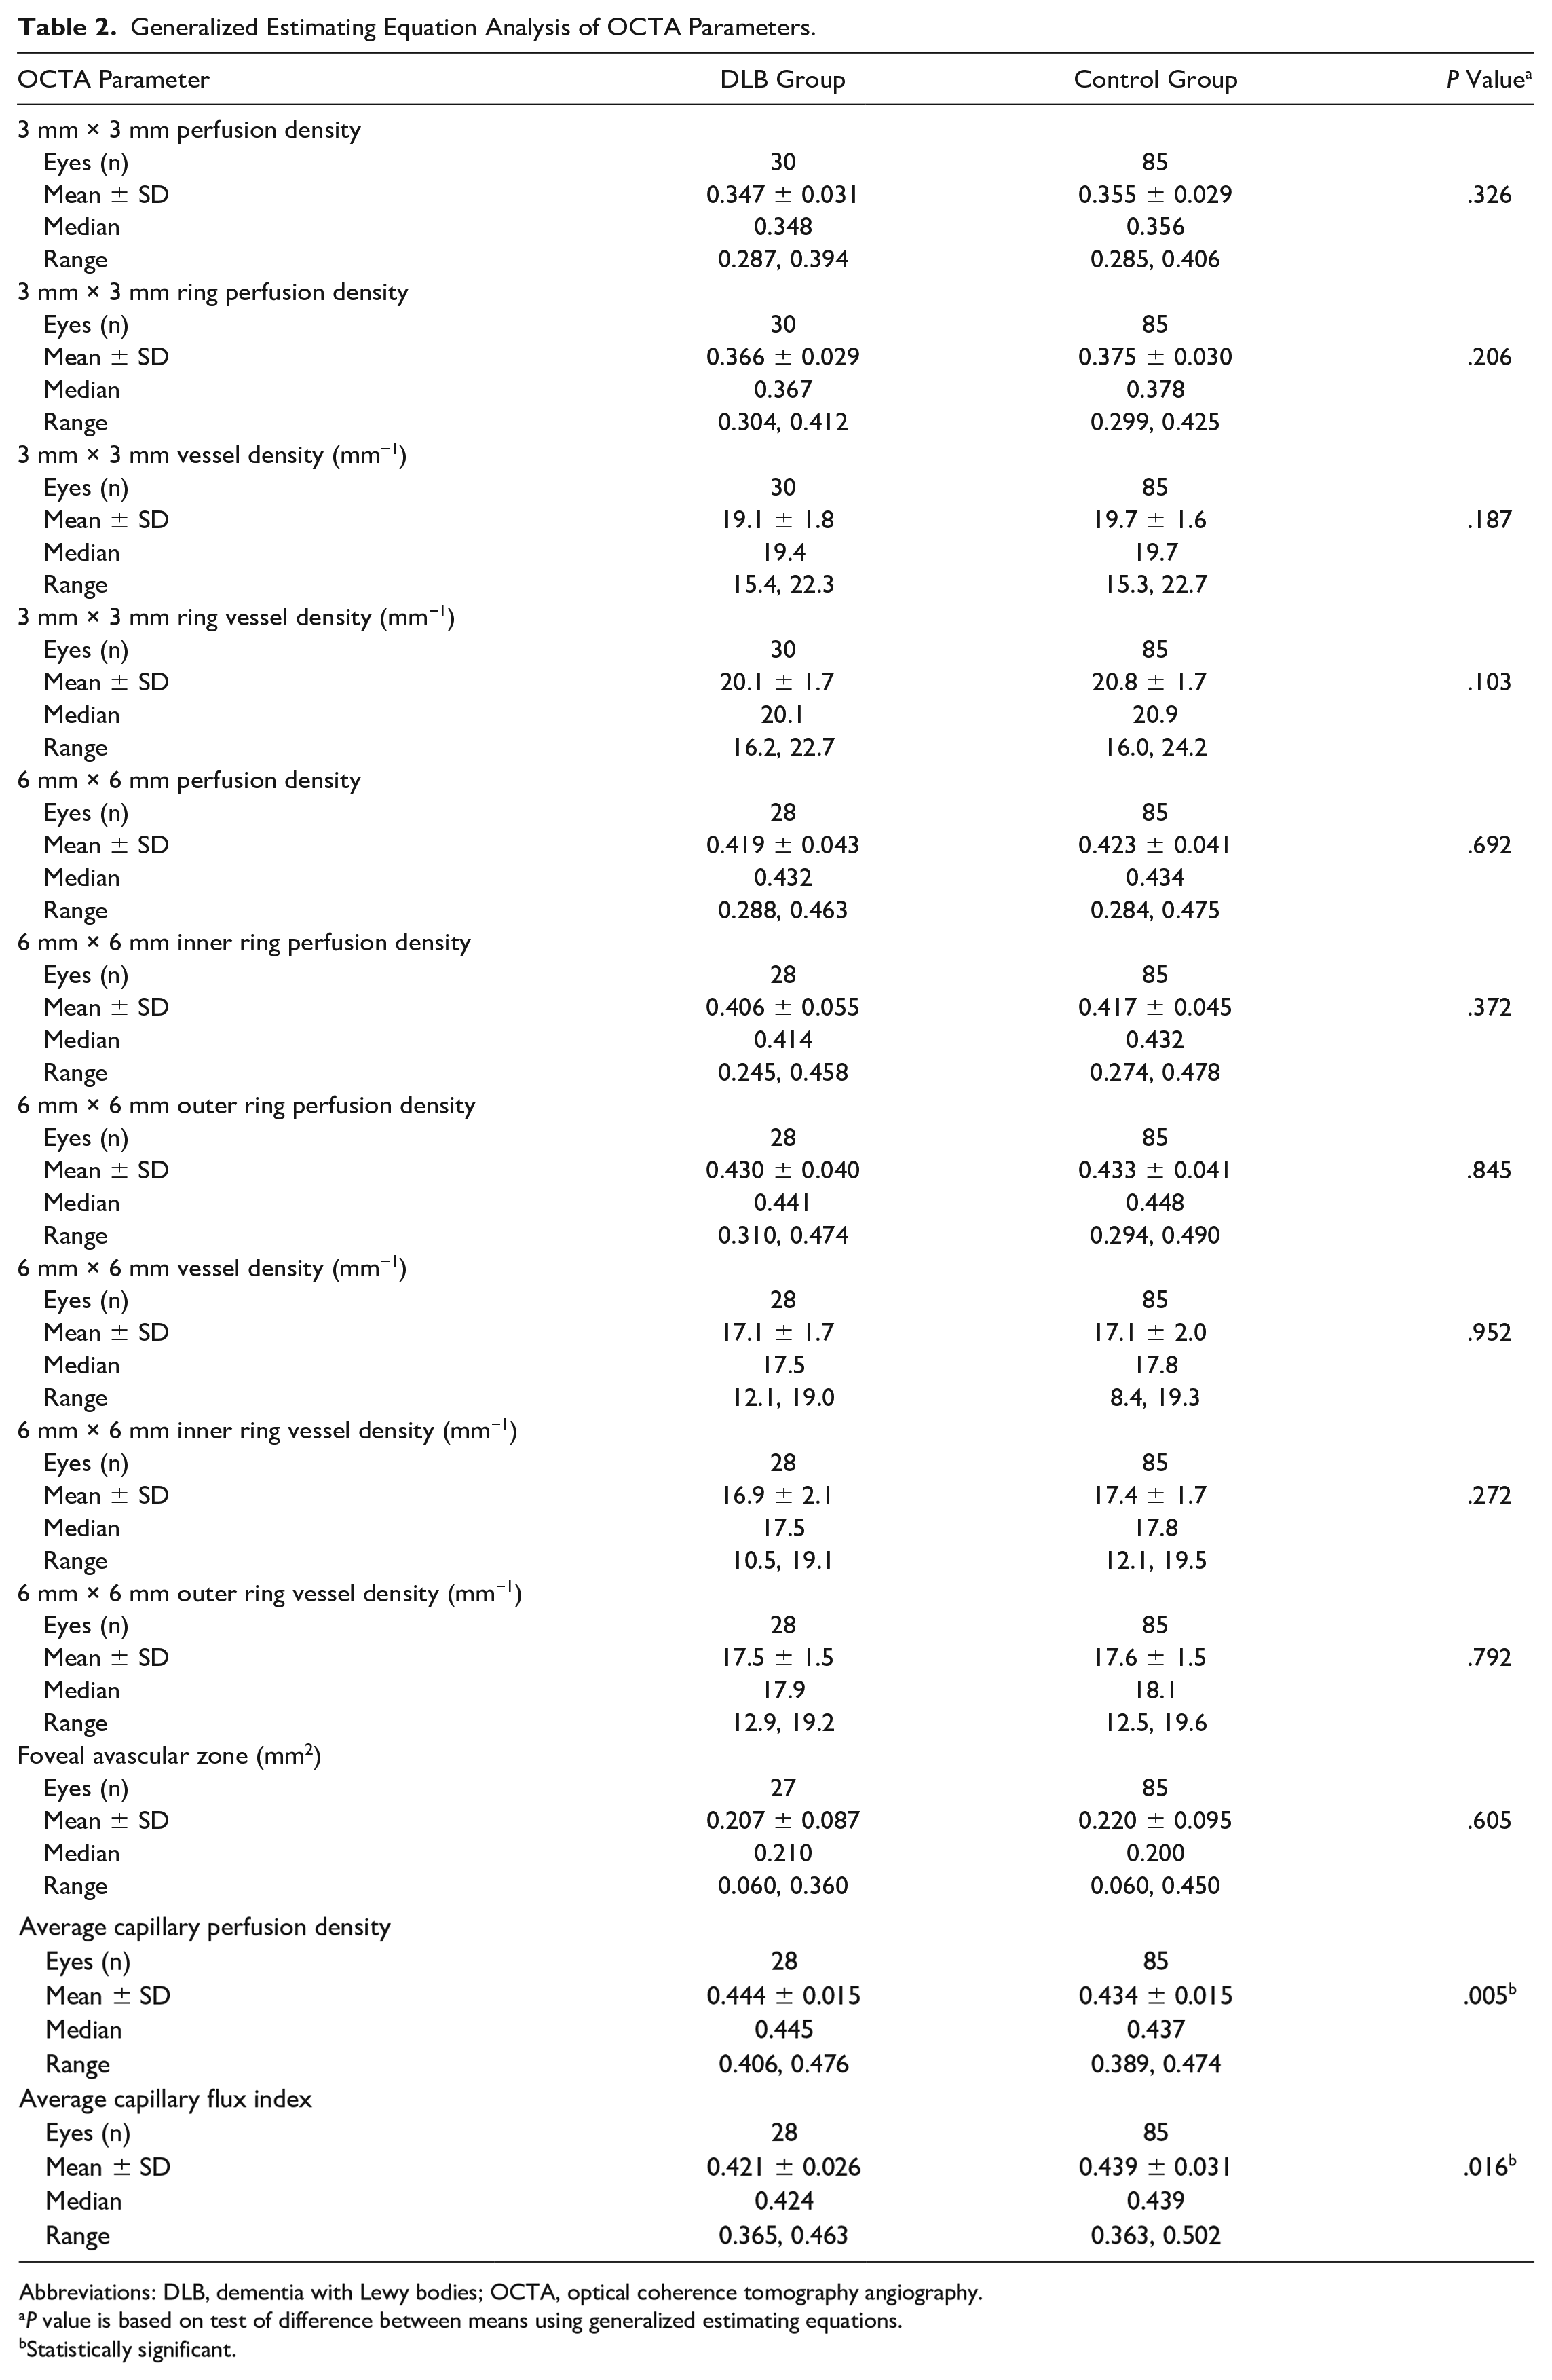
Abbreviations: DLB, dementia with Lewy bodies; OCTA, optical coherence tomography angiography.
P value is based on test of difference between means using generalized estimating equations.
Statistically significant.
Table 3 shows the results of the GEE analysis of OCT parameters. The DLB group had a decreased average GC-IPL thickness (P = .040) compared with the control group. The 2 groups did not differ in the CST (P = .705), average RNFL thickness (P = .072), or CVI (P = .127). Table 4 shows additional analysis of the quadrant data for the RNFL thickness. The inferior quadrant was significantly thinner in the DLB group than in the control group (P = .014).
Generalized Estimating Equation Analysis of OCT Parameters.
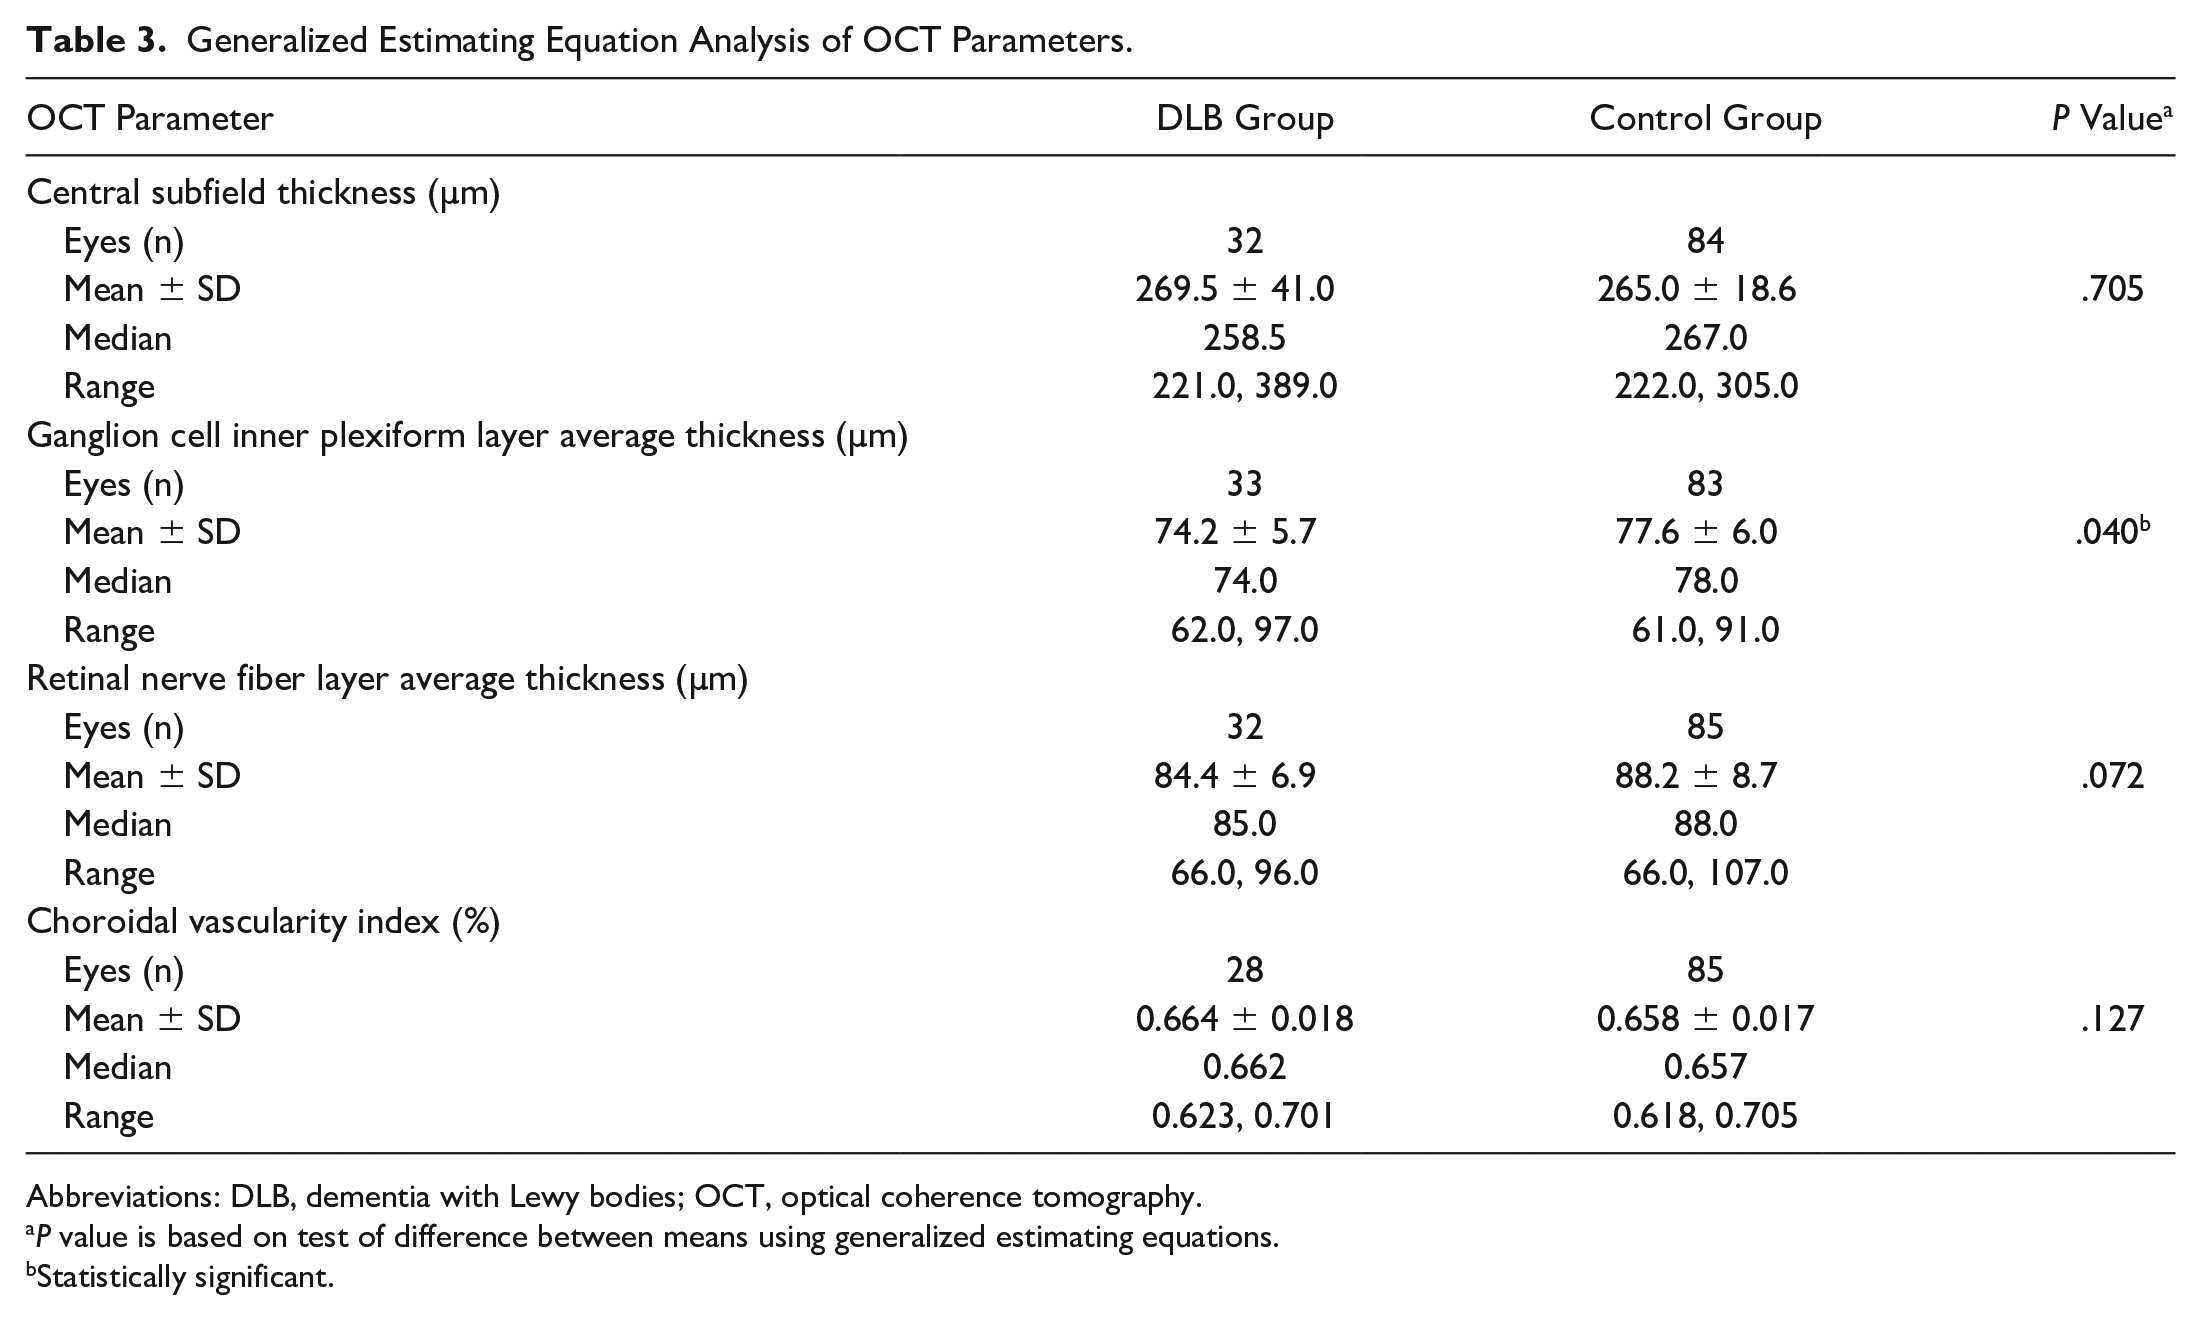
Abbreviations: DLB, dementia with Lewy bodies; OCT, optical coherence tomography.
P value is based on test of difference between means using generalized estimating equations.
Statistically significant.
Generalized Estimating Equation Analysis of RNFL Quadrant Thickness.
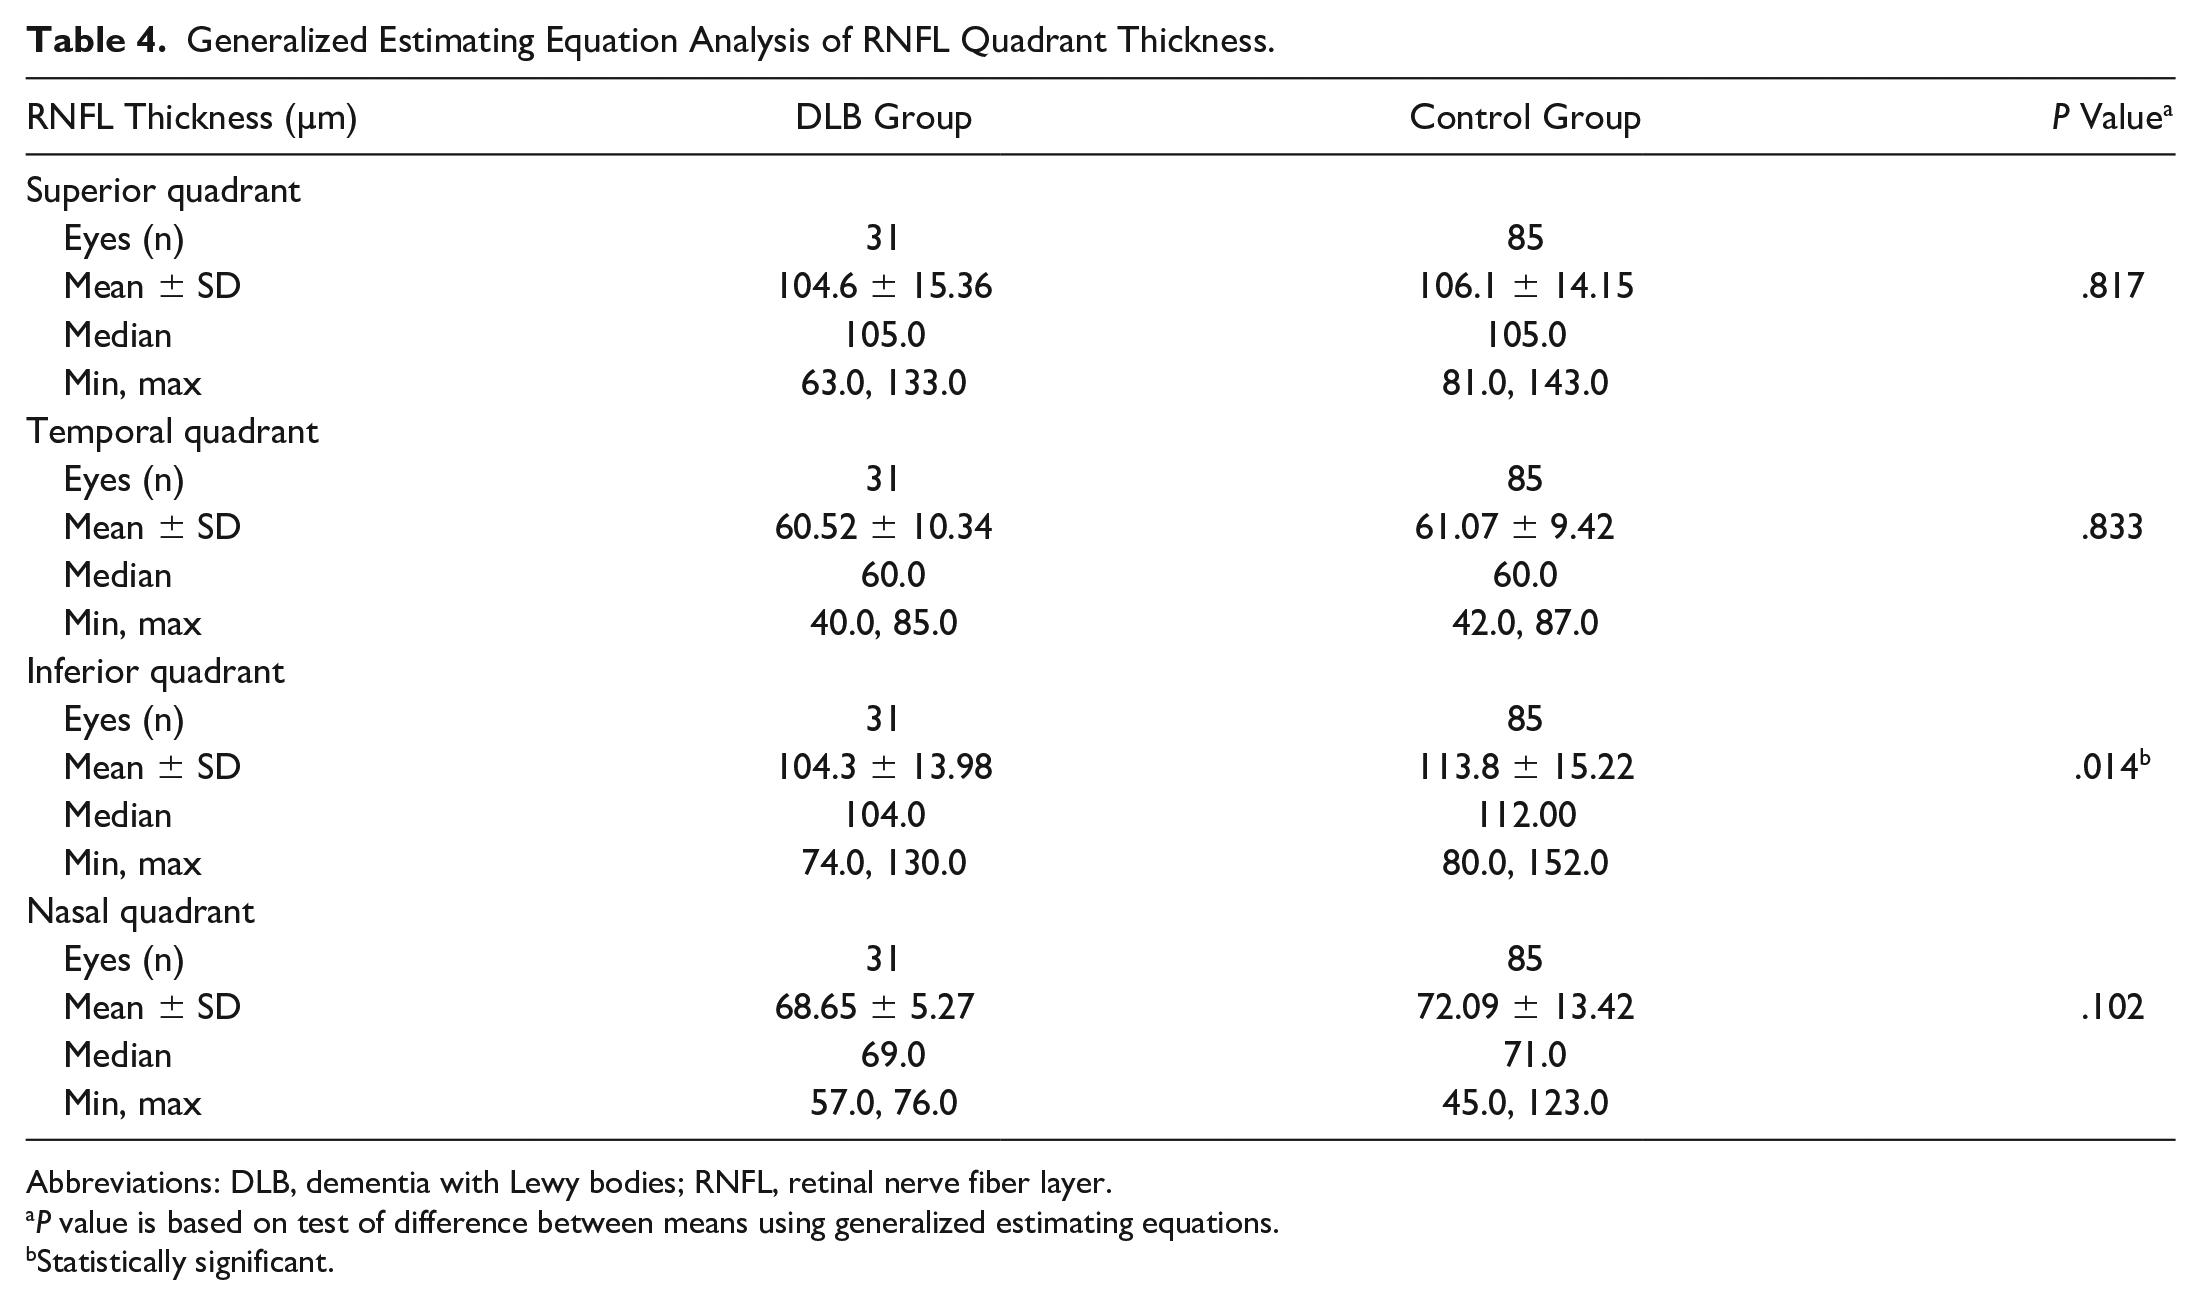
Abbreviations: DLB, dementia with Lewy bodies; RNFL, retinal nerve fiber layer.
P value is based on test of difference between means using generalized estimating equations.
Statistically significant.
Conclusions
To our knowledge, this is the first cross-sectional study to use OCTA to evaluate the peripapillary RPC plexus in patients with DLB. We found an increased peripapillary CPD and a decreased peripapillary CFI in patients with DLB compared with those with normal cognition. The repeatability of the peripapillary CPD and CFI has been established in patients with neurodegenerative disease as well as in individuals with normal cognition; therefore, these parameters have the potential to function as noninvasive DLB biomarkers. 25 In addition, we found attenuated GC-IPL thickness in patients with DLB, which is consistent with results in previous studies.19,26,27
The increased peripapillary CPD seen in DLB could be partially the result of increased inflammatory and angiogenic signaling, as is seen in other neurodegenerative disorders such as Alzheimer disease and multiple sclerosis.28 –31 This hypothesis is supported by Desai Bradaric et al, 32 who reported increased angiogenesis in patients with incidental postmortem tissue findings of Lewy bodies in the absence of parkinsonian or cognitive symptoms (prodromal Lewy body dementia). This shows that increased angiogenesis may be present early in the disease pathogenesis, preceding clinical manifestations. 32 Vascular changes could, therefore, be used as a means for early disease detection. 32
Some studies suggest that the increased angiogenesis seen in DLB could be the result of the pathologic activation and dysfunction of microglia, which can mediate angiogenesis in the brain via the secretion of cytokines.32 –34 The activation of microglia in DLB could be caused by alpha-synuclein, a major component of Lewy bodies.35,36 This pathophysiology of microglia-driven angiogenesis may also extend to the retina given that phosphorylated alpha-synuclein has been observed in the retinas of patients with DLB.18,37 We therefore hypothesize that angiogenesis in the peripapillary retina may in part be a response to the deposition of alpha-synuclein in the retina in DLB.
We also found a decreased peripapillary CFI in DLB patients. The CFI represents retinal capillary blood flow. 38 Several studies have found decreased cerebral perfusion in patients with DLB.39 –42 We postulate that this decrease in cerebral perfusion translates to a decrease in retinal perfusion, which is also seen in Alzheimer disease. 43 When coupled with the release of inflammatory cytokines, the decreased retinal perfusion may contribute to a compensatory increase in the peripapillary retinal blood vessel formation seen by the increased CPD. However, the CFI remains reduced, suggesting this compensatory revascularization is insufficient to restore normal blood flow.
Although the RPC plexus serves in part to nourish the RNFL, 44 there was no change in the average RNFL thickness between individuals with DLB and cognitively normal controls. This finding of peripapillary changes in the setting of normal RNFL thickness has similarly been seen in Parkinson disease, which may suggest that changes in RPC density may precede changes in RNFL thickness. 14 Previous studies have reported mixed results on the thinning of the RNFL in both DLB and Alzheimer disease.45,46 When attenuation of the RNFL was found in Alzheimer disease, it was noted primarily in the superior and inferior quadrants.47 –49 Similarly, when analyzing the quadrant data of our cohort, we found thinning of the inferior quadrant in the DLB group.
The decreased GC-IPL thickness in our study mirrors findings in previous studies of DLB and prodromal Lewy body dementia.19,26,27 The GC-IPL consists of ganglion cell bodies and dendrites in the retina, such as amacrine dendrites.50,51 Although the specific mechanism of GC-IPL attenuation has not yet been identified, preclinical animal models of Parkinson disease, which shares a pathogenesis similar to that of DLB, have shown significant loss of amacrine cells.2,52 Furthermore, attenuation of the GC-IPL has been reported in Parkinson disease, mild cognitive impairment, and Alzheimer disease.53,54 This suggests that GC-IPL attenuation may be secondary to neurodegeneration. Our findings support the claim that GC-IPL attenuation could be a relevant biomarker for DLB.
There are some limitations to this study that should be considered when interpreting the results. Although the neurological diagnoses were made by trained neurologists, there is considerable overlap in clinical presentation among the various forms of dementia. Therefore, all diagnoses have varying levels of uncertainty. A definitive diagnosis of DLB can only be made through postmortem tissue analysis. 3 The retinal findings we observed may not be unique to DLB but instead may be representative of nonspecific neurodegeneration. Given our exclusion criteria, including uncontrolled hypertension, DM, glaucoma, and vitreoretinal pathology, our control patients are not representative of all patients, which at present limits the applicability of these findings to a specific patient subset.
Furthermore, we did not perform visual field testing or intraocular pressure testing to fully assess for glaucoma, which can lead to a reduced peripapillary CPD and CFI. However, patients were screened for glaucoma through patient-reported history, a review of widefield images, and a medical record review. We did not account for image scaling error caused by varying axial lengths (ALs). 55 However, we excluded individuals with an SE less than −6.00 D or greater than +6.00 D. Previous work found that this limits the magnitude of differences seen in OCTA parameters resulting from AL. 56 In addition, we were unable to image some patients with advanced DLB because they were unable to maintain adequate fixation during imaging, to follow imaging cues provided by study staff, and to maintain proper head positioning.
In conclusion, we found an increased peripapillary CPD, decreased peripapillary CFI, and decreased GC-IPL thickness in patients with DLB compared with those with normal cognition. These findings suggest that retinal imaging metrics have the potential to serve as clinically relevant biomarkers for a diagnosis of DLB.
Footnotes
Ethical Approval
This study is in compliance with the US Health Insurance Portability and Accountability Act of 1996 and the tenets of the World Medical Association Declaration of Helsinki. The Duke Health Institutional Review Board approved this study (Pro00082598).
Statement of Informed Consent
Written informed consent was obtained from all participants or their legally authorized representative.
Declaration of Conflicting Interests
The author(s) declared no potential conflicts of interest with respect to the research, authorship, and/or publication of this article.
Funding
The author(s) disclosed receipt of the following financial support for the research, authorship, and/or publication of this article: This study was supported in part by a Research to Prevent Blindness unrestricted grant.