
Abstract
Purpose:
The purpose of this article is to investigate automated segmentation measurements of the outer nuclear layer to differentiate patients with hydroxychloroquine toxicity from healthy individuals.
Methods:
A 5-year retrospective, case-controlled, interventional study of hydroxychloroquine toxicity patients was conducted. Measurements of the outer nuclear layer were obtained with use of commercially available segmentation software and compared with controls.
Results:
Seven participants (13 eyes) with toxicity and 16 controls (16 eyes) were included. The data comparing the parafoveal, perifoveal, foveal, and overall regions were significant both in thickness (P < .0001, P < .0001, P = .0029, and P < .0001, respectively) and volume (P < .0001, P < .0001, P < .0001, and P < .0001, respectively). The CI indicates there is 95% confidence that toxicity patients have between 147 μm and 201 μm less thickness (average 174 μm) and between 0.39 mm3 and 0.55 mm3 less volume (average 0.47 mm3).
Conclusions:
The automated segmentation function can correctly differentiate thinner outer nuclear layer measurements in patients with toxicity. This study is the first to establish the ranges of thickness and volume of the outer nuclear layer with commercially available segmentation. These results provide the first step in determining whether automated segmentation measurements of the outer nuclear layer can be used as an objective screening tool for hydroxychloroquine toxicity.
Introduction
Hydroxychloroquine (HCQ) is a medication that is often prescribed to treat autoimmune conditions, including rheumatoid arthritis 1,2 and systemic lupus erythematosus. 1,3,4 In addition, it can be utilized as an adjuvant treatment for cancer 5 and diabetes. 1,6 Although HCQ has few systemic side effects, 7 continuous use can lead to irreversible vision loss due to retinal atrophy and damage to the retinal pigment epithelium (RPE). 1,8,9 Guidelines published by the American Academy of Ophthalmology in 2016 1 advance the understanding of risk factors for HCQ toxicity, as well as the current screening recommendations.
Top risk factors include high daily dose and duration of use. 9 -11 Recommendations are now less than 5.0 mg per kg per day, and some papers suggest that the dosage be based on actual body weight (ABW) instead of ideal body weight (IBW). 1,12 At this lower dose, retinal toxicity occurs in less than 1% of patients after 5 years of use; however, the risk can increase to 20% after 20 years of use. 12 Additional risk factors for developing toxicity include the presence of renal disease, 1,12,13 and concurrent use of tamoxifen. 12 Genetic susceptibility is unclear. 14,15 Caution is advised when evaluating patients on HCQ with preexisting macular disease, particularly ones with significant photoreceptor involvement, as that may affect the accuracy of screening tests. 1
Patients taking HCQ can be screened for toxicity with spectral-domain optical coherence tomography (SD-OCT), 11,15 -18 visual field (VF), 19 fundus autofluorescence (FAF), 11,15 multifocal electroretinogram, 20 -22 microperimetry, 1 and adaptive optics. 1 Updated guidelines support the use of SD-OCT and VF as preferred screening methods. 1 Retinal findings of toxicity for patients on HCQ include loss of the external limiting membrane (ELM), disruption of the ellipsoid zone (EZ), thinning of the outer nuclear layer (ONL), and atrophy of the retinal pigment epithelium (RPE). 11,19,23,24
SD-OCT is a useful tool in detecting retina changes from HCQ toxicity. This is not only because of its high specificity and objectivity, but also because of its wide availability to ophthalmologists. 25 The evaluation of SD-OCT in patients undergoing treatment with HCQ has also advanced the understanding of disease presentation. 12,26 Rodriguez-Padilla et al first identified disruption to the perifoveal photoreceptor layer using SD-OCT in patients with HCQ toxicity. 16 This finding was confirmed in more recent reports that indicate photoreceptor damage demonstrated by paracentral EZ disruption. 27 Although disruption of the outer retina is accepted as an early change in patients with toxicity, no studies have been conducted to quantify the degree of difference between healthy controls and affected patients to determine whether specific measurements can provide objective and specific biomarkers for toxicity.
This study investigates whether an automated algorithm can be used to reliably measure a difference in the ONL between patients with known HCQ toxicity and normal controls. To address this question, we used segmentation software on the Spectralis (HRA+OCT, Heidelberg Engineering) to isolate and measure ONL thickness and volume. The Spectralis was used because it is commercially available and can be of assistance to clinicians who do not have time or access to resources that can supply manual interpretation. This is the first study to validate the use of this automated segmentation function for this purpose. This study is also the first to quantify measurements of ONL in disease and in healthy individuals on the Spectralis. We selected the ONL because of recent work that identified ONL thinning as a key finding in patients with HCQ toxicity 23,28 because changes in this layer occur before vision-threatening RPE damage develops. 28 -30 Detection of toxicity in the ONL is critical because cessation of the drug at this stage may prevent RPE damage and, ultimately, vision loss. 19,24
Methods
Inclusion and Exclusion Criteria
A retrospective review was performed identifying patients taking HCQ who were screened for toxic effects from January 1, 2010 through December 31, 2015, at Carle Foundation Hospital (CFH). The research protocol was approved by the CFH Institutional Review Board (no. 15007). The research followed procedures set forth by the Health Insurance Portability and Accountability Act (HIPAA), and the tenets of the Declaration of Helsinki.
Thirty-six individuals with confirmed or suspected HCQ toxicity were identified by International Statistical Classification of Diseases (ICD-9) codes (E931.4, V67.51, V58.69, and 362.55). Of these individuals, only cases of confirmed HCQ toxicity that had SD-OCT images of the macula with good signal quality (≥20) were included. Those with ocular conditions that would alter the OCT images, such as high myopia (>6 diopters), epiretinal membrane, or macular degeneration, were excluded from the study, as were individuals younger than age 18. If eligible, bilateral eyes for each participant were included. Based on these criteria, 29 people were eliminated.
The final toxicity group consisted of 13 eyes from 7 individuals (Table 1). For the control group, 16 eyes from 16 age-matched participants with normal OCT images were selected. Only unilateral eyes were included because most of the contralateral eyes had other disease. Medical records for each participant were reviewed for basic demographic data; height and weight were obtained the same day as the OCT image. Information on HCQ daily dose was acquired, including cumulative dose and treatment duration.
Participant Demographics of Toxic and Control Groups Including Data on Risk Factors for Toxicity.
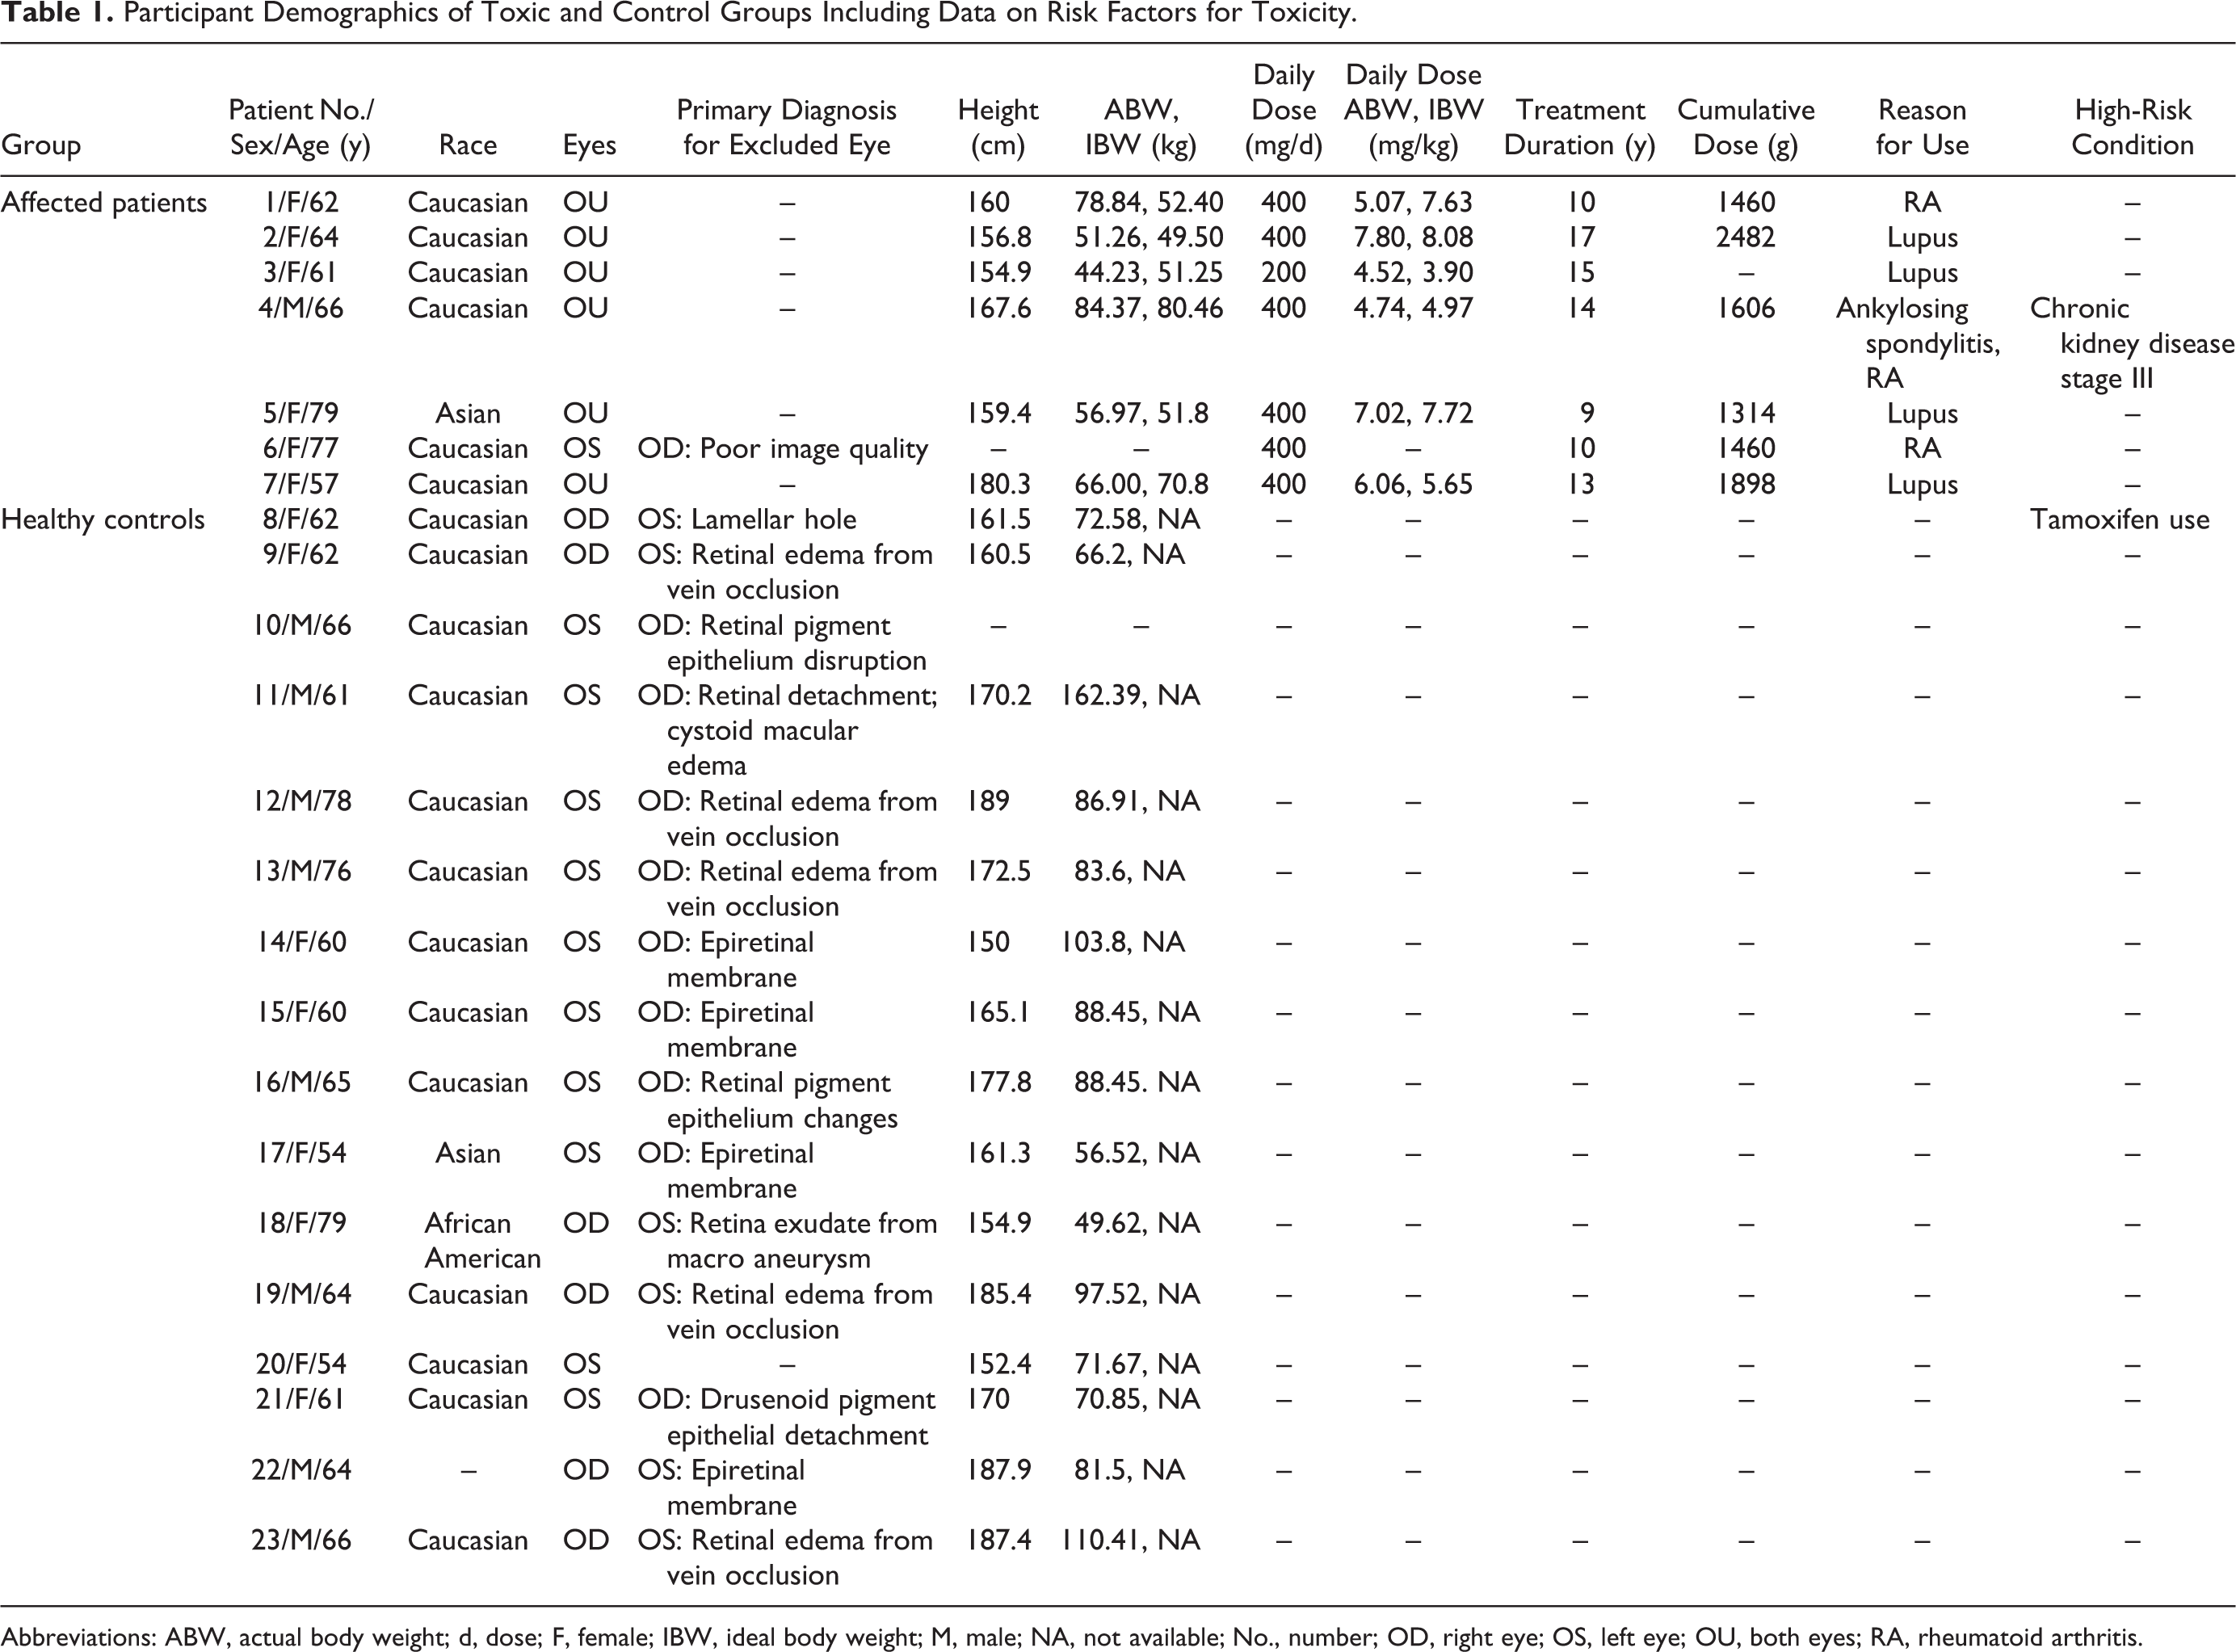
Abbreviations: ABW, actual body weight; d, dose; F, female; IBW, ideal body weight; M, male; NA, not available; No., number; OD, right eye; OS, left eye; OU, both eyes; RA, rheumatoid arthritis.
Clinical Diagnosis of HCQ Toxicity
Clinical diagnosis of HCQ toxicity was verified by a retina specialist based on history of HCQ use, clinical exam, and ancillary testing available (Table 2). Determination of toxicity included evaluation of fundus with exam notes and fundus photography (FP) for bull’s eye maculopathy, and FAF for abnormal signal (Figure 1, A and B), Humphrey VF for scotomas (Figure 1, C and D), and SD-OCT for retina changes typical of toxicity (Figure 1, E and F). Each SD-OCT image was generated using 512 × 496 density volume scans with 49 individual B-scans taken centered on the fovea using the high-speed setting with an automatic real time of 16 frames. Each image was processed using the segmentation feature on the Heidelberg Eye Explorer (1.9.10.0) according to the following steps: (1) the “segmentation” and “all layers” function was selected by right-clicking on the volume scan on the Heidelberg Eye Explorer Review Software, which processes the volume scan; (2) the image was then viewed under the “Thickness Map” tab with the Early Treatment Diabetic Retinopathy Study (ETDRS) 31 grid overlay with 1, 3, and 6 mm concentric circles centered on the fovea; (3) within the module, “ONL” was selected from the “Layers” drop-down menu, which isolates the ONL with boundary lines from the bottom of the outer plexiform layer to the ELM (Figure 2). Each image within the volume scan was reviewed to ensure that the boundary lines were accurate and that the ETDRS overlay was centered on the fovea by a trained member of the research team. No manual adjustments or corrections were needed for the study scans; a few scans had small degenerative cystoid changes that did not affect the algorithm. Measurements for the isolated ONL (generated in each of the 9 ETDRS sections by the algorithm) were recorded (Figure 3). Overall thickness measurements were obtained by adding all subsections reported in the ETDRS grid.
Clinical Testing With Optical Coherence Tomography, Visual Field, and Fundus Imaging.
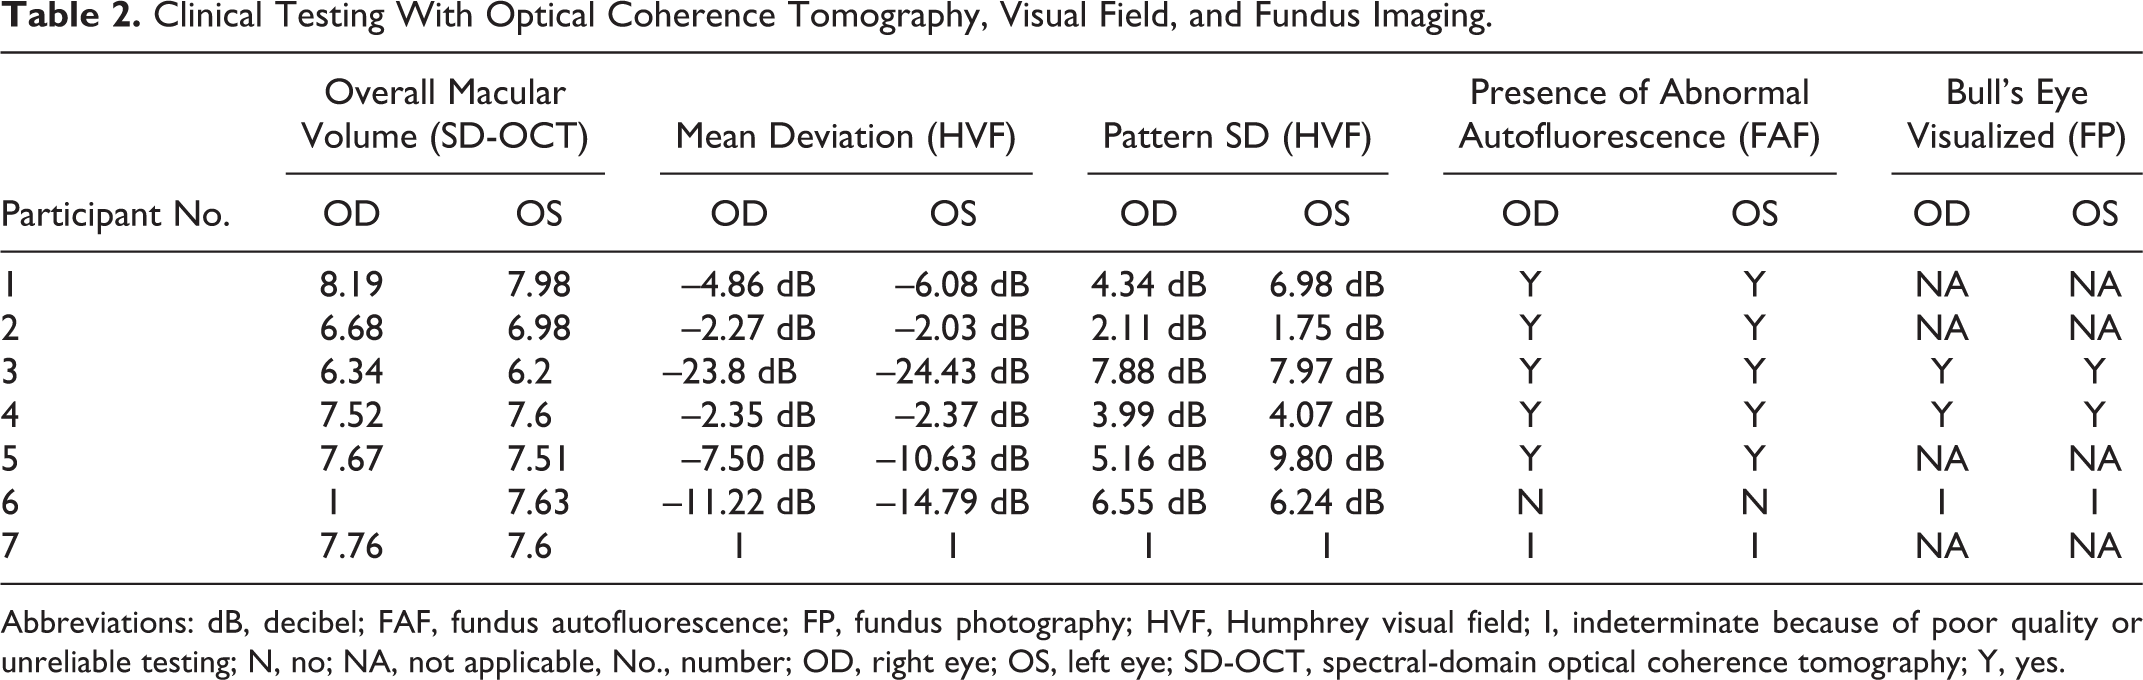
Abbreviations: dB, decibel; FAF, fundus autofluorescence; FP, fundus photography; HVF, Humphrey visual field; I, indeterminate because of poor quality or unreliable testing; N, no; NA, not applicable, No., number; OD, right eye; OS, left eye; SD-OCT, spectral-domain optical coherence tomography; Y, yes.
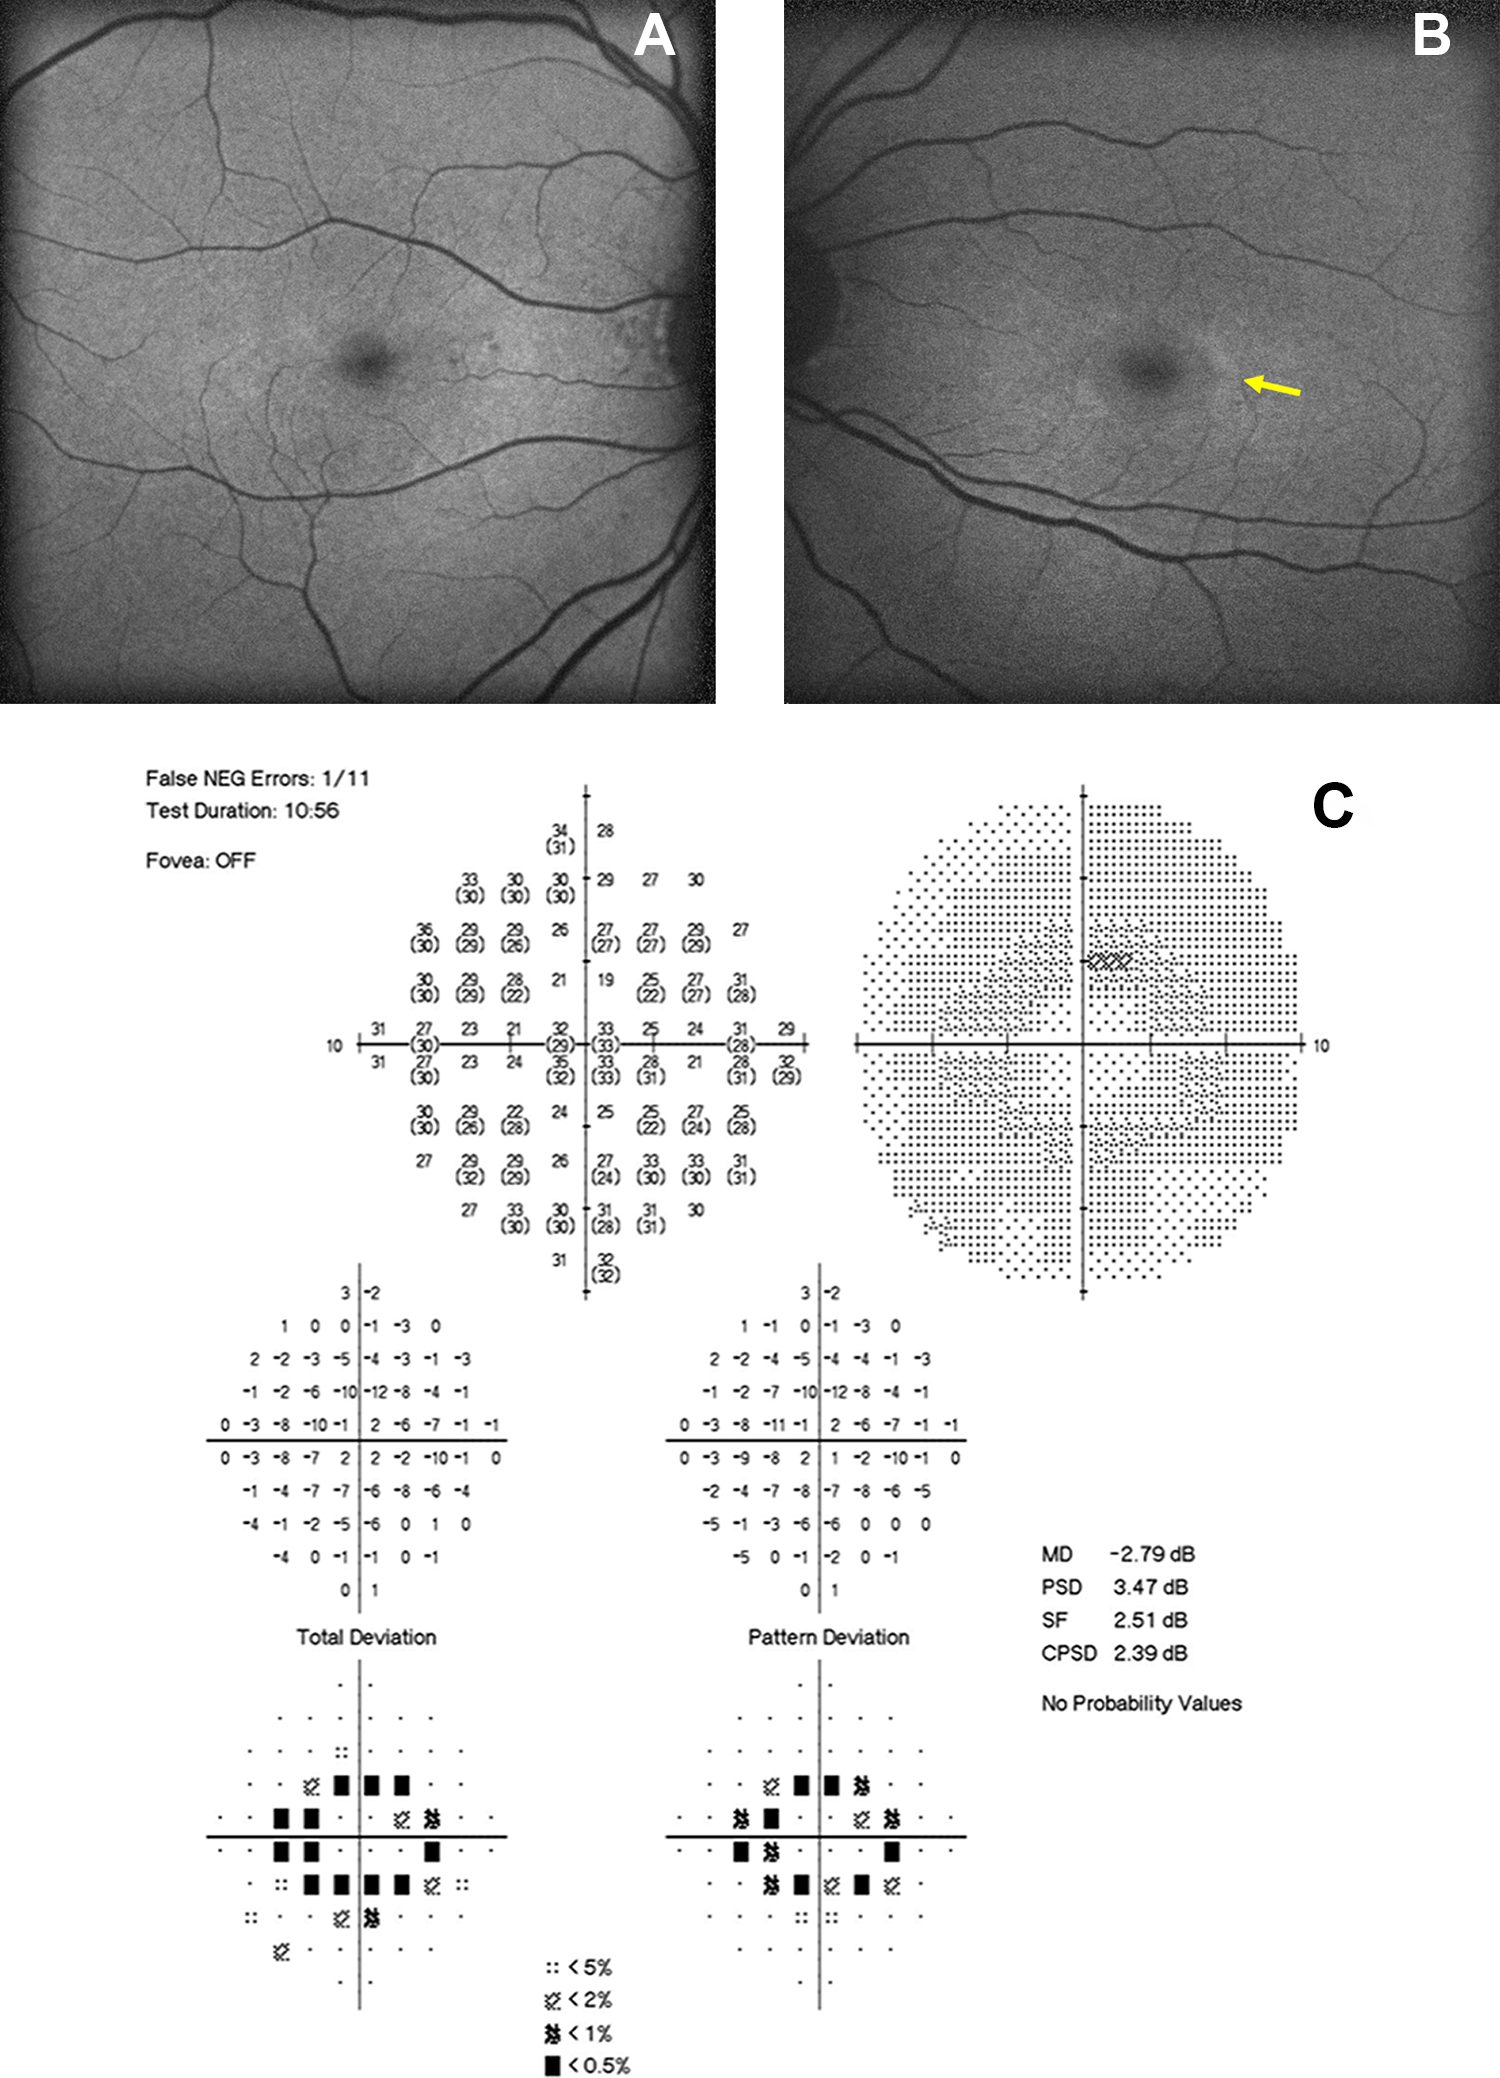
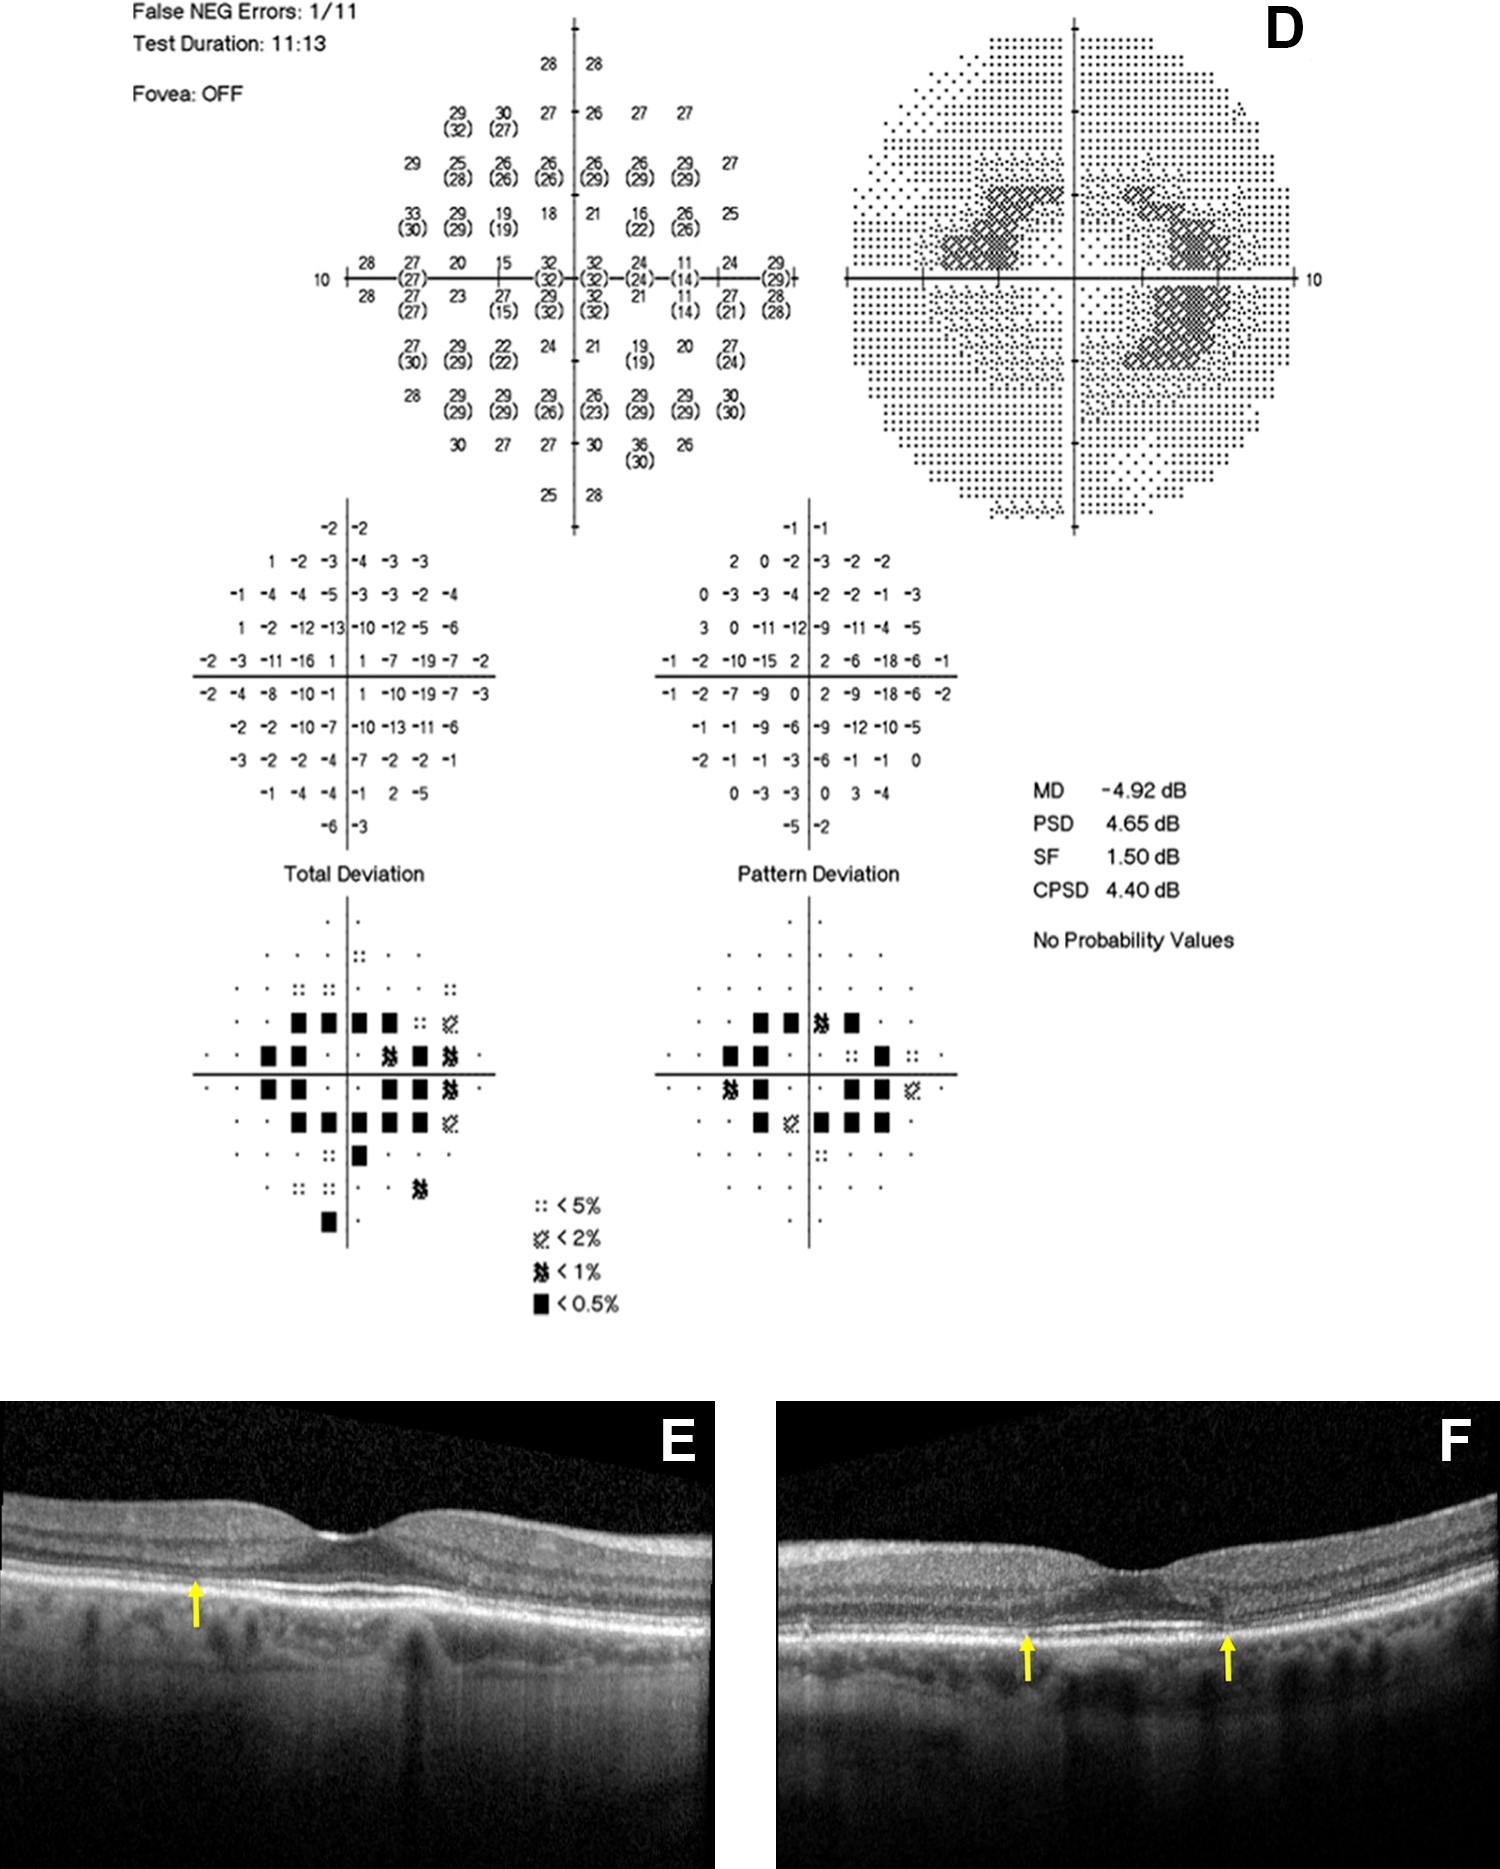
Blue-light autofluorescence image of (A) right, and (B) left eye, displays a ring of hyperautofluorescence in the parafoveal zone. Humphrey visual field 10-2 with (C) paracentral ring scotoma that correlates with retinal disease in the right eye, and (D) left eye. Spectral-domain optical coherence tomography of the (E) right and (F) left eye, whose arrow shows disruption of the ellipsoid zone in the outer retina within the parafoveal area with outer nuclear layer thinning. Findings are consistent with hydroxychloroquine toxicity.
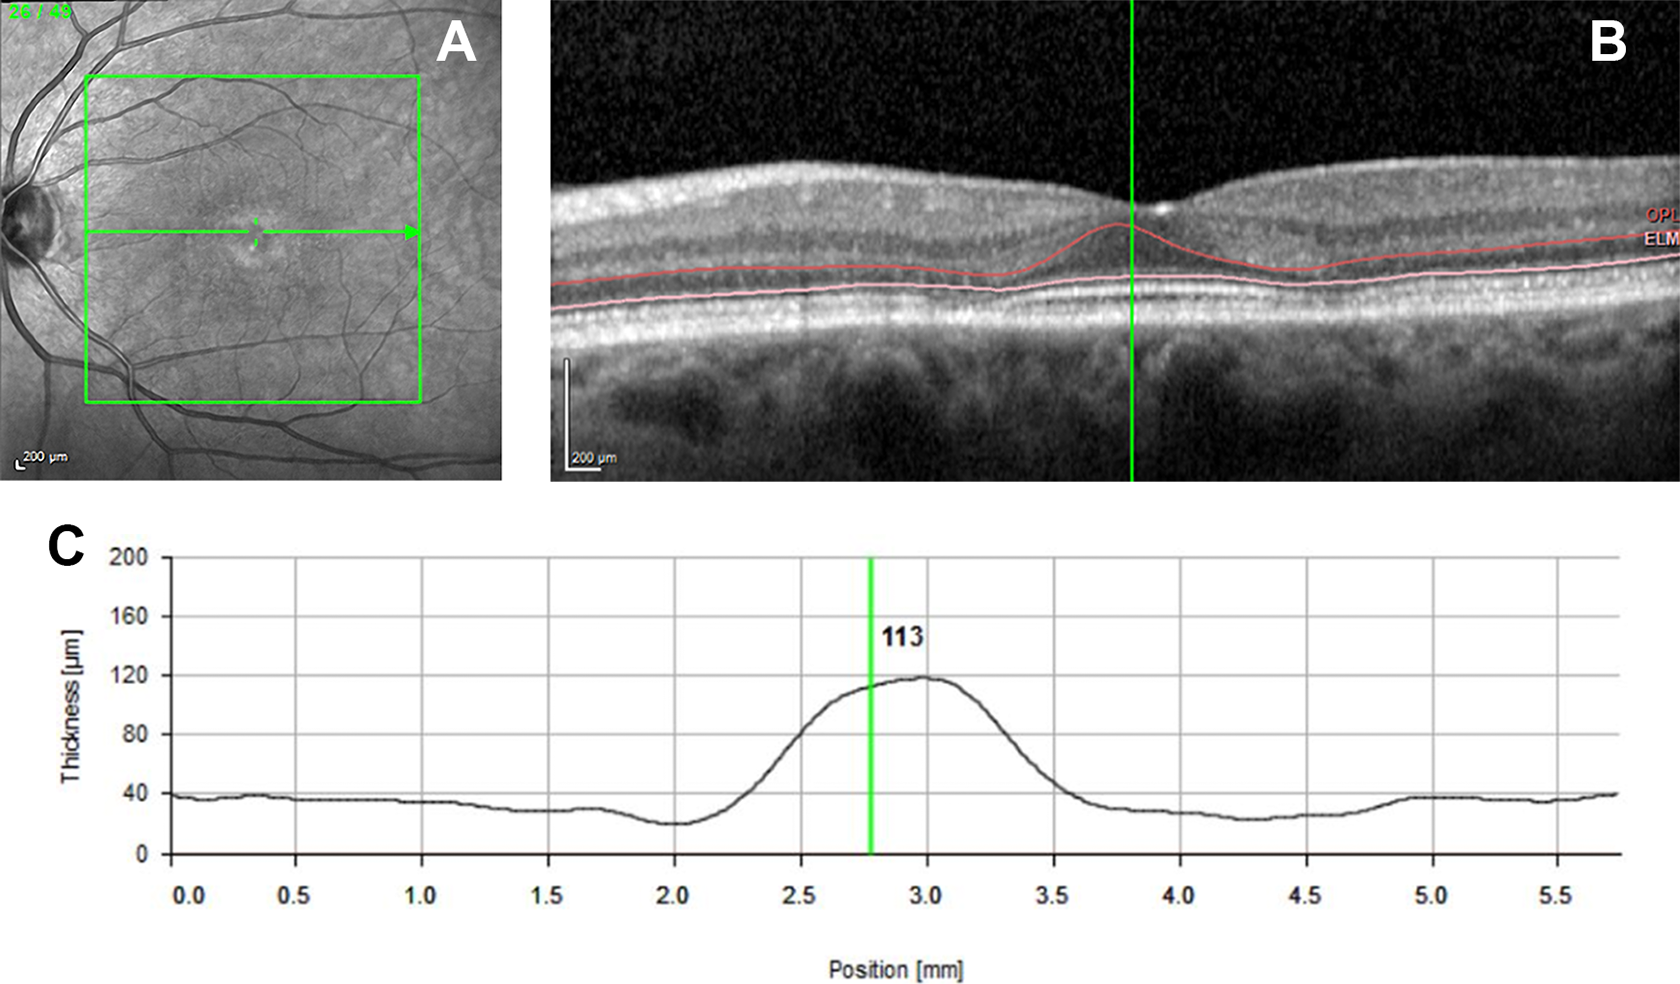
The automated segmentation with Heidelberg of toxicity subject 4. (A) The image of the en face image. (B) The B-scan taken through the fovea with boundary lines that delineate the outer nuclear layer (ONL). The red upper line shows the boundary line at the lower border of the outer plexiform membrane, and the pink lower line is located at the external limiting membrane. (C) A graphical display generated by the software that plots the thickness of the ONL.
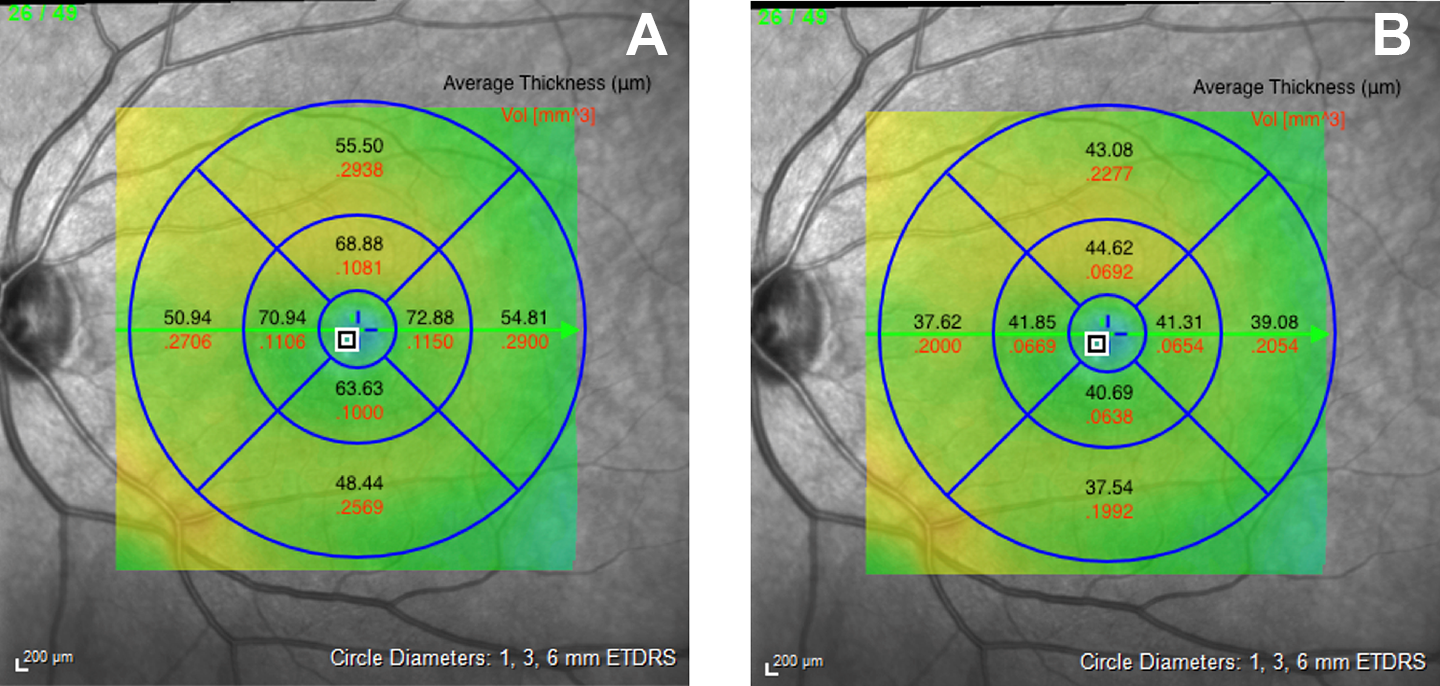
An en face image with an Early Treatment Diabetic Retinopathy Study overlay of a (A) healthy control (subject 16) and (B) toxicity patient (subject 3), dividing the foveal area into the parafoveal, perifoveal, and foveal regions. Thickness and volume measurements are recorded in each region.
Statistical Analysis
Statistical analysis was performed using JMP Pro (SAS Institute). An initial paired t-test for the toxicity group and an unpaired t-test for the control group were performed to ensure there was no statistical bias from the use of bilateral eyes for the affected individuals, and unilateral eyes for the controls. A separate unpaired t-test was performed for each region to assess whether the affected patients had thinner retinal volume and thickness than the control group in each region. The Bonferroni method was applied to correct for dependence between the variables obtained from the same eye; this resulted in an α of 0.05 for 95% CI and was divided by the number of regions (n = 9), allowing the Bonferroni correction to apply an α = 0.0056. Significant differences between the affected group and healthy controls with the values acquired by the automated segmentation were identified for every region (α = 0.0056).
Results
Participants’ Characteristics
Of the initial 36 individuals, 6 were excluded for not having SD-OCT images, 19 for not meeting a correct diagnosis of HCQ toxicity, 2 for confounding macular pathology, 1 because of poor signal quality, and 1 because of incomplete data. The final result was 7 patients confirmed in the toxicity group with 13 eyes total: 6 right (OD) and 7 left (OS). The mean treatment duration was 11.6 years (range, 9-17 years). The control group consisted of 16 individuals and 16 eyes: 6 OD and 10 OS. There was no statistical difference (STD) between groups regarding age, height, or weight. The mean age of the confirmed toxicity patients was 67 years (range, 57-79 years; STD: 7.69) while the mean age of the control group was 64.5 (range, 54-79 years; STD: 6.98). For the toxicity and control groups, the average height was 163.17 cm and 170.33 cm (P = .225) and the average weight 63.61 kg and 86.03 kg (P = .073), respectively. One subject (patient 4) had chronic kidney disease stage III. Because earlier recommendations used IBW to base dosing, this measurement was included for each participant as a reference (IBW calculated with the Devine formula). All ancillary test findings are presented in Table 2. All testing supported the diagnosis of toxicity.
Overall Data Observations
Results from the data analysis of the measurements generated by segmentation demonstrate a significantly thinner ONL in HCQ toxicity patients as compared with the healthy controls in all regions, both for thickness and volume measurements. The data for thickness measurements comparing the parafoveal, perifoveal, foveal, and overall region between HCQ patients and controls were significant (P < .0001, P < .0001, P = .0029, and P < .0001, respectively) as well as for volume measurements (P < .0001, P < .0001, P < .0001, and P < .0001, respectively). Table 3 displays CIs and percent change between the groups for thickness (Table 3) and volume (Table 4) measurements of the ONL. The CI indicates there is 95% confidence that unhealthy patients have between 147 μm and 201 μm less thickness than healthy individuals (mean 174 μm thinner). As for volume, there is 95% confidence that the unhealthy participants have between 0.39 mm3 and 0.55 mm3 less volume (average 0.47 mm3 less volume).
Confidence Intervals, Significance, and Thickness Ratio as a Percentage in Controls vs Toxic Participants.
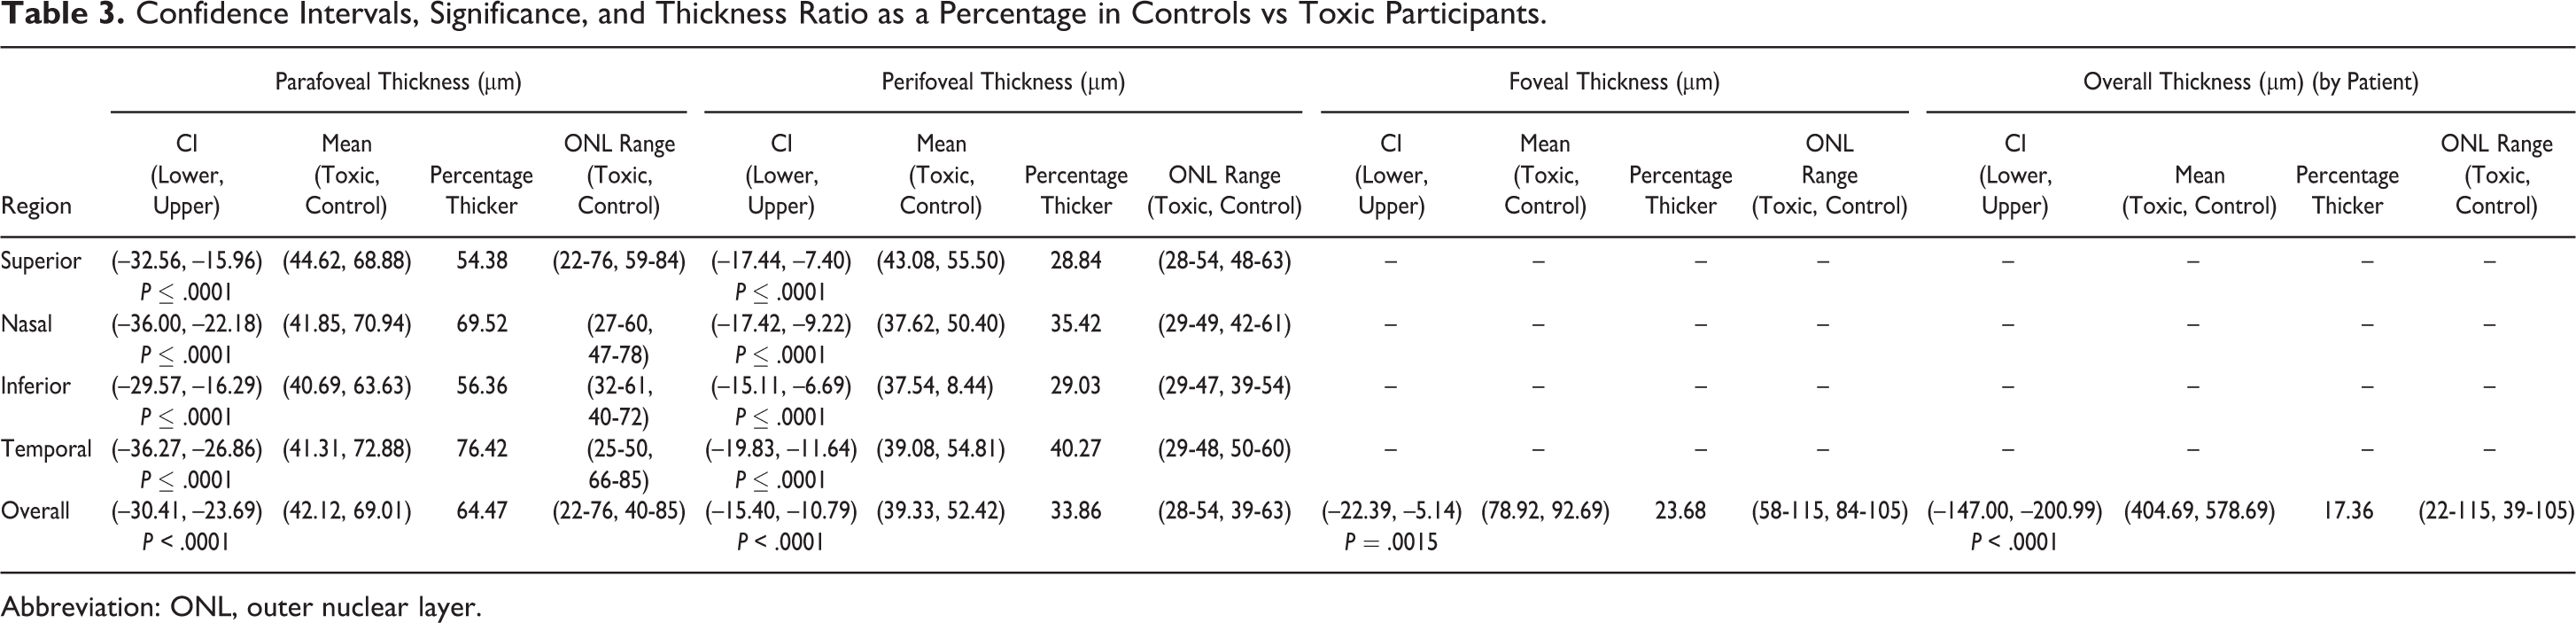
Abbreviation: ONL, outer nuclear layer.
Confidence Intervals, Significance, and Volume Ratio as a Percentage in Controls vs Toxic Participants.
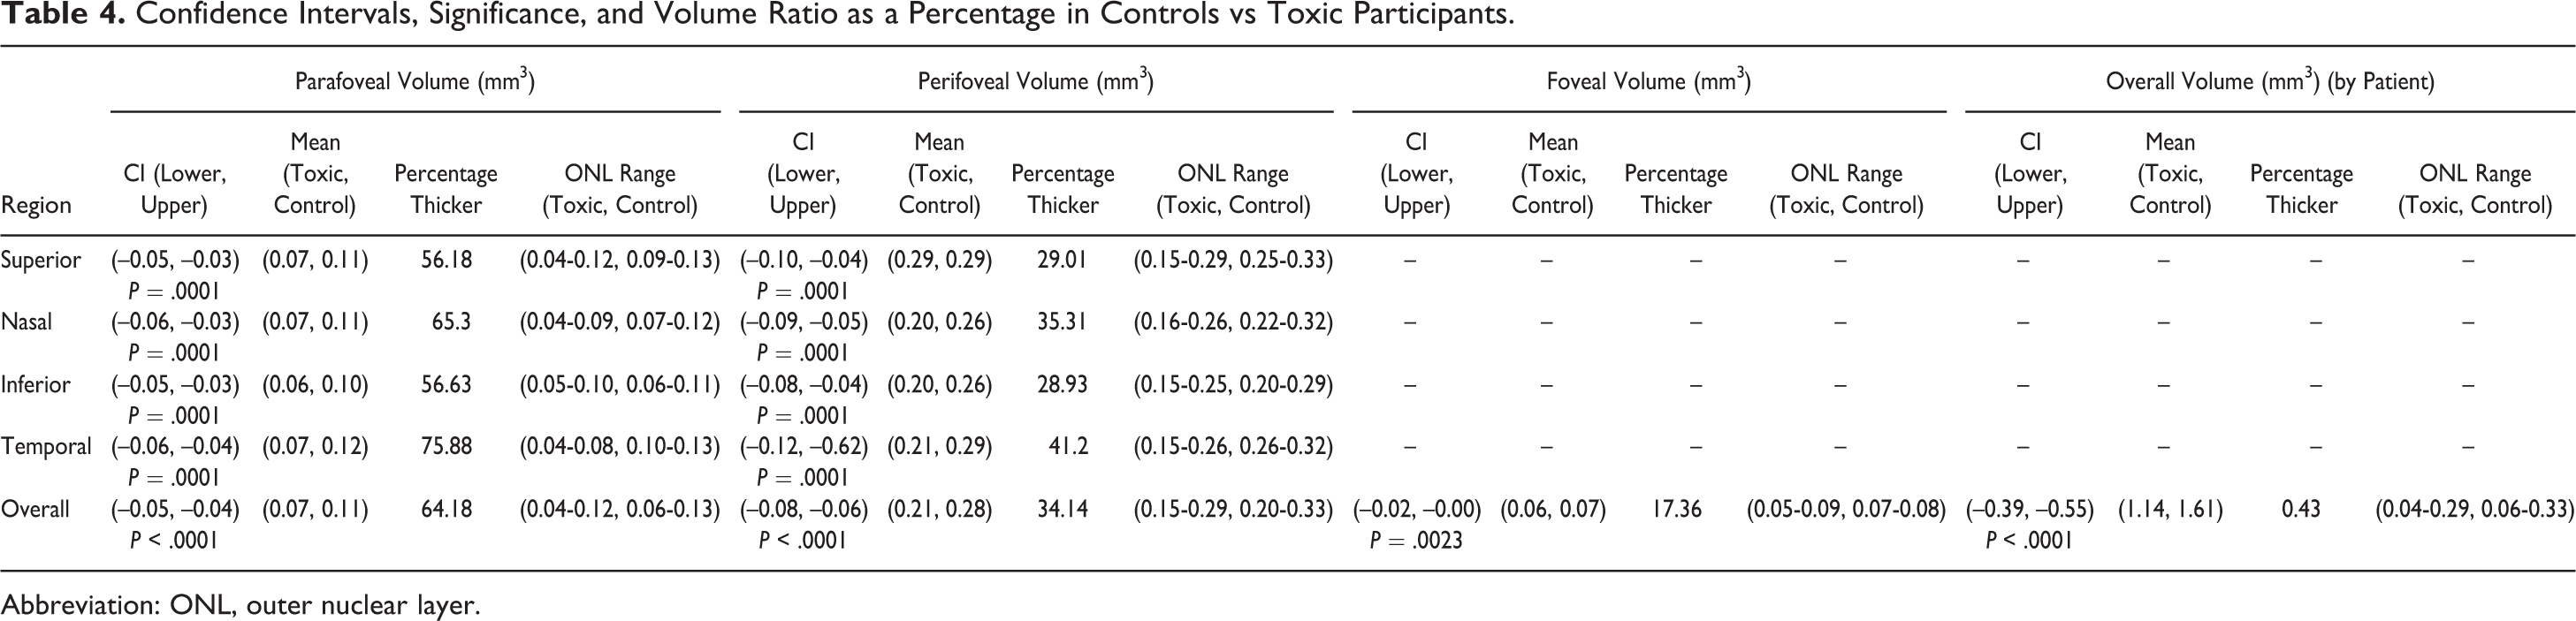
Abbreviation: ONL, outer nuclear layer.
In every region, there was significant evidence that the ONL measurements of the toxicity patients were smaller using a 1-tailed t-test beyond the Bonferroni (α = 0.0056). In addition, the results revealed that all left- and right-eye comparisons were insignificant (α = 0.0056), which ensures no bias between the right and left eye. CIs for each region produced negative results, indicating that the toxicity individuals had significantly smaller measurements as compared with controls.
For example, the parafoveal thickness of the superior region has a CI of upper –32.56 and lower –15.96, indicating that on average, a toxicity patient has a superior parafoveal thickness between 15.96 μm and 32.56 μm thinner than that of a healthy individual. In the most extreme case, the average toxicity patient has a parafoveal thickness in the temporal region between 26.86 μm and 36.27 μm thinner than a healthy counterpart. Each CI shown in Table 3 has a similar interpretation.
Next, the percentage difference was considered by using the average of the healthy sample and dividing by the average of the affected group for each region considered. This value is expressed as percentage thicker. The parafoveal region displayed the largest differences in thickness and volume between affected individuals and controls. All subsections of the parafoveal region were measured at a very high percentage difference (>40%) consistently. This identified the potential clinical reliability of this region. The perifoveal nasal and temporal zones were also found to be consistently greater (>30%) among the 4 zones in this region, while the perifoveal superior and inferior were weaker indicators (∼25%). The trends in the perifoveal nasal and temporal zones proved to be consistent within the volumetric data set.
Conclusions
Our study is the first to describe changes in the ONL using the automated segmentation software available on Heidelberg units and to evaluate the specific ETDRS regions for significance. Modi and colleagues evaluated all retina layers with automated segmentation using algorithms created for Cirrus HD-OCT (Carl Zeiss Meditec, Inc) and the Iowa Reading Center. 32 While our findings are similar in that, statistically, toxicity patients had thinner retinas compared with their age-matched healthy controls, there are differences. One is with the software algorithms. Our study used a commercially available segmentation software program currently accessible to all clinicians. This is important because the results can immediately translate to clinical use.
The ONL thickness and volume is an objective measurement that can replace the subjective analyses performed in previous studies on HCQ toxicity. To our knowledge, this is the first study to provide independent measurements of the ONL in both normal and diseased eyes with this automated segmentation function. In addition, our study evaluated the measurements within each ETDRS region to identify which is most sensitive and specific for use in comparing patient populations.
The completely negative CIs both for thickness and volume measurements in all regions demonstrate that a significant relationship can be found for each data set. These data show μ1 < μ2, which provides evidence that the thickness and volume of the toxicity group in each region are less than that of the control group. The most clinically relevant zone was found to be the parafoveal zone, for both thickness and volume measurements.
In the parafoveal zone for all thickness measurements, all the subsections measured a value greater than 54% and for volume measured greater than 56%. These data also indicate a strong similarity in the nasal and temporal subsections due to measurements in those regions always being the 2 greatest indicators in the data set. The temporal subsections displayed the narrowest range of data, indicating this could be the most specific marker for toxicity in the parafoveal zone. This is different from the findings by Lally et al, which noted parafoveal thinning as most significant in the nasal region. 23
It is important to note that our study had a limited number of patients and only 2 of Asian descent (1 in each group), which may influence this finding. Marmor et al highlighted the difference in retinal thinning among patients of Asian descent. 19 Changes in this population occur more in the outer macular region and could be missed if the parafoveal region alone were evaluated. In our study, the patient of Asian descent with toxicity had an overall ONL thickness of 423 µm, which is 175 µm smaller compared with the Asian control patient (598 µm). Similarly, the toxicity patient volume was 0.55 mm3 less than the control. Further studies are needed to delineate this difference, but future screening recommendations could be aimed at evaluating overall ONL thickness (the sum total of all ETDRS regions), instead of just an isolated zone, which may miss toxicity in some races.
Although the sample size was small, the strong CIs of the results indicate that the size was sufficient for this study. Bilateral eyes were used for affected HCQ patients and only 1 eye from each of the healthy controls. As the results indicate, there is no evidence of a relationship between the 2 eyes (left vs right) when considering the use of bilateral eyes. No other ratios were compared in the outer retina. No proven normal exists for the ONL, which could modify the interpretation of the results. Additionally, this method excluded patients with confounding anatomy on OCT images, which will need further study.
In conclusion, as use of HCQ increases the ophthalmologist will play a critical role not only in screening patients for retinal toxicity but in providing recommendations for safe use of the drug. The strong statistical results in this paper highlight the potential role of automated segmentation of the ONL as an objective screening tool. The automated segmentation function is able to differentiate patients with toxicity from healthy controls using thickness and volume measurements.
This initial study is the first to establish the ranges of thickness in the ONL in healthy individuals, as well as patients with known HCQ toxicity within each ETDRS region with the commercially available algorithm. Further research is needed to evaluate whether this technique is effective in cases with confounding retinal pathology. By identifying the magnitude of the CI between normal and toxicity patients, this paper provides the basis for further studies that can investigate whether there is a threshold level of thinning that would indicate disease.
Footnotes
Ethical Approval
The research protocol was approved by the CFH Institutional Review Board (no. 15007). The research followed procedures set forth by HIPAA and the tenets of the Declaration of Helsinki.
Statement of Informed Consent
Informed consent was not sought for the present study because it was a retrospective chart review and no patient identifying information was used.
Declaration of Conflicting Interests
The author(s) declared no potential conflicts of interest with respect to the research, authorship, and/or publication of this article.
Funding
The author(s) disclosed receipt of the following financial support for the research, authorship, and/or publication of this article: The authors would like to acknowledge the H.E. & A.S. Neal Medical Research Trust for providing funding for this study. The Neal Trust did not have any direct involvement in the collection and interpretation of data, review of findings or analysis of the results.