
Abstract
Introduction:
Life satisfaction is the cognitive evaluation of an individual’s current life situation and personal criteria influenced by their acclimatization process. Since the Satisfaction with Life Scale (SWLS) was introduced in 1985, it has been translated into 30 different languages. To date, there is limited knowledge about Filipino life satisfaction and its correlation to mental health. SWLS has not been translated, and its psychometric properties have not been established in Filipino. This study establishes the psychometric properties of the Filipino SWLS and examines the correlations between life satisfaction and mental health among Filipino Americans.
Methods:
The study design is a retrospective, non-experimental, psychometric evaluation of the Filipino SWLS. Two bilingual nurse practitioners translated the English SWLS into the Filipino version using a back-to-back translation procedure.
Results:
The Filipino SWLS demonstrated high internal consistency with a Cronbach’s alpha of 0.868. The Cronbach’s alpha was similar to other translated SWLS (German, Hebrew, Korean, Lithuanian, Malay, Spanish, Swedish, Turkish [α = 0.82–0.90] and higher than Portuguese [α = 0.74] and Spanish from México [α = 0.78]). Exploratory factor analysis supported the one-factor structure of the Filipino SWLS.
Discussion:
The study is relevant and is the first to validate the Filipino SWLS among Filipino adults. These findings can be replicated across different Filipino-speaking populations and settings, regardless of the country where the scale is applied, thereby underpinning the validity and reliability of the Filipino SWLS in other groups.
Health Equity Implications:
Mental health conditions are a stigma in Filipino communities. Due to the stigma of mental health, there is a lack of awareness about the significance of mental health in overall health. Thus, there is a lack of resources in the community due to less demand for mental health services from the Filipino communities, which underscores the need for translated mental health instruments.
Keywords
Introduction
Mental health (MH) conditions are one of the most common chronic debilities in the United States; notably, approximately 59.3 million (20%) of adults live with MH conditions.1,2 Globally, over 970 million people were living with MH debilities in 2019. 3 MH is essential to a healthy life, yet many don’t receive treatment due to a lack of diagnosis, resources, access to care, and, in many cases, the social stigma around MH, which is the greatest barrier to care. 4
The stigma surrounding MH conditions is particularly evident among Asian Americans. Among this group, Filipinos are the second-largest Asian immigrant group born in the United States, with approximately 4.1 million Filipino Americans living in the country. 5 Tuazon et al. 6 note within Filipino culture, stigma often fosters discomfort when discussing these topics. To understand this dynamic, it is important to consider the Philippines' cultural and linguistic diversity. The Philippines is an island in the South Pacific with diverse populations (Filipinos, Chinese, Indians, Black, White, Hispanics, and Spanish) and over 120 dialects (Ilocano, Tagalog, Kapampangan, Waray, Bikol, Pangasinan, Cebuano, and others).7,8 For years, Tagalog was the official language of the Philippines. However, the Philippines transitioned from Tagalog to Filipino as the official language in 1987. The Filipino language combines English and Tagalog words. 9
Several MH screenings and assessment instruments are available in English and other languages, primarily focusing on specific MH conditions and paying less attention to overall life satisfaction and patient quality of life. Life satisfaction is the individual’s perception of their current situation and personal criteria influenced by their acclimatization process. It indicates how well respondents feel their desires and accomplishments are fulfilled. 10 Diener et al. 11 pioneered the Satisfaction with Life Scale (SWLS) English version to measure the component of subjective well-being. The SWLS’s robust psychometric properties made it a gold standard for measuring a person’s perception of life satisfaction.11–15 Since the SWLS was introduced in 1985, it has been translated into 30 languages (Spanish, Dutch, Vietnamese, Arabic, and others). It has been utilized in global populations, establishing worldwide significance and suitability.16,17 The SWLS English version exhibits consistent convergence validity, high internal consistency, and high reliability in test–retest studies.11,18 To date, there is limited knowledge about Filipino life satisfaction and its correlation to MH. The SWLS has not been translated, and its psychometric properties have not been established in Filipino. This study aimed to establish the psychometric properties of the SWLS Filipino version and examine the correlations between life satisfaction and MH among Filipino Americans.
Material and Methods
Study design and procedures
The study design is a retrospective, non-experimental, psychometric evaluation of the Filipino SWLS, utilizing secondary analysis. A professional nursing organization collected the data in 2023 as part of their outreach community events in Southern California, where many Filipino Americans reside. 19 Eligible attendees (≥18 years old) were asked if they would complete surveys. The nursing organization members explained the purpose and how to complete the self-administered Filipino-language sociodemographic survey and SWLS. Attendees provided verbal consent and were given one copy of the paper-based survey. They returned the completed survey to the same nurse data collectors, who were at the table to ensure respondents completed the survey only once to avoid duplication. The respondents were not compensated for completing the surveys. A dedicated member performed the data entry for the organization’s record and assigned the attendee identification number. The investigators sought approval from the nursing organization to access the collected data for analysis. After receiving approval from the nursing organization, we sought approval from the university's Institutional Review Board (IRB) for a retrospective study.
Instruments
Sociodemographic survey
The sociodemographic survey included questions about age, gender, ethnicity, history of MH, and family history of MH. For instance, a MH question was: “Do you have any history of the following MH conditions?” Responses included depression, anxiety, obsessive compulsive disorder, bipolar disorder, attention deficit disorder, post-traumatic stress disorder, and none.
Satisfaction with Life Scale
The English SWLS has an internal consistency of 0.8711 and excellent test–retest reliability, with a correlation of 0.82. 11 The response on the scale is scored on a one-to-seven-point Likert scale; the choices are Strongly Disagree to Strongly Agree (1 is Strongly Disagree, 2 is Disagree, 3 is Slightly Disagree, 4 is Neither Disagree nor Agree, 5 is Slightly Agree, 6 is Agree, and 7 is Strongly Agree). The SWLS total score ranges from 5 to 35. A lower score denotes a low life satisfaction, while a higher score denotes a high life satisfaction. 12
Translation of the SWLS
The translation, adaptation, and cross-cultural validation of an instrument are complex processes requiring a sound methodological approach. Over 40 different guidelines have been identified for the translation, adaptation, and cross-cultural validation of measurement instruments. 20 Despite common elements (e.g., multistep process, use of multiple translators, an expert committee, focus groups, and back translations), guidelines vary depending on study aims, populations, and resources. 21 For instance, guidelines regarding the expert committees and translation teams varied in terms of size, type, level of expertise, and familiarity with the instrument. Similarly, the instructions provided to translators and experts for translating and evaluating the instrument also varied. 20 To reach consensus between translation versions, a committee approach, 22 the use of focus groups, 23 or a Delphi panel is recommended, 24 with developers of the original instrument or researchers getting involved when consensus is not reached. Notably, many guidelines do not discuss psychometric validation, and those that do, vary in the statistical procedures and instruments. 20 A systematic review of the psychometric properties of the translated SWLS 25 found similar issues regarding the translation and validation methodology, which depended on the study setting, population, and country of origin. Most studies employed back-to-back translation, with some using forward-backward translation or instruments translated by other researchers without additional validation. 25 Human evaluation of the translated SWLS instruments was ubiquitous. Translators and expert teams varied in both their number and expertise. Although a committee approach was utilized to reach consensus, the lack of detail about the process made it difficult to make significant comparisons among the translated SWLS versions.
In the current exploratory study, two bilingual nurse practitioners (NPs) translated the English version of the SWLS into Filipino using a back-to-back translation procedure. The first NP translated it into Filipino, and then the second NP translated it back into English. A Department of Health employee in Southern California, specializing in the Filipino language, reviewed the final version (Supplementary Data).
Statistical analyses
Data cleaning
Data were examined for data entry errors, missing values, and outliers; assumptions of multivariate analysis were evaluated. In the sample of 190 cases, 176 (92.6%) had no missing SWLS data. As the number of cases with missing SWLS values was small (n = 14, 7.3%), the investigators removed 10 cases with all five SWLS data values missing. Values for four cases, with one missing SWLS item each, were replaced using the rounded mean of the other items for the case. Analyses were conducted using 180 cases with no SWLS missing data (94.7% of the initial sample).
Psychometric analysis
Data were analyzed using SPSS 29.0.2.0. Frequencies, percentages, and measures of dispersion for participants’ sociodemographic and clinical characteristics were evaluated. Cronbach’s alpha and inter-item correlations (Pearson’s r) were calculated to evaluate the internal consistency of the Filipino SWLS. Corrected item-total correlations were used to measure the strength of the relationship between each item and the scale’s total score. The validity of the Filipino SWLS construct was assessed using an exploratory factor analysis (EFA) and examined through known-group validity with MH wellness.
Results
Sociodemographic characteristics and life satisfaction
A total of 180 cases were included in the analysis, comprising 73% (n = 130) females and 27% (n = 48) males (Table 1). Over two-thirds lived in the North Inland (35.6%) and South (30.5%) regions of San Diego County. One hundred and sixty (89.4%) self-identified as Asian/Filipino, 13 (7.3%) as Native Hawaiian or Pacific Islander, three (1.7%) as Multiracial, two (1.1%) as Hispanic, and one (0.6%) as White, non-Hispanic. Over three quarters reported no personal (n = 142, 78.9%) or family history of MH conditions (n = 142, 79.3%). The most common MH condition for cases and their families was depression, with 8.3% (n = 15) and 5.6% (n = 10), respectively. Seventy-one (40.1%) indicated they would like more information about MH resources. The cases had a mean age of 61.11 years (standard deviation [SD] = 14.77) with a range of 19–86 years. The cases displayed a mean life satisfaction score of 29.82 (SD = 5.00) with a range of 11–35.
Sociodemographic Characteristics of the Study Population (N = 180)
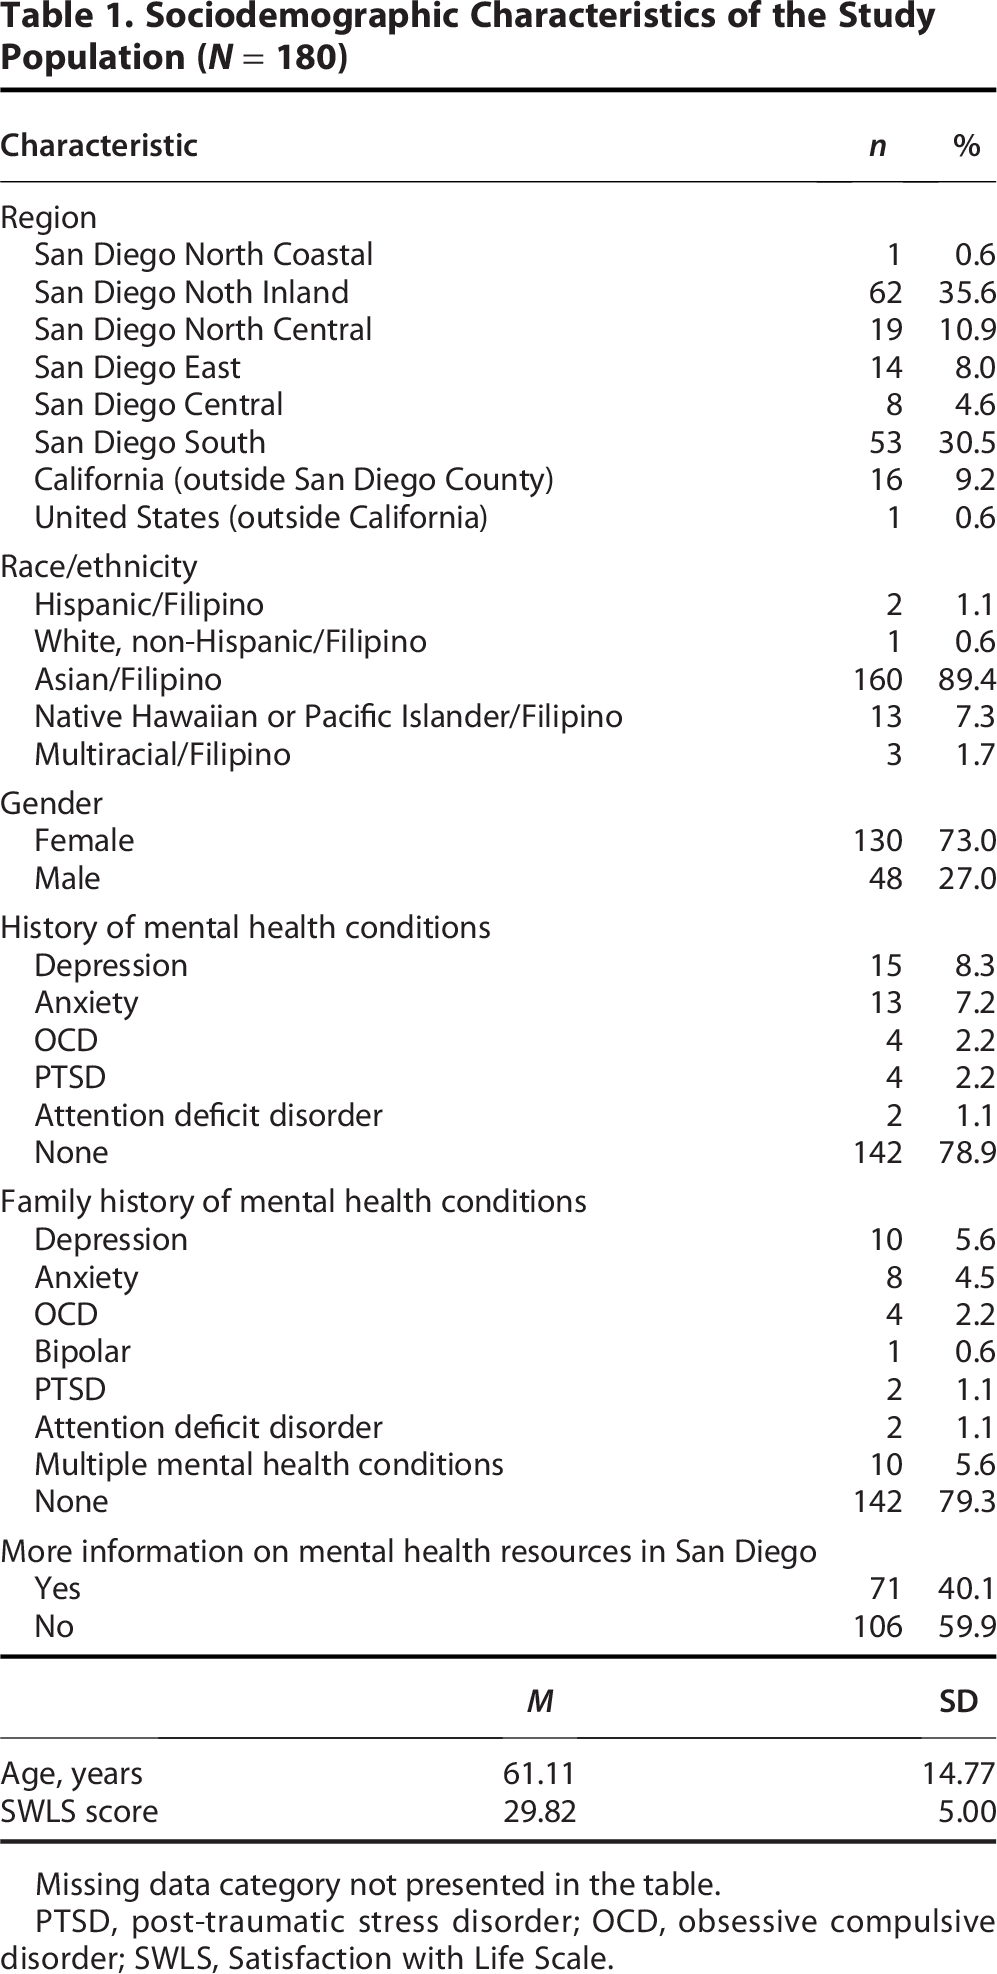
Missing data category not presented in the table.
PTSD, post-traumatic stress disorder; OCD, obsessive compulsive disorder; SWLS, Satisfaction with Life Scale.
Internal consistency of the Filipino SWLS
Characteristics (means, SDs, correlations) of the five items for the Filipino SWLS are presented in Table 2. The Filipino SWLS demonstrated a good level of internal consistency with a Cronbach’s alpha of 0.868, exceeding the 0.80 value recommended by Nunnally and Bernstein for basic research. 26 This value is similar to those found in Spanish (México, Colombia, Spain), Lithuanian, Turkish, Swedish, German, Malay, Hebrew, and Korean SWLS studies.27–36 In contrast to our results, Arabic, Portuguese (Portugal), and Spanish (México; adults ≥ 50 years) SWLS studies displayed lower Cronbach’s alpha values of 0.74 and 0.79.37–39
Correlations Matrix and Cronbach’s Alpha for the Filipino Satisfaction with Life Scale in the Studied Population

Item-total Correlation is the Pearson’s correlation between the specific item and the sum of all other items.
M, mean; SD, standard deviation.
All corrected item-total correlation coefficients (Pearson’s correlations) for the Filipino SWLS were greater than the recommended 0.3 (range = 0.56–0.77), indicating all five items measure the same construct.26,40,41 Two items (1 and 5) had relatively lower corrected item-total correlations (0.691 and 0.562, respectively); however, they are still greater than 0.3. The original English SWLS displayed item-total correlations ranging from 0.57 (item 5) to 0.75. 11
The Filipino SWLS’s inter-item correlations ranged from 0.45 to 0.72, indicating a lack of multicollinearity since all values were below 0.80. 42 A mean inter-item correlation of 0.59 alerts us to possible redundancy, as recommended values range between 0.15 and 0.50.43,44 Based on these results, the Filipino SWLS displays high internal consistency.
Construct validity of the Filipino SWLS
We conducted an EFA via principal components analysis (PCA) with varimax rotation 45 on the 5-item Filipino SWLS, which measured overall life satisfaction in 182 cases. An oblique rotation was used when factors can be assumed to be at least partially correlated. 46 We assessed the suitability of PCA before analysis. A sample of 150 cases was deemed sufficient for factor analysis if solutions have several high-loading marker variables (above 0.80).42,45 All variables on the correlation matrix demonstrated a minimum of one correlation coefficient greater than 0.3. The total Kaiser–Meyer–Olkin (KMO) measure was 0.868, with specific KMO measures greater than 0.8 categorized as meritorious. 47 The KMO index ranges from 0 to 1, with 0.6 suggested as the minimum value for a good factor analysis. 45 Bartlett’s test of sphericity was statistically significant (p < 0.05), signifying factorizable data suitable for factor analysis. 48 We found high internal consistency of the scale and a one-dimensional structure.
The EFA results are summarized in Table 3. The PCA revealed one component with an eigenvalues greater than one (3.370), explaining 67.4% of the overall variance. The scree plot (Fig. 1) revealed a clear break after the first component, supporting the retention of only one component.49,50 Rotation was not executed (only one factor was extracted), suggesting all items fit onto a single theoretical construct. The results of this analysis support the one-factor scale identified by Diener et al. 11 and are consistent with the single-factor structure found in the translated Malay, 34 Lithuanian, 30 Swedish, 32 Spanish (México), 38 Portuguese (Brazil), 51 and Korean 36 SWLS.
Eigenvalues and Percentages of Variance for Factors of the 5-Item SWLS

SWLS, Satisfaction with Life Scale.
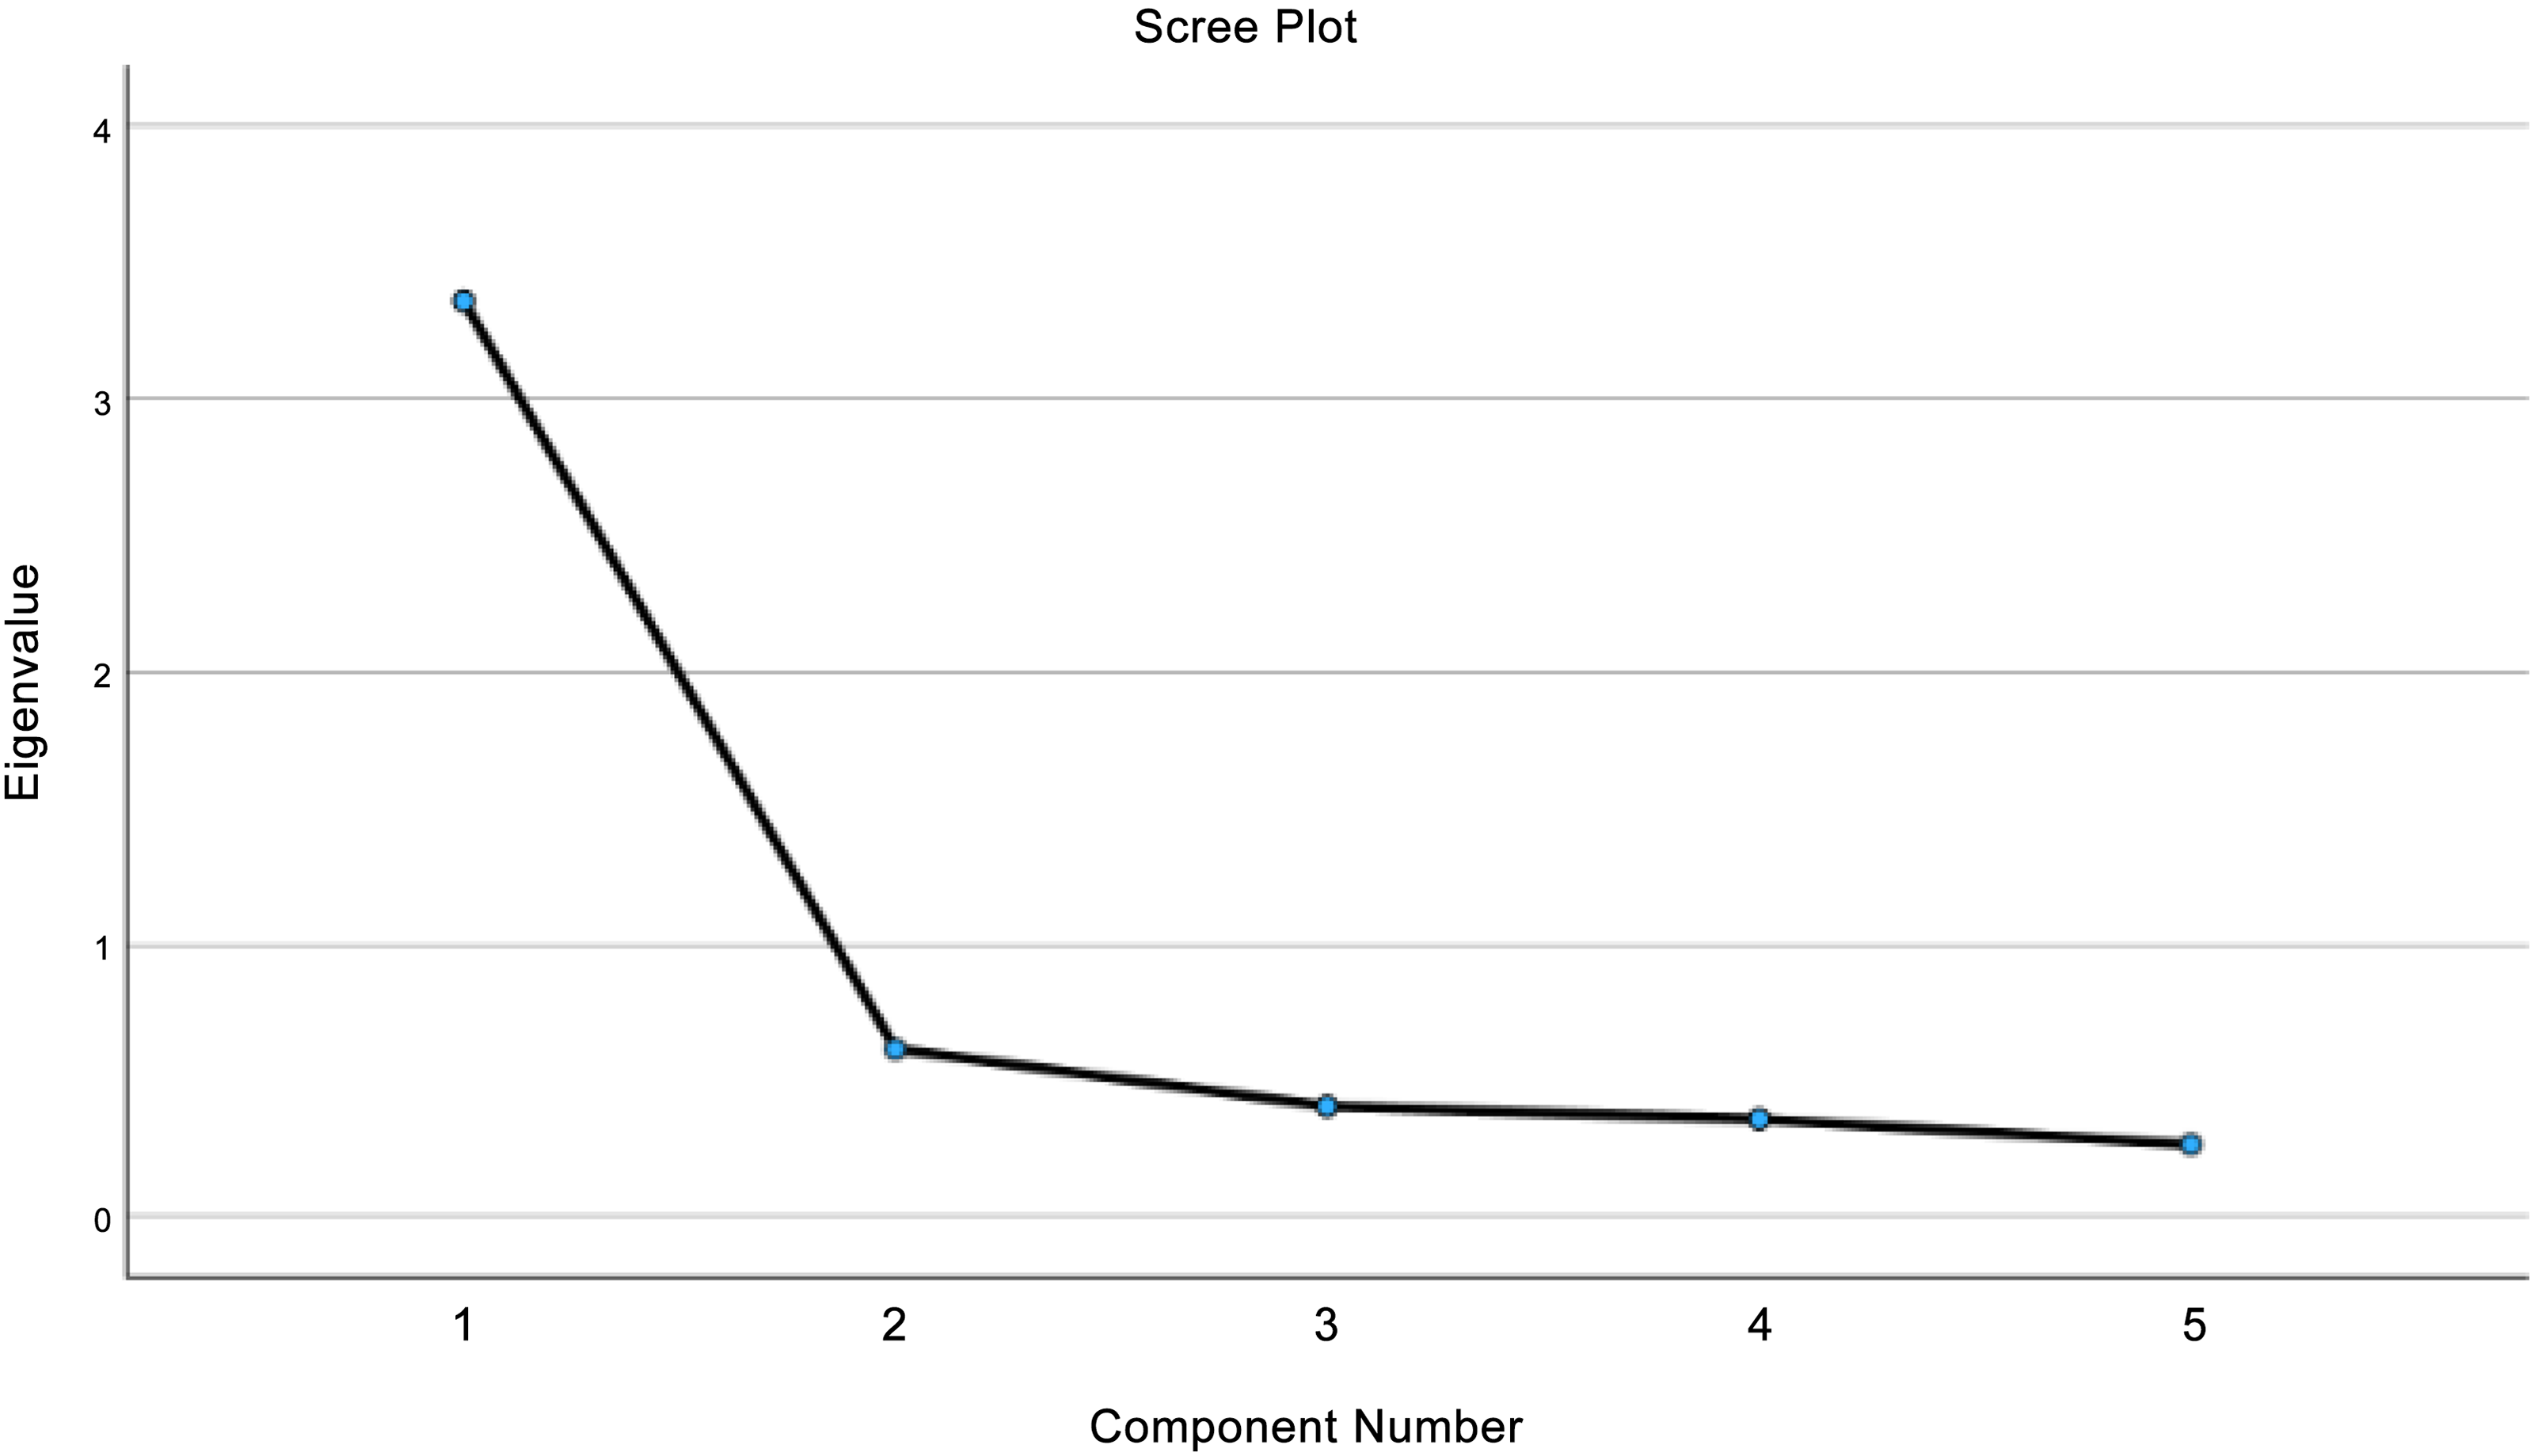
Scree Plot for Exploratory Factor Analysis of the 5-Item SWLS.
Known-group validity of the Filipino SWLS
Independent samples t-tests were conducted to examine differences in means between cases with satisfactory and unsatisfactory MH wellness, defined by a personal history of MH conditions. We proposed cases with a personal history of MH conditions (depression, anxiety, obsessive-compulsive disorder, post-traumatic stress disorder, and attention deficit hyperactivity disorder) will score lower in life satisfaction than those with no personal history of MH conditions. There were 38 cases with a personal history of MH conditions and 142 with no such history. There were several outliers in the group with no history of MH conditions, assessed by boxplot inspection. Further inspection of the mean and 5% trimmed mean indicated outliers’ impact would be negligible, and they were kept in the analysis. SWLS scores for each MH condition group were approximately normally distributed, as assessed by histograms and normal Q–Q plots. As judged by Levene’s test for equality of variances, the homogeneity of variances assumption was not met (p = 0.022); thus, Welch’s t-test value and Glasse’s delta effect size were reported. Life satisfaction was lower for those with a history of MH conditions (M = 27.26, SD = 5.88) than those with no history of MH conditions (M = 30.50, SD = 4.52), a significant mean difference of 3.24 points (95% confidence interval [CI], 1.18–5.30), Welch t(49) = 3.16, p = 0.003, Glasse’s delta = 0.551, a medium effect size (Table 4). 52
Life Satisfaction of Study Population by Mental Health Wellness

p value Sig. is asymptotic Sig. (two-sided test).
Bold value indicated p-value for the t-test is 0.003, which is significant (2-sided test) at the 0.05 level.
df, degrees of freedom; M, mean; SD, standard deviation.
Discussion
Our study aimed to examine the correlations between life satisfaction and MH among Filipino Americans and establish the psychometric properties of the Filipino SWLS. It is the first study to translate and establish its psychometric properties. Similar to previous studies, our study cases were adults from the general population.28,30,31,36,51 Most of the cases were female, which is consistent with other studies where females are more likely to participate in completing surveys than males.36,38 Thus, future research related to life satisfaction should focus on Filipino males to establish empirical evidence about their MH. Our findings suggest the cases were fluent in Filipino and from diverse racial backgrounds, consistent with the Southern California population. 19
The Philippines is the most diverse country in Asia. Some Filipinos identify as Asian, Pacific Islander, Hispanic, Biracial, White, Black, and Multiracial. This finding is consistent with our prediction and supported by other studies.53,54 Our findings suggest many of our cases did not report a history or a family history of MH conditions. It is not surprising to find out most of the cases did not request MH resources, as noted by Martínez et al. 55
We ran independent samples t-tests to examine differences in life satisfaction between cases with MH history and those without. As predicted, cases with a history of MH had lower SWLS scores than those without a history of MH conditions. These findings are similar to a study by Aishvarya et al.; 34 patients with lower SWLS scores have higher Beck Hopelessness Scale and Depression Anxiety Scale scores. The Filipino SWLS is useful for screening for MH conditions in the community setting, and the respondents with lower SWLS scores require referral for further evaluation and intervention.
Reliability of the Filipino SWLS
The item-total correlation coefficients for the Filipino SWLS ranged from 0.56 to 0.77, which is higher than the recommended value of 0.3 and indicates a high item reliability index. 40 The high-reliability index indicates all five items contribute to the overall reliability of the Filipino SWLS. Item-total correlations for all items were less than 0.80, indicating the absence of multicollinearity issues; 42 however, item-total correlations of 0.76 and 0.77 for items 2 (The conditions of my life are excellent) and 3 (I am satisfied with my life) suggest some redundancy. 26 The original English SWLS displayed similar item-total correlations ranging from 0.57 (item 5) to 0.75 (items 1 and 3). 11 Previous studies on translated SWLS psychometric studies—although inconsistent in their reporting of item-total correlations— 25 displayed ranges between 0.45 and 0.74 for the Arabic SWLS, 37 0.48 and 0.76 for the Malay SWLS, 34 0.58 and 0.76 for the Hebrew SWLS, 35 or 0.71 and 0.75 for the Korean SWLS. 36 Moreover, the results suggest the five items are consistent and stable in measuring Filipino life satisfaction. The inter-item correlation also tests the relationships among the Filipino SWLS items, revealing a moderate positive correlation among the five items, which suggests each item measures moderate precision in measuring the Filipino SWLS construct. The total high inter-item correlations of the Filipino SWLS differentiate between cases with varying abilities.56,57
The Filipino SWLS instrument exhibited high internal consistency, with a Cronbach’s alpha of 0.868, a value comparable to those of the Swedish, Malay, and Hebrew SWLS versions, all with values of 0.86.32,34,35 Its Cronbach’s alpha suggests the instrument is reliable in measuring its construct and making up the overall variance. 58 The total variance of the Filipino SWLS is 67.4%, suggesting the individual items in the scale share variance when administered to a Filipino group, which provides the basis for a substantial alpha value throughout the instrument. It indicates the differences in culture and background of the study cases did not influence the reliability and validity of the five-item SWLS. In other words, their culture and background did not impact their response to the questions. This finding is similar to the SWLS Malayan version, with participants from varying backgrounds. 34
In comparison, the Filipino SWLS Cronbach’s alpha is higher than other translated SWLS, including Arabic (α = 0.79), Portuguese (α = 0.78), and Spanish (México; α = 0.74).37–39 The lower Cronbach’s alpha and total explained variance (53.62%) in the Portuguese SWLS are due to the fact that they have homogeneous participants (older adults enrolled in an educational program at Portuguese universities). 39 Similarly, the Spanish SWLS (México) population of interest consisted of older adults, specifically those 50 years or older, as indicated by the baseline data sample from the National Employment Survey. Due to the homogeneity of the participants, the study’s Cronbach’s alpha and total variance of 54% are lower than the current study. 38 Most translated SWLS—including Malay, Hebrew, Urdu, Spanish (Mexico, Colombia, Spain), Lithuanian, Turkish, Swedish, German, Portuguese, and Korean—had Cronbach’s alpha values between 0.8 and 0.9,23,27–36,51,59,60 indicating a good internal consistency of the translated instruments. Translated SWLS consistently interpreted values ≥ 0.7 as adequate, satisfactory, or acceptable, ≥ 0.8 as good, and > 0.9 as high. 25
Validity of the Filipino SWLS
The EFA confirmed a single-factor structure of the Filipino SWLS. The overall KMO was 0.867, and Bartlett’s test of sphericity was less than 0.05, which confirmed each item had some communal variance with the other items. The EFA via PCA revealed a unique factor explained by 67.4% of the total variance and had an eigenvalue of 3.370. These findings are higher than those of previous psychometric studies of the translated SWLS in other countries and the original work by Diener et al., 11 with a single-factor structure explaining 66% of the total variance. 11 Regardless of the methodology used in the translated studies, some focused on identifying all sources of variability and maximizing explained variance with the smallest number of factors, while others focused on shared variability using Varimax, Promax, or no rotation depending on the sample characteristics—all found a single-factor structure for the translated SWLS.30,32,34,36,38,39,51 The study is relevant and is the first to validate the Filipino SWLS among Filipino adults. These findings can be replicated in different Filipino-speaking populations and settings, independent of the country where the scale is applied, underpinning the validity and reliability of the Filipino SWLS in other groups.
Compared with previous studies, the present study did not utilize other MH instruments in conjunction with the SWLS.31,34,36 Future studies should include other MH instruments to establish the Filipino SWLS’s convergent, concurrent, and discriminant validity. Although the EFA with PCA was appropriate for this study, future studies should consider confirmatory factor analysis with structural equation modeling to cross-validate the results across groups, thereby strengthening the robustness of the Filipino SWLS. Despite the study’s limitations, including its retrospective design, reliance on self-report data, limited sample representativeness, and regional differences, this study provides significant insight into the life satisfaction of Filipino Americans utilizing a validated instrument. Future research is needed with Filipino Americans living across the United States and in the Philippines. Differences associated with gender also need to be investigated. Nonetheless, these findings provide a promising path for future research on life satisfaction and offer notable support for improved MH screening, clinical diagnosis, and interventions.
Health equity implications
The Philippines is the most diverse country in Asia. Some Filipinos identify as Asian, Pacific Islander, Hispanic, Biracial, White, Black, and Multiracial. This finding is consistent with our prediction and supported by other studies.53,54 Our findings suggest many of our cases did not report a history or a family history of MH. It is not surprising to find out most of the cases did not request MH resources. MH is a stigma in many communities, including Filipino Americans. 11 Due to the stigma of MH, there is a lack of awareness about its significance in their overall health. Thus, there is a lack of resources in the community due to less demand for MH services from the Filipino communities. Like previous studies about Filipino MH, the lack of resources for this population led to MH disparity. 55 As noted by Martínez et al., 55 some of the barriers to seeking MH services among Filipinos living overseas are language difficulty, lack of health insurance, immigration status, discrimination, and lack of acculturation. Because of the limited resources, there is no translated Filipino version of the MH scale to measure life satisfaction and other MH conditions, underscoring the need for translated MH instruments.
Authors’ Contributions
R.B.M.: Conceptualization, investigation, methodology, results, discussion, writing original draft, funding acquisition, and writing and editing final article. P.C.: Formal analysis, writing original draft, and prepared final article. C.D.C.: Supervision, review, and editing the final draft.
Footnotes
Author Disclosure Statement
No competing financial interests exist.
Funding Information
The publishing fee for the first author was supported by the Prebys Foundation Research Heroes Grant [GRT_0663, 2023-2025].
Supplemental Material
Abbreviations Used
References
Supplementary Material
Please find the following supplemental material available below.
For Open Access articles published under a Creative Commons License, all supplemental material carries the same license as the article it is associated with.
For non-Open Access articles published, all supplemental material carries a non-exclusive license, and permission requests for re-use of supplemental material or any part of supplemental material shall be sent directly to the copyright owner as specified in the copyright notice associated with the article.