
Abstract
Background:
Within orthopaedic surgery, Patient-Reported Outcomes Measurement Information System (PROMIS) and legacy patient-reported outcomes (PRO) scores are both commonly reported. Although PROMIS and PROs often correlate, mathematical modeling is needed to create linkage tables that can be used for further research and possible clinical applicability. Such studies have been performed in varying orthopaedics subspecialities. However, no linkage study has been performed in foot and ankle research for any PRO metrics.
Methods:
In this study, we aimed to create linkage tables for PROMIS physical function and Foot and Ankle Ability Measure (FAAM) scores. The FAAM is a valid, legacy PRO used in foot and ankle research. We retrospectively collected FAAM and PROMIS PF scores on 745 patients undergoing surgery. Correlations were performed between FAAM and PROMIS PF scores. Statistical models were then used to link the metrics including linear regression, identity, mean, linear, circle-arc, and equipercentile techniques.
Results:
FAAM and PROMIS PF scores were correlated. All linking methods resulted in an ICC of at least 0.57 and an R2 of at least 0.49. Both the linear and equipercentile methods demonstrated an R2 value of 0.93, though the ICC for the equipercentile model was slightly higher than the linear model. The linear model resulted in a lower SE and was therefore used to evaluate population invariance.
Conclusion:
No prior studies have linked patient-reported outcomes tools in foot and ankle research. Here, we successfully linked two commonly used metrics (PROMIS PF and FAAM scores). Creating crosswalk tables, we hope, can enhance data comparison in larger-scale orthopaedic foot and ankle research.
Level of Evidence:
Level III, retrospective study.
Introduction
Outcome tools in orthopaedic surgery can measure generalized and domain-specific impairments. 1 Within each orthopaedic subspeciality, multiple patient-reported outcome (PRO) tools may be employed to study the same clinical condition. However, standardization varies in the collection of orthopaedic research data as not all research centers collect the same outcomes metrics, thereby limiting an ability to compare datasets across locations. To overcome this, crosswalk studies can link PROs, thereby generating conversion tables. 2
The Patient-Reported Outcomes Measurement Information System (PROMIS) remains widely used in most orthopaedic specialties with scores standardized to a general population sample. 3 Legacy PROs are often used alongside PROMIS scores in publications. 3 Linkage studies that connect legacy PROs and PROMIS data have been performed in multiple areas of orthopaedics including hip and knee arthroplasty,4 -13 ACL reconstruction, 14 spine, 15 shoulder and elbow, 16 and hand surgery.2,17 -19 However, linkage data have yet to be developed for foot and ankle research with any PRO.
The Foot and Ankle Ability Measure (FAAM) score remains a valid, legacy PRO for studying patient-reported function 20 in a variety of foot and ankle conditions. 21 The FAAM activities of daily living (ADL) subscale is a 21-question survey with a maximum score of 100 (greatest patient-reported functionality) and minimum score of 0 (lowest physical function). 20 Prior reports have shown that FAAM scores correlate with general measures of physical function, like PROMIS physical function (PF) scores.3,22,23 PROMIS PF uses computer-adaptive testing (CAT), with higher scores representing higher function. However, there is no linkage study comparing FAAM and PROMIS PF scores. The absence of a validated crosswalk limits the ability to combine legacy PRO data sets with modern PROMIS-based registries. In this study, we performed crosswalk analyses on patients undergoing surgery who completed both FAAM and PROMIS PF data, thereby generating linkage tables that can be used for future foot and ankle research.
Methods
This study was approved by our institutional review board. English-speaking patients who underwent foot or ankle surgery between 2014 and 2022 were identified through querying the Electronic Data Wearhouse at a single institution for all surgeries completed by 5 orthopaedic foot and ankle surgeons. Patients were given standard of care questionnaires as part of their care leading up to and following surgical treatment. Data used for FAAM and PROMIS scores were collected on day of surgery or within 6 months after surgical intervention. In surgical patients who participated and completed surveys, data were gathered either online before their appointment or in clinic with a research iPad. Chart review was also independently performed to assess for any concurrent physical function impairments as well as for patients who underwent other surgeries within 6 months before or after the date of data collection. We also classified patients as having undergone elective surgery or trauma-related surgery as well as the anatomic location of surgery for all patients.
To improve the quality of the statistical analysis, patients who reported a score of 0 on FAAM instruments were excluded from analysis as the FAAM has known floor effects.20,21 Demographic information was tabulated. Mean, SD, median, IQR, and range were calculated for both instruments. A Pearson correlation coefficient was determined to describe the relationship between the PROMIS PF and FAAM scores of patients. This correlation was then evaluated using established criteria of r = 0.70-0.89 being defined as a “strong correlation” and r = 0.4-0.69 being defined as a “moderate correlation.”24,25
The equate package 26 was used in RStudio to create and compare the effectiveness of multiple models including the different straight-linear regression models of identity, mean, and linear, as well as nonlinear models including circle-arc, and equipercentile. Prelog smoothening was used as part of the equipercentile modeling. In addition, a simple linear regression was created to include in-model comparison. Predicted scores that fell outside of the range of instrument scores were truncated. These models were compared using R2 and interclass correlation coefficients 2,1 (ICC), 27 as well as SE and root mean square error (RMSE) using bootstrapping of 1000 average replications. The best model was then determined based on the highest low point of the 95% CI for the ICC of each model.
Other covariant analysis was conducted to identify population invariance bias for variables of age, sex, and trauma status. Using the chosen model, invariance was determined using the root expected mean square difference (REMSD) with acceptable being defined as ≤0.08. 15 A 2-way crosswalk table was then created for all methods as well as for the chosen model, adjusted for variables found to have population invariance.
Results
In total, 1439 patients were reviewed to determine eligibility. Patients were then excluded if they had concurrent physical function issues listed in their chart (n = 257), underwent other lower extremity surgery (n = 138) or non–lower extremity surgery (n = 22) within 6 months before or after data collection, had concurrent injuries (n = 65), or died (n = 2) within 6 months after data collection. From the 955 eligible patients, 210 were excluded because of an FAAM score of 0. To clarify, a FAAM score of 0 indicates that all questions were answered as “unable to do.” This resulted in a study cohort of 745 patients for analysis with both usable FAAM and PROMIS PF data (Figure 1).

Flowchart detailing included and excluded subjects.
The mean age of included patients was 48.9 ± 16.6 years, and 57% (425/745) were female. The most affected regions were the ankle (43%, 321/745 patients) and the forefoot (36%, 266/745 patients). More than 70% (527/745) of the surgeries within this patient cohort were elective. Table 1 offers additional demographic information.
Full Cohort Demographics (n = 745). a

Abbreviations: ASA, American Society of Anesthesiologists physical status classification.
Missing: ASA status (n = 10), insurance status (n = 7).
The score distributions for both instruments are shown graphically in Figure 2. PROMIS PF scores (n = 745) were mean (SD): 38.7 (8.8); median (IQR): 38.9 (10.8); and range (19.1, 75.6). FAAM scores (n = 745) were mean (SD): 30.5 (23.5); median (IQR): 25 (31.3); and range (3.125, 100). These two instruments demonstrated a moderate correlation in this cohort with a Pearsons correlation of 0.661.

Graphical distribution of FAAM and PROMIS scores. FAAM, Foot and Ankle Ability Measure; PROMIS, Patient-Reported Outcomes Measurement Information System.
A full evaluation of each linking method can be found in Table 2. All linking methods resulted in an ICC of at least 0.57 and an R2 of at least 0.49 (Figure 3). Both the linear and equipercentile methods demonstrated an R2 value of 0.93, though the ICC for the equipercentile model was slightly higher than the linear model. The linear model resulted in a lower SE and was therefore used to evaluate population invariance (Table 3). A crosswalk table for all methods can be found in Table 4.
Evaluation Statistics for all Evaluated Models.

Abbreviations: ICC, intraclass correlation coefficient; RMSE, root mean square error.

Equating functions by model type vs observed mean PROMIS PF and FAAM scores. FAAM, Foot and Ankle Ability Measure; PROMIS, Patient-Reported Outcomes Measurement Information System.
Subgroup Model Evaluation Using the Linear Model.
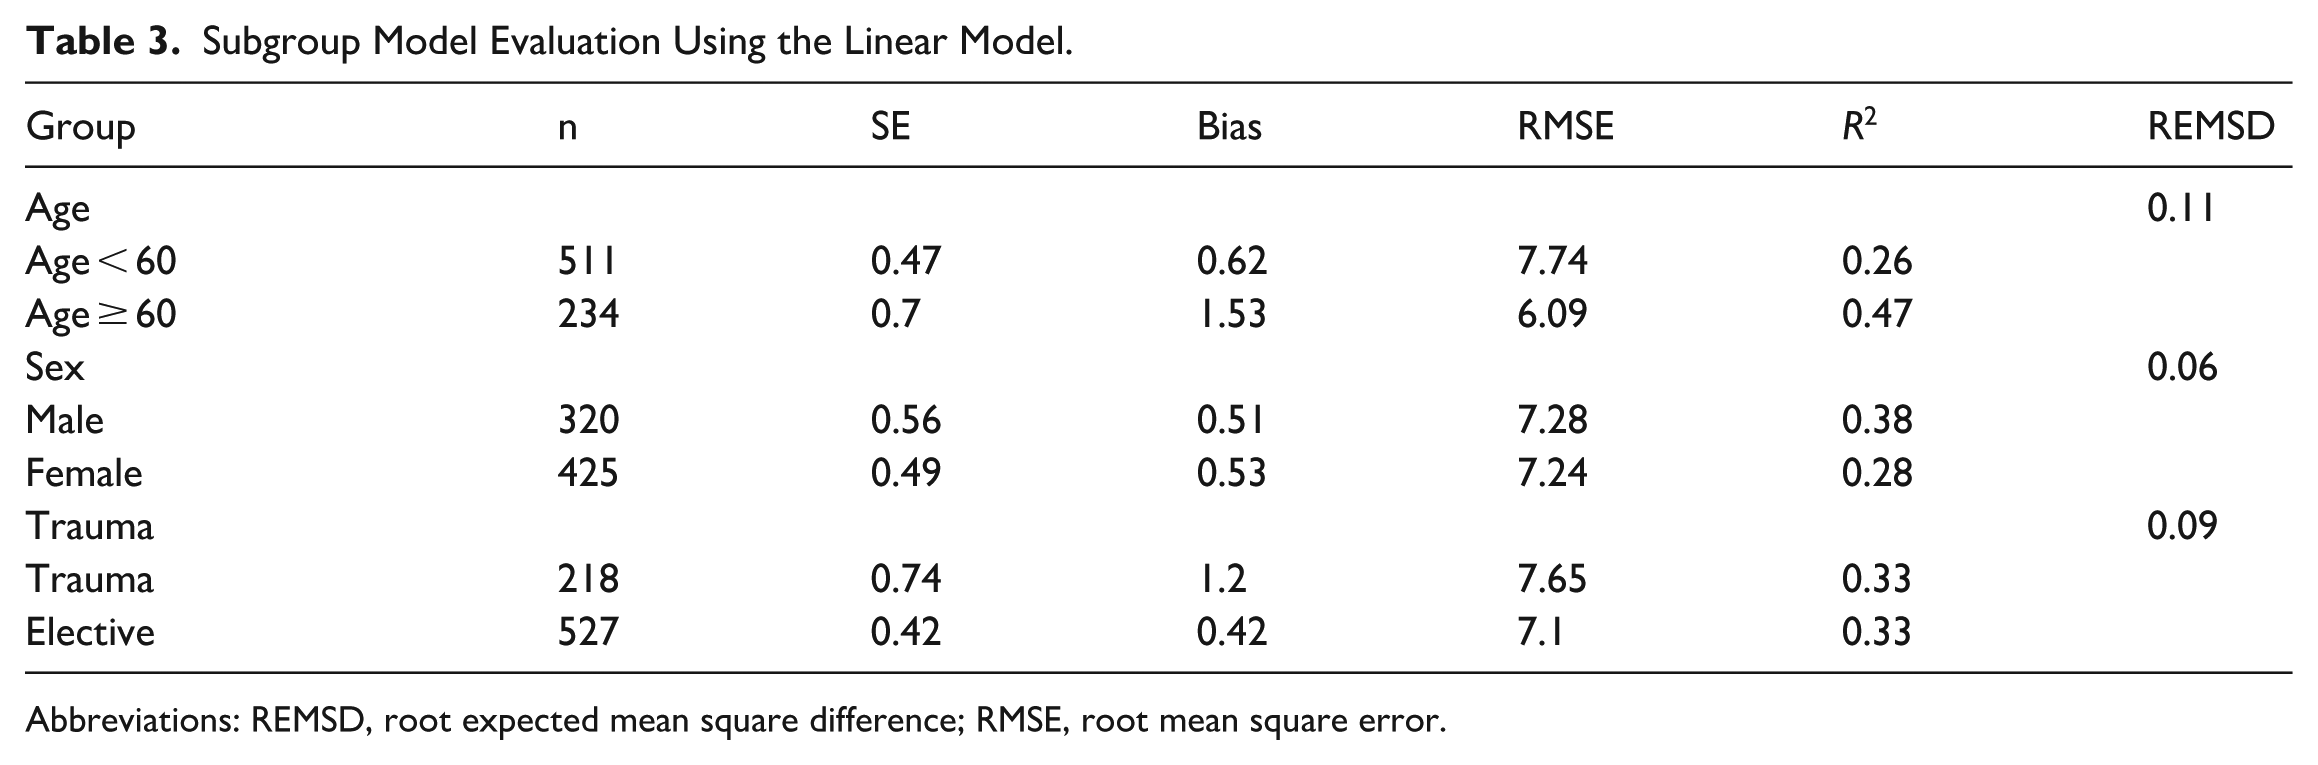
Abbreviations: REMSD, root expected mean square difference; RMSE, root mean square error.
Crosswalk Table for All Linking Methods.

Abbreviations: FAAM, Foot and Ankle Ability Measure; PF, physical function; PROMIS, Patient-Reported Outcomes Measurement Information System.
Using the linear model, evaluation of both age and trauma status were found to have significant population invariance with REMSD values of 0.11 and 0.09, respectively. These 2 variables were then compared using a χ2 test to determine correlation and were found to be significantly correlated (P < .001), with patients <60 years old having higher rates of trauma. Because of this correlation, we chose to create a secondary crosswalk table dichotomized by age using the linear linking model. This crosswalk table can be found in full in Appendix 1.
Discussion
The purpose of this study was to perform crosswalk analyses between FAAM and PROMIS PF scores in a surgical cohort. Here, we successfully linked these separate PRO measures and can offer conversion tables that can aid with future comparative research in foot and ankle patients.
In our data set, there was a significant correlation between FAAM and PROMIS PF scores. Prior work has similarly showed similar correlations between FAAM and PROMIS PF scores.3,21 With varying statistical methods, we were able to generate conversion tables (Table 4) that can help researchers compare and combine data from prior work as well as for future study. Previous studies have suggested that the circle-arc method 28 may be best suited in research practice, but we found that the linear and equipercentile methods had the largest R2 in our data set. However, we caution against broad interpretation of the R2 values from Table 2 as the underlying correlation between FAAM and PROMIS PF scores remains moderate (r = 0.66), illustrating a fair amount of underlying variability between these instruments. Each model offers differing ways of assessing the relationship between FAAM and PROMIS PF scores, and the models are independent of one another (ie, they do not build on each other).
Earlier work has indicated that age may influence linkage studies. 19 To better delineate the impact of age, we created further conversion tables (Appendix 1) that study patient age higher and lower than 60 years. Age appears to only subtly impact linkage of FAAM and PROMIS PF scores when comparing results in Table 4 and Appendix 1.
No prior report has attempted to link foot and ankle PROs. However, there have been other studies in orthopaedics that have effectively performed similar crosswalk analyses. Several reports have linked the Quick Disabilities of the Arm, Shoulder and Hand questionnaire (quickDASH) and PROMIS PF scores in upper extremity cohorts.2,17 -19 Similarly, multiple studies have linked hip and knee arthroplasty metrics. 4 There are also reports in sports medicine 14 and spine. 15 Here, we successfully linked PROMIS PF and FAAM scores for the first time. We hope our study will encourage other centers that may have access to differing foot and ankle metrics beyond the FAAM and PROMIS PF to perform similar linkage analyses. The creation of additional linkage tables may help further research collaboration across research institutions. In general, this may allow our field of orthopaedic foot and ankle surgery to move beyond nonvalid metrics, like the AOFAS score, which have known concerns regarding nonvalidity. 29
Our data from a single timepoint in a surgical cohort provide estimated—but not interchangeable—FAAM and PROMIS scores. We caution against using our findings in patient-level decision making without further study. We observed a moderate correlation (r = 0.66) between PROMIS PF and FAAM scores, which translates to roughly 56% unexplained variance between the instruments. Further study is necessary, then, to understand the variables that are not captured between these 2 instruments before any application to clinical practice is appropriate.
This study has clear limitations. We performed crosswalk analyses based on data collected at only a single time point but did exclude patients who underwent other surgeries or other functional impairments during the study time frame. It is unclear if the crosswalk data presented would change if studied over multiple time points either before surgical or at long-term surgical follow-up. The generalizability of our data is also of concern as most responders were White/Caucasian from a single institution. We cannot comment, then, if our conversion tables would change (or remain the same) in a more racially and/or ethnically diverse sample. While the FAAM is a legacy tool commonly used in foot and ankle research, it has known ceiling and floor effects. 20 In this study, we encountered notable floor effects which may impact our data validity. Excluding functionally limited patients (i.e., FAAM scores of 0) could influence the applicability of our linkage results for more physically impaired patients. Additionally, there are other metrics beyond the FAAM—like the Foot Function Index (FFI)—that have been used in foot and ankle research. 3 Lastly, there is growing concern about the applicability of PROMIS scores in orthopaedic research as they reflect generalized metrics of function not specific to an extremity or condition. 30 Some orthopaedic subspecialities appear to be moving away from PROMIS in large-scale research studies; nevertheless, in current times, it remains a commonly used metric in foot and ankle research, especially as many PROMIS PF questions pertain to weightbearing activities. 31
In summary, we developed crosswalk tables for linking PROMIS PF and FAAM instruments (Table 4). Additional models were created to understand the impact of age on linkage, with subtle differences (Appendix 1) between older and younger patients. Moving forward, we hope that the linkage data provided here can allow for further collaboration and connection between centers that collect varying outcomes data.
Supplemental Material
sj-pdf-1-fao-10.1177_24730114261451248 – Supplemental material for Linking FAAM and PROMIS Physical Function Scores: A Crosswalk Study
Supplemental material, sj-pdf-1-fao-10.1177_24730114261451248 for Linking FAAM and PROMIS Physical Function Scores: A Crosswalk Study by Devon Nixon, Taylor Mendenhall, Kade Wagers, Nikolas Kazmers and Gretchen Maughan-Egbert in Foot & Ankle Orthopaedics
Footnotes
Appendix
Crosswalk Table by Age Group Using the Linear Linking Model.

| Predicted PROMIS PF Score | ||
|---|---|---|
| FAAM Score | ≥60 y | <60 y |
| 3 | 28 | 28 |
| 4 | 29 | 28 |
| 5 | 29 | 29 |
| 6 | 29 | 29 |
| 7 | 30 | 29 |
| 8 | 30 | 30 |
| 9 | 31 | 30 |
| 10 | 31 | 31 |
| 11 | 32 | 31 |
| 12 | 32 | 31 |
| 14 | 33 | 32 |
| 15 | 33 | 33 |
| 16 | 34 | 33 |
| 17 | 34 | 33 |
| 18 | 34 | 34 |
| 19 | 35 | 34 |
| 21 | 36 | 35 |
| 22 | 36 | 35 |
| 25 | 37 | 37 |
| 28 | 38 | 38 |
| 29 | 39 | 38 |
| 30 | 39 | 39 |
| 31 | 40 | 39 |
| 32 | 40 | 39 |
| 34 | 41 | 40 |
| 36 | 42 | 41 |
| 38 | 42 | 42 |
| 39 | 43 | 42 |
| 41 | 44 | 43 |
| 44 | 45 | 44 |
| 45 | 45 | 45 |
| 46 | 46 | 45 |
| 47 | 46 | 45 |
| 50 | 47 | 47 |
| 53 | 48 | 48 |
| 54 | 49 | 48 |
| 55 | 49 | 49 |
| 56 | 50 | 49 |
| 58 | 50 | 50 |
| 59 | 51 | 50 |
| 60 | 51 | 51 |
| 61 | 52 | 51 |
| 62 | 52 | 51 |
| 64 | 53 | 52 |
| 65 | 53 | 53 |
| 66 | 54 | 53 |
| 69 | 55 | 54 |
| 71 | 56 | 55 |
| 72 | 56 | 55 |
| 75 | 57 | 57 |
| 78 | 58 | 58 |
| 81 | 60 | 59 |
| 83 | 61 | 60 |
| 84 | 61 | 60 |
| 85 | 61 | 61 |
| 88 | 63 | 62 |
| 90 | 63 | 63 |
| 91 | 64 | 63 |
| 94 | 65 | 64 |
| 95 | 65 | 65 |
| 97 | 66 | 65 |
| 100 | 67 | 67 |
Abbreviations: FAAM, Foot and Ankle Ability Measure; PF, physical function; PROMIS, Patient-Reported Outcomes Measurement Information System.
Ethical Considerations
Ethical approval for this study was obtained from the University of Utah Institutional Review Board (IRB_00071733)
Funding
The authors received no financial support for the research, authorship, and/or publication of this article.
Declaration of Conflicting Interests
The authors declared no potential conflicts of interest with respect to the research, authorship, and/or publication of this article. Disclosure forms for all authors are available online.
References
Supplementary Material
Please find the following supplemental material available below.
For Open Access articles published under a Creative Commons License, all supplemental material carries the same license as the article it is associated with.
For non-Open Access articles published, all supplemental material carries a non-exclusive license, and permission requests for re-use of supplemental material or any part of supplemental material shall be sent directly to the copyright owner as specified in the copyright notice associated with the article.