
Abstract
Background:
The rate of total ankle arthroplasty (TAA) is projected to continue increasing. Implant malalignment is a significant predictor of complications; however intraoperative evaluation of alignment can be challenging. Patient-specific instrumentation (PSI) was designed to improve implant positioning in TAA. This study compares radiographic alignment and postoperative function in patients who underwent TAA with PSI with an Infinity implant vs standard instrumentation (SI) with a Salto Talaris implant.
Methods:
We retrospectively reviewed 114 TAA cases using PSI compared with 80 TAA surgeries using SI. Demographics, radiographic alignment, range of motion (ROM), complications, and postoperative American Orthopaedic Foot & Ankle Society (AOFAS) pain, function, and alignment scores were compared at a minimum 1-year follow-up.
Results:
The PSI cohort demonstrated significantly better radiographic alignment, particularly in tibial component positioning, and reduced frequency of lucencies compared with the SI cohort. However, operative time was significantly longer in the PSI group (mean 119.0 ± 34.5 vs 96.3 ± 26.0 minutes; P < .001). For the coronal alignment of the tibial component, PSI alignment was 1.7° (0.0°-10.2°) and 2.5° (0.0°-9.8°) for SI (P = .002). For the sagittal alignment of the tibial component, alignment was observed to be 2.9° (0.0°-9.9°) for PSI and 6.1° (1.0°-13.0°) for SI (P < .001). The PSI cohort had increased AOFAS alignment scores (mean = 9.7 vs 8.9, P = .002), but AOFAS total scores were similar (mean = 77.7 vs 79.2, P = .539) between cohorts. Similar numbers of patients required revision (1.75% for PSI, 1.25% for SI, P = 1.00) or irrigation and debridement (3.51% for PSI, 3.75% for SI, P = 1.00).
Conclusion:
In this study, PSI was associated with modest differences in tibial alignment and early radiographic lucencies compared with SI, without clear significant differences in short-term clinical outcomes. Both cohorts had similar postoperative range of motion and AOFAS scores. Given the retrospective design and short follow-up, further investigation is needed to assess long-term clinical impact and implant survivorship.
Level of Evidence:
Level III, retrospective comparative study.

Keywords
Introduction
Total ankle arthroplasty (TAA) has become increasingly popular as a surgical technique for ankle arthritis.1,2 For years, the gold standard was ankle arthrodesis. 3 However, ankle arthrodesis has been associated with sequelae such as gait abnormalities and adjacent joint arthritis.2,4 Consequently, with advancements in implant design, surgical technique, and clinical outcomes, TAA utilization has significantly increased.1,2 However, TAA is not without potential complications, including high reoperation rates.5,6 Studies have shown that accurate implant positioning and alignment are crucial for achieving excellent postoperative results following TAA, whereas malposition of an implant can lead to increases in micromotion and joint contact pressures, potentially leading to implant failure.7 -11 To prevent this, patient-specific instrumentation (PSI) in TAA was developed to improve implant positioning accuracy. PSI offers preoperative planning with respect to bone resections, implant positioning, and implant sizing. Several studies have investigated the usage and efficacy of PSI in TAA, but there remains no unanimous agreement on its utilization.12 -15
PSI in TAA enables surgeons to use cutting guides customized to each patient’s anatomy using preoperative ankle computed tomography (CT) scans. The customized guides aim to improve accuracy of bone resection and implant positioning compared with standard instrumentation (SI), which can be inadequate in addressing anatomical ankle variability, complicating the neutral positioning of the implant. Additionally, utilization of PSI may reduce overall costs of TAA by decreasing operative time and reducing the number of sterile trays needed. 16
Although prior studies have evaluated the accuracy of patient-specific instrumentation (PSI) in total ankle arthroplasty (TAA), few studies have examined whether PSI improves reproducibility of coronal and sagittal tibial alignment relative to standard instrumentation (SI) when used in routine clinical practice by experienced surgeons. Moreover, the clinical relevance of small radiographic alignment differences remains unclear, particularly when alignment in both groups falls within generally accepted thresholds. These gaps highlight the need for analyses using larger cohorts to better characterize potential alignment differences and to inform the design of adequately powered future studies.
In this study, we compared radiographic alignment, range of motion, presence of periprosthetic radiographic lucencies, prospectively collected patient-reported outcome measure (PROM) scores, operative time, and fluoroscopy time between patients who underwent TAA using PSI vs SI. We believe that PSI may lead to more accurate implant alignment, reduced radiographic lucencies, and improved PROM scores compared with SI.
Methods
Patient Selection
This study was approved by our institutional review board. PROMs were prospectively collected and retrospectively reviewed for all TAA patients. The SI cohort included 80 consecutive ankles in 77 patients who received TAA from a single surgeon between September 2007 and June 2012. The mean follow-up for the SI cohort was 16.9 months (range, 11-37 months) and the mean age was 65 years (range, 35-85 years). Using a prospectively maintained database (PatientIQ), 114 consecutive ankles in 112 patients had undergone TAA between November 2021 and October 2023 for the PSI cohort. Two fellowship-trained foot and ankle surgeons performed all PSI procedures. The surgeons initiated the use of PSI primarily due to advances in technology and manufacturing techniques that made it more accessible and practical. Of note, one of the 2 surgeons who operated on patients in the PSI cohort was the same surgeon who operated on all of the patients in the SI cohort from 2007 to 2012. The PSI cohort had a mean follow-up of 16.6 months (range, 11-30 months) and a mean age of 68 years (range, 38-87 years). All procedures were performed at the same tertiary referral center, with both surgeons having extensive TAA experience prior to data collection for either group.
Patients with severe comorbidities or high-risk musculoskeletal issues, such as active septic arthritis or osteomyelitis, uncontrolled diabetes mellitus, vascular disease, compromised soft tissue envelope, bone deficiencies, or severe malalignment, were considered unsuitable candidates for TAA. A few patients with severe planovalgus or cavovarus deformities, and clinical or radiographic evidence of ligament or tendon incompetence that would threaten implant survival, were excluded from the study (<10% in each group). No patients were excluded for inadequate follow-up. All patients presenting with end-stage ankle arthritis were informed of the risks and benefits of TAA vs ankle arthrodesis. Generally, patients >55 years old with ipsilateral hindfoot or midfoot arthritis interested in TAA were considered suitable candidates.
Surgical Technique
Surgeries followed each manufacturer’s protocols. All patients received a popliteal fossa block and general anesthesia, and the surgeons used a standard anterior ankle approach. Salto Total Ankle Arthroplasty (Tornier SA) bone cuts used extramedullary cutting blocks referenced off of the tibial tubercle. Deformity correction was assessed intraoperatively using the tibial plafond as an internal control. The Infinity Total Ankle Arthroplasty (Wright Medical Technology) used patient-specific cutting guides (PROPHECY; Wright Medical Technology) for tibial and talar cuts, based on a CT scan performed within 6 months preoperatively. Fluoroscopy was used in both groups to obtain anteroposterior (AP) and lateral images of the ankle to ensure proper placement of the cutting blocks, guides, trials, and final components. Ankle stability and range of motion were evaluated with the trial and final components, which were implanted without cement. The postoperative protocol for all patients was 3 weeks nonweightbearing in a short leg splint, followed by 3 weeks’ weightbearing as tolerated in a controlled ankle motion (CAM) walker boot.
Clinical Outcome Assessment
Demographic data including age, sex, laterality, body mass index (BMI), smoking status, and history of diabetes were gathered from electronic medical records (Table 1). Preoperative and postoperative radiographs, and clinical range of motion (dorsiflexion, plantarflexion, and total range of motion) were compared for 80 ankles in the Salto Talaris system and 114 ankles in the Infinity system (Table 2). Postoperative patient-reported outcome measures (PROMs) were compared at all time points, including the American Orthopaedic Foot & Ankle Society (AOFAS) pain, function, and alignment scores (Table 3). Operative and fluoroscopy times (Table 1), as well as complications and additional procedures (Table 2) were compared between groups.
Comparison of Cohort Demographics.

Abbreviation: BMI, body mass index; PSI, patient-specific instrumentation; SI, standard instrumentation.
Denotes statistical significance in addition to bold text.
Comparison of Radiographic Clinical Outcomes.

Abbreviations: AP, anteroposterior; PSI, patient-specific instrumentation; SI, standard instrumentation.
Denotes statistical significance in addition to bold text. Bonferroni correction was applied to account for multiple comparisons within outcome families. Statistical significance was defined as P < .006 for radiographic outcomes (includes alignment and lucencies, 9 comparisons), P < .008 for clinical range of motion outcomes (6 comparisons), and P < .025 for additional procedures (2 comparisons).
Comparison of Postoperative Patient-Reported Outcome Measures.

Abbreviations: PSI, patient-specific instrumentation; SI, standard instrumentation.
Denotes statistical significance in addition to bold text. Bonferroni correction was applied to account for multiple comparisons. Statistical significance was defined as P < .0125 (4 comparisons).
Radiographic Evaluation
Preoperative radiographs included weightbearing AP, mortise, and lateral ankle views to measure tibiotalar coronal alignment, talar tilt and sagittal translation.17 -19 Postoperative radiographs included weightbearing (AP), mortise, lateral ankle, dorsiflexion lateral, and plantarflexion lateral views. Coronal and sagittal alignment of the tibial and talar prosthesis were measured. 20 Radiographs were analyzed for signs of subsidence, aseptic loosening, or lucency, and evaluated by 2 fellowship-trained orthopaedic surgeons according to previously described zones.21 -23 Subsidence refers to longitudinal movement of an implant with respect to the bone in which it is imbedded over time. 24 It signifies a continuous migration of the implant beyond an acceptable early migration. 25 Aseptic loosening was confirmed during the revision surgery by observing implant loosening without infection. Mason et al 25 suggested that angular measurement changes of 5 degrees, talar component subsidence of 5 mm on lateral radiographs, radiolucent lines >2 mm, or a progressive increase in radiolucency may indicate loosening. Lucency was defined as any periprosthetic radiolucent area of the tibia and/or talus on postoperative radiographs, irrespective of size. Lucency zones for either implant are described in Figure 1 (Infinity) and Figure 2 (Salto Talaris) and grouped based on location (tibial or talar) and view (coronal or sagittal). High-grade complications after TAA were defined as those leading to failure greater than 50% of the time: deep infection, aseptic loosening, or implant failure. 24
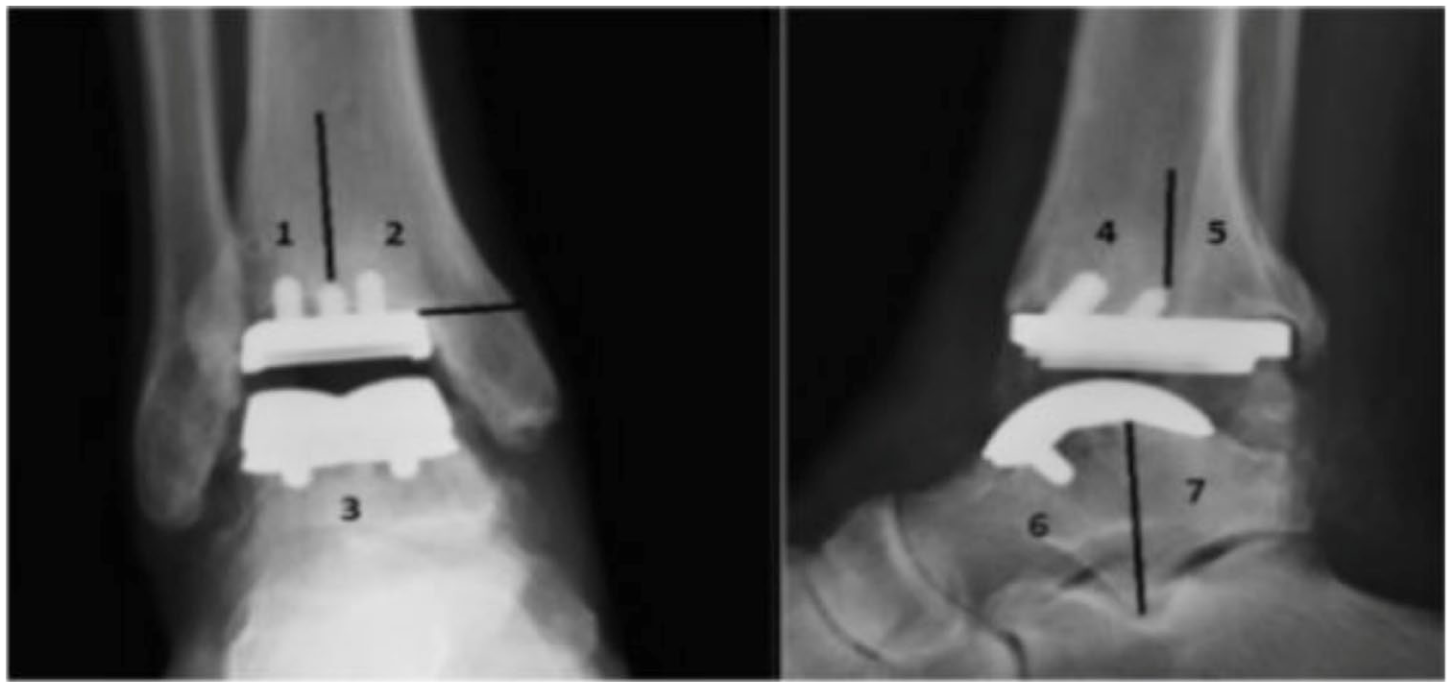
Infinity prosthesis lucency zones.

Salto talaris prosthesis lucency zones.
The intended alignment goal for both surgeons was neutral tibial component positioning relative to the mechanical tibial axis in both coronal and sagittal planes. No intentional differences in planned alignment targets existed between cohorts; however, the accuracy with which this intended alignment was achieved was the focus of the present analysis.
Statistical Analysis
Demographic statistics were reported as means and SDs for continuous variables and as frequencies and percentages for categorical variables. The primary outcome investigated, radiographic measurements, were compared between PSI and SI groups by independent sample t tests. Secondary outcome data, including continuous variables of patient-reported outcome measures, were also compared using independent sample t tests. These tests were 2-tailed and α = 0.05. Bonferroni corrections were applied within outcome families (radiographic alignment and lucencies, clinical range of motion, PROMs, and complications) to account for multiple comparisons. Significance thresholds were calculated as α divided by the number of comparisons per outcome family. We also used Cohen d to determine effect sizes, a more informative measure in the context of this underpowered analysis. Normality was assessed using the Shapiro-Wilk test. Normally distributed data were compared using paired t test or repeated measures analysis of variance to appropriately assess intrasubject changes and isolate the effect of the surgical intervention. Nonnormally distributed data were analyzed using Mann-Whitney U test or paired Wilcoxon signed rank test. Fisher exact tests were used to compare the frequency of lucencies between PSI and SI groups on AP and lateral radiographic views (Table 2) and evaluated whether the occurrence of lucencies were significantly associated with implant type. All statistical analysis was performed with R statistical software (version 4.2.2; R Foundation for Statistical Computing).
Results
Eighty ankles in 77 SI TAA patients from September 2007 to June 2012 and 114 ankles in 112 PSI TAA patients from November 2021 to October 2023 were included, with radiographic measurements and baseline demographics of each group presented in Table 1. There were no significant differences between groups in sex, laterality, BMI, or diabetes (P = .284, P = .503, P = .629, and P = .826, respectively). There was a significant difference between groups regarding age and tobacco use (P = .033 and P < .001, respectively), as the PSI cohort mean age was older (68 vs 65 years), and the SI group had more current smokers (11% vs 3%).
Operative and fluoroscopy times were found to be shorter in the SI cohort compared with the PSI cohort. The average operative time was 119.0 ± 34.5 minutes for the PSI group vs 96.3 ± 26.0 minutes for the SI group (P < .001). Similarly, average fluoroscopy time was 171.4 ± 96.2 seconds for the PSI group compared with 25.8 ± 20.0 seconds for the SI group (P < .001). Within the PSI cohort, a comparison of the first 57 cases with the last 57 cases showed a decrease in both operative and fluoroscopy times: operative time decreased from 124.1 to 113.9 minutes (P = .121), and fluoroscopy time decreased significantly from 191.6 to 150.4 seconds (P = .024).
Radiographic Analysis
Preoperative radiographs, coronal alignment (P = .011) and sagittal translation (P = .418), had no significant difference between the SI and PSI groups (Table 2). However, preoperative radiographic measurements for degree of talar tilt were significantly greater in the PSI group (7.2° for PSI vs 4.6° for SI; P = .005). Postoperative tibial component alignment had significant differences between groups. The coronal alignment was observed to be 1.7° (0.0°-10.2°) for PSI and 2.5° (0.0°-9.8°) for SI (P = .002, Cohen d = −0.458), and the sagittal alignment was observed to be 2.9° (0.0°-9.9°) for PSI and 6.1° (1.0°-13.0°) for SI (P < .001, Cohen d = −1.249). A significantly higher percentage of tibial lucencies were observed in the SI cohort on the AP view (22.3% for PSI vs 51.6% for SI, P < .001) but not the lateral view (22.3% for PSI vs 35.9% for SI, P = .055). However, no significant difference was found in the percentage of talar lucencies between cohorts for the AP view (6.3% for PSI vs 6.3% for SI, P = 1.00) or the lateral view (3.6% for PSI vs 4.7% for SI, P = .706).
Clinical Outcome
There were no significant differences between PSI and SI for preoperative dorsiflexion (9.2° and 38.3°, respectively), plantarflexion (29.2° and 26.6°, respectively), and total ROM (38.3° and 35.5°, respectively) (P = .809 for dorsiflexion, P = .035 for plantarflexion, and P = .122 for total ROM). There were also no significant differences between PSI and SI postoperative ROM measurements (dorsiflexion, plantarflexion, or total ROM). Postoperative dorsiflexion, plantarflexion, and total ROM for PSI were 10.8°, 29.5°, and 40.2° respectively, and 10.8°, 29.1°, and 39.9° respectively for SI (P = .970 for dorsiflexion, P = .690 for plantarflexion, and P = .813 for total range of motion). There were also no significant differences between PSI and SI for postoperative AOFAS total (mean = 77.7 for PSI vs 79.2 for SI, P = .539) or function scores (mean = 40.5 for PSI vs 38.8 for SI, P = .224). However, there was a significant difference between AOFAS alignment (mean = 9.7 for PSI vs 8.9 for SI, P = .002) and pain scores (mean = 27.5 for PSI vs 31.5 for SI, P = .006). Of the PSI group, 2 patients (1.75%) required revision, whereas 1 patient required revision for the SI group (1.52%, OR = 1.41, P = 1.00). Four patients required irrigation and debridement in the PSI group, whereas 3 patients required irrigation and debridement for the SI group (3.51% for PSI vs 3.75% for SI, OR = 1.41, P = 1.00) (Table 2).
Discussion
TAA has become an increasingly preferred treatment for end-stage ankle arthritis compared with ankle arthrodesis, despite higher observed reoperation rates.1,2,5,6 To improve long-term outcomes of TAA, improving alignment of the prosthesis has been suggested.8 -10 Espinosa et al 26 showed the importance of neutral component alignment, noting that malalignment of 5° or more increases contact pressures through edge-loading of the prosthesis, exceeding the threshold for polyethylene damage. This study, including a large cohort of patients both with PSI and SI, demonstrated statistically significant improvements and more neutral alignment at a minimum 1-year follow-up with PSI in TAA. Patients undergoing TAA with PSI had more accurate postoperative coronal alignment (mean = 1.7° vs 2.5°; P = .002; Cohen d = –0.458) and sagittal alignment (mean = 2.9° vs 6.1°; P < .001; Cohen d = −1.249). Improved implant alignment may have contributed to lower tibial component lucencies observed in the PSI group (22.3% for PSI vs 51.6% for SI on the AP view, P < .001). This may suggest improved implant stability and potentially reduced long-term complications such as loosening, premature wear, or implant failure. It is important to note that both cohorts demonstrated acceptable radiographic thresholds with the exception of sagittal alignment for the SI cohort (6.1°), which slightly exceeds the 5° threshold for polyethylene damage. 26 However, both groups exhibited few complications and similar postoperative dorsiflexion, plantarflexion, total range of motion, and AOFAS total scores. These findings suggest no statistically significant short-term differences in patient-oriented clinical outcomes between the 2 groups, despite the presence of small radiographic alignment differences. Ultimately, these short-term results should be viewed in light of the long-term risk assessment when deciding to use PSI or SI in TAA.
Historically, SI has been used for the treatment of end-stage arthritis with TAA which has demonstrated reliable and durable results in short and midterm studies.27,28 However, the goal of PSI in TAA is to improve the alignment of the metallic components, reducing complication and reoperation rates. The idea of PSI in TAA was originally influenced from the utilization of PSI in total knee arthroplasty (TKA) and total hip arthroplasty. Similarly, these arthroplasties aimed to improve alignment and longevity of the prosthesis. Gong et al 29 demonstrated an improved postoperative femoral axial alignment with PSI compared to SI patients. As improved alignment and reproducibility in TKA have been associated with longevity, PSI in TKA aimed to improve the long-term outcomes of TKA. 30 PSI was similarly applied to TAA, as preoperative planning and custom cutting guides might improve prosthesis alignment, particularly in patients with unique anatomy.
Similar to previous studies investigating implant accuracy of PSI in TAA, PSI allowed for accurate tibial component positioning.6,13,15,16,31,32 However, in this study, the PSI cohort showed significantly more neutral alignment than SI. Although Saito et al 15 and Escudero et al 13 reported accurate positioning of the tibial component, they did not observe statistical differences between PSI and SI for the tibial component. This may be because those studies are smaller, with Saito et al reporting 75 PSI and 24 SI patients and Escudero et al reporting 51 PSI and 16 SI patients. Future studies should include larger sample sizes and longer follow-up to further explore the statistically significant alignment differences observed in our study.
Regardless of the variation between observed statistical differences, this study reinforces the impact PSI has in providing accurate and reliable implant positioning. A systematic review found a 44.2% (1085 of 2453) complication rate during the learning curve period for primary TAA, regardless of the prosthesis system. 32 Although surgeons should understand SI and abandon PSI when needed, PSI offers a viable approach and reliable option when adjusting to the learning curve.
In our study, operative and fluoroscopy times were longer in the PSI cohort compared to the SI cohort: 119.0 ± 34.5 minutes vs 96.3 ± 26.0 minutes for operative time, and 171.4 ± 96.2 seconds vs 25.8 ± 20.0 seconds for fluoroscopy time. This contrasts with other studies, where they found that PSI utilization decreased both operative (167 vs 190 minutes; P = .040) and fluoroscopy time (85 vs 158 seconds; P < .001).15,16 Our results may reflect the senior authors’ extensive experience using SI, resulting in shorter operating and fluoroscopy times. When comparing the first and second halves of our PSI cases, fluoroscopy time was statistically significantly shorter. There is a learning curve for the proper positioning of the PSI and completion of the bone resections. Although we believe PSI is beneficial even if it increases operative and fluoroscopy time, for most surgeons with limited experience with SI, PSI might be a time saver.
Further, PSI may help reduce the overall costs of TAA. In addition to finding more accurate implant positioning with PSI, Hamid et al 16 discovered a cost-savings threshold, $863, in which PSI was less costly than SI. PSI was seen as cost-effective by reducing operative time, intraoperative complications, processing costs, and providing long-term benefits through improved alignment. Since this study reports on the short-term outcomes of implant alignment associated with PSI as compared to SI, it is important to also investigate the long-term outcomes between these 2 groups, particularly regarding postoperative complications and implant failure.
Limitations
This study has several limitations. First, this study investigates the radiographic alignment in TAA at a minimum of 1-year follow-up. Longer-term follow-up is important to fully understand long-term radiographic alignment as well as postoperative complications. A critical limitation is the confounding of implant design, as the PSI cohort used the Infinity prosthesis whereas the SI cohort used the Salto Talaris. Consequently, observed differences in lucency rates may be attributable to implant geometry rather than instrumentation method. Finally, although age was not the only factor that contributed to improvement between the PSI cohort and improved radiographic outcomes, the significant difference in age between the 2 cohorts may introduce a confounding variable, as age is believed to impact surgical outcomes.
Conclusion
In this study, patient-specific instrumentation was associated with modest differences in tibial alignment and early radiographic lucencies compared with standard instrumentation, without significant differences in short-term clinical outcomes. Both cohorts had similar postoperative range of motion and AOFAS scores. However, future studies that control for implant design are necessary to determine whether these benefits are attributable solely to the instrumentation.
Supplemental Material
sj-pdf-1-fao-10.1177_24730114261434006 – Supplemental material for A Comparison of Radiographic Alignment Using Patient-Specific and Standard Instrumentation in Total Ankle Arthroplasty
Supplemental material, sj-pdf-1-fao-10.1177_24730114261434006 for A Comparison of Radiographic Alignment Using Patient-Specific and Standard Instrumentation in Total Ankle Arthroplasty by Nicholas Veale, Kristian Efremov, Colin Wood, Matthew Beckles, Riley Smith, Gloria Coden, Mark Slovenkai and Kurt Hofmann in Foot & Ankle Orthopaedics
Footnotes
ORCID iDs
Ethical Considerations
Approved by the institutional review board of the New England Baptist Hospital (project no. 2169285).
Funding
The authors received no financial support for the research, authorship, and/or publication of this article.
Declaration of Conflicting Interests
The authors declared the following potential conflicts of interest with respect to the research, authorship, and/or publication of this article: Kurt Hofmann, MD, reports Globus Medical, Inc; Restor3d, Inc; ISTO: research support; and AOFAS, AANA, NEOS: board of directors or committee member. Disclosure forms for all authors are available online.