
Abstract
Background:
Radiographic assessment of the sagittal inclination of the first metatarsal (1M) is essential for evaluating foot disorders. However, 1M varus deviation may influence these measurements. This study aimed to determine whether hallux valgus (HV) varus deformity influences the sagittal radiographic inclination of the 1M by comparing weightbearing radiography (WBR) and weightbearing computed tomography (WBCT) images.
Methods:
Eighty-four feet were analyzed, including HV cases with intermetatarsal angle (IMA) >15° and control feet without HV. The sagittal inclination of the 1M, its base height, and ground lines form a rectangular scalene triangle, in which perspective changes can modify the lengths and angles of its sides. The first metatarsal declination angle (FMDA) and length of the first metatarsal (L1M) were used to assess the influence of 1M varus on sagittal alignment differences between WBR and WBCT.
Results:
FMDA values showed no significant differences within or between groups, with a mean difference of 0.39° (P = .98). In contrast, L1M measurements differed significantly between imaging modalities and between HV and control groups, with a mean difference of 2.48 mm (P < .05). Agreement analysis demonstrated strong concordance between WBR and WBCT measurements, indicating comparable values with minimal systematic bias.
Conclusion:
In patients with IMA >15°, forefoot geometric changes were reflected with modest L1M differences, although their clinical impact should be interpreted cautiously. Importantly, these changes did not affect FMDA, which remained stable across imaging modalities. The strong agreement between WBR and WBCT supports FMDA as a reliable parameter for assessing 1M sagittal alignment and planning realignment procedures, irrespective of HV severity.
Level of Evidence:
Level IV, cross-sectional study.

Introduction
Radiologic assessment of the sagittal inclination of the first metatarsal (1M) has a valuable role in evaluating forefoot and hindfoot disorders, including hallux valgus (HV), hallux rigidus with metatarsus primus elevatus, cavus foot, and progressive collapsing foot deformity.1 -5 The longitudinal axis of the 1M is a key reference for sagittal alignment assessment. Among the parameters based on this axis, the first metatarsal declination angle (FMDA) is commonly used to evaluate forefoot sagittal alignment, whereas Meary angle (MA) is a well-established measure of global medial column and hindfoot alignment. Because both angles share the 1M longitudinal axis as a reference, their combined assessment allows comparison between local 1M inclination and overall sagittal foot alignment, helping determine whether HV primarily affects intrinsic metatarsal orientation or global medial column alignment.6 -8 Inaccuracies in these parameters are clinically relevant, as the sagittal position of the 1M directly affects forefoot load distribution, medial column stability, and intraoperative decision making regarding sagittal plane correction. 9
Assessment of 1M sagittal inclination has traditionally relied on 2-dimensional radiographic methods.7,10,11 However, factors such as metatarsal rotation and coronal plane varus deviation may influence the radiographic projection of the 1M, potentially compromising the accuracy of sagittal inclination measurements obtained from weightbearing radiographs (WBRs). Inaccurate FMDA values may result in under- or overcorrection during 1M osteotomies.12 -16 To date, studies employing weightbearing computed tomography (WBCT) have not demonstrated a significant effect of these deformities on sagittal inclination assessment. 17
This study aimed to determine whether HV varus deformity alters the apparent sagittal inclination of the 1M on WBR. To test this, sagittal inclination measurements obtained from lateral WBR were compared with measurements derived from WBCT images aligned with the true longitudinal axis of the 1M. We hypothesized that if varus deformity introduces a relevant projection bias, sagittal inclination measurements would differ between WBR and WBCT. Demonstrating such a difference would have important implications for the planning and postoperative evaluation of procedures involving 1M realignment, both in isolated HV and in deformities associated with altered foot anatomy, such as progressive collapsing foot deformity.
Material and Methods
This was a comparative cross-sectional study that included 84 feet (60 patients), recruited between April 2023 and February 2025. Participants were divided into 2 groups: (1) a study group comprising 42 feet (38 patients) with symptomatic HV deformities and (2) a control group comprising 42 feet (22 patients) without HV. All participants underwent weightbearing dorsoplantar and lateral radiographs, as well as WBCT scan. In the HV group, 31 patients were female and 7 were male. In the control group, 18 patients were male and 4 female. Institutional review board approval was previously obtained. Inclusion criteria were patients aged >18 years with an intermetatarsal angle (IMA) greater than 15° for the HV group and lesser than 9° for the control group (Table 1). The cutoff point of 15° for the HV group was chosen as it represents the most severe cases of 1M varus deformity, in which deviations on the longitudinal axis are most likely to be observed. 18 Patients with previous surgical correction for HV or anatomical deformities of the 1M anatomy were excluded.
Comparison of FMDA and 1M Length Measurements Obtained Using WBR and the True 1M Axis on WBCT Within Each Group.

Abbreviations: 1M, first metatarsal; FMDA, first metatarsal declination angle; HV, hallux valgus; WBCT, weightbearing computed tomography; WBR, weightbearing radiography.
Student t and Wilcoxon signed-rank tests.
Significance at P < .05.
WBR and WBCT Image Measurements
The HV group presented a mean IMA value of 18.05° (range, 15°-27.1°), and the control group a mean of 8.07° (range, 5.5°-9°). To assess the sagittal inclination of the 1M, we applied a geometric triangle model, considering that the lateral view of the forefoot in WBR resembles a rectangular scalene triangle. This triangle is formed by 3 different sides and angles: the long lateral axis of the 1M, height of the 1M base, and the ground line (Figure 1). Mathematically, when viewing a rectangular scalene triangle from different perspectives, the length of its sides changes, which consequently alters the opposite angles.19,20 Therefore, it was theoretically expected that there would be a change in the angle between the 1M and the ground line due to the obliquity (varus) of the 1M in cases with HV (Figure 1). For this reason, we selected the FMDA as the reference measurement to estimate changes in 1M sagittal inclination. Among the sagittal measurements currently described for assessing first metatarsal inclination, FMDA has demonstrated the highest inter- and intraobserver reliability. 8 These changes were assessed on standard lateral WBR images and sagittal WBCT views, with the latter aligned with the true longitudinal axis of the 1M (Figures 2 and 3). The FMDA is an angle between the lateral axis of the M1 (line A) and another line parallel to the ground (line B). An increase in the FMDA indicates that the 1M has flexed downward, whereas a decrease suggests that it has elevated. The FMDA has been previously described in the radiographic and tomographic assessment of metatarsus primus elevatus, as well as in the evaluation of HV deformities.1,2,5,21,22 Furthermore, the sagittal inclination of the 1M is one of the reference lines for measuring MA. 9 Based on the geometric model of a rectangular scalene triangle, we compared the length of the 1M (L1M) measured on WBR and sagittal WBCT images, with the latter aligned with the true longitudinal axis of the 1M, to assess whether a measurable difference in L1M would be observed. L1M measurements were obtained using anatomical landmarks described by Calvo et al. 23 The 2 reference points are the midpoint of the proximal articular surface and the most distal point of the 1M head. The distance between these points represented the length of the 1M (Figures 4 and 5). All images were acquired with the patient in an upright, bipedal stance, bearing full weight evenly on both lower extremities, with the feet positioned parallel at approximately shoulder width and the knees maintained in full extension. The WBCT platform includes reference line markings that assist in consistent foot placement and alignment during image acquisition. Regarding the ground reference, the ground line was defined by the horizontal plane of the weightbearing platform, which appears as a radiopaque reference on the images and was used to establish a line parallel to the ground for FMDA measurement.
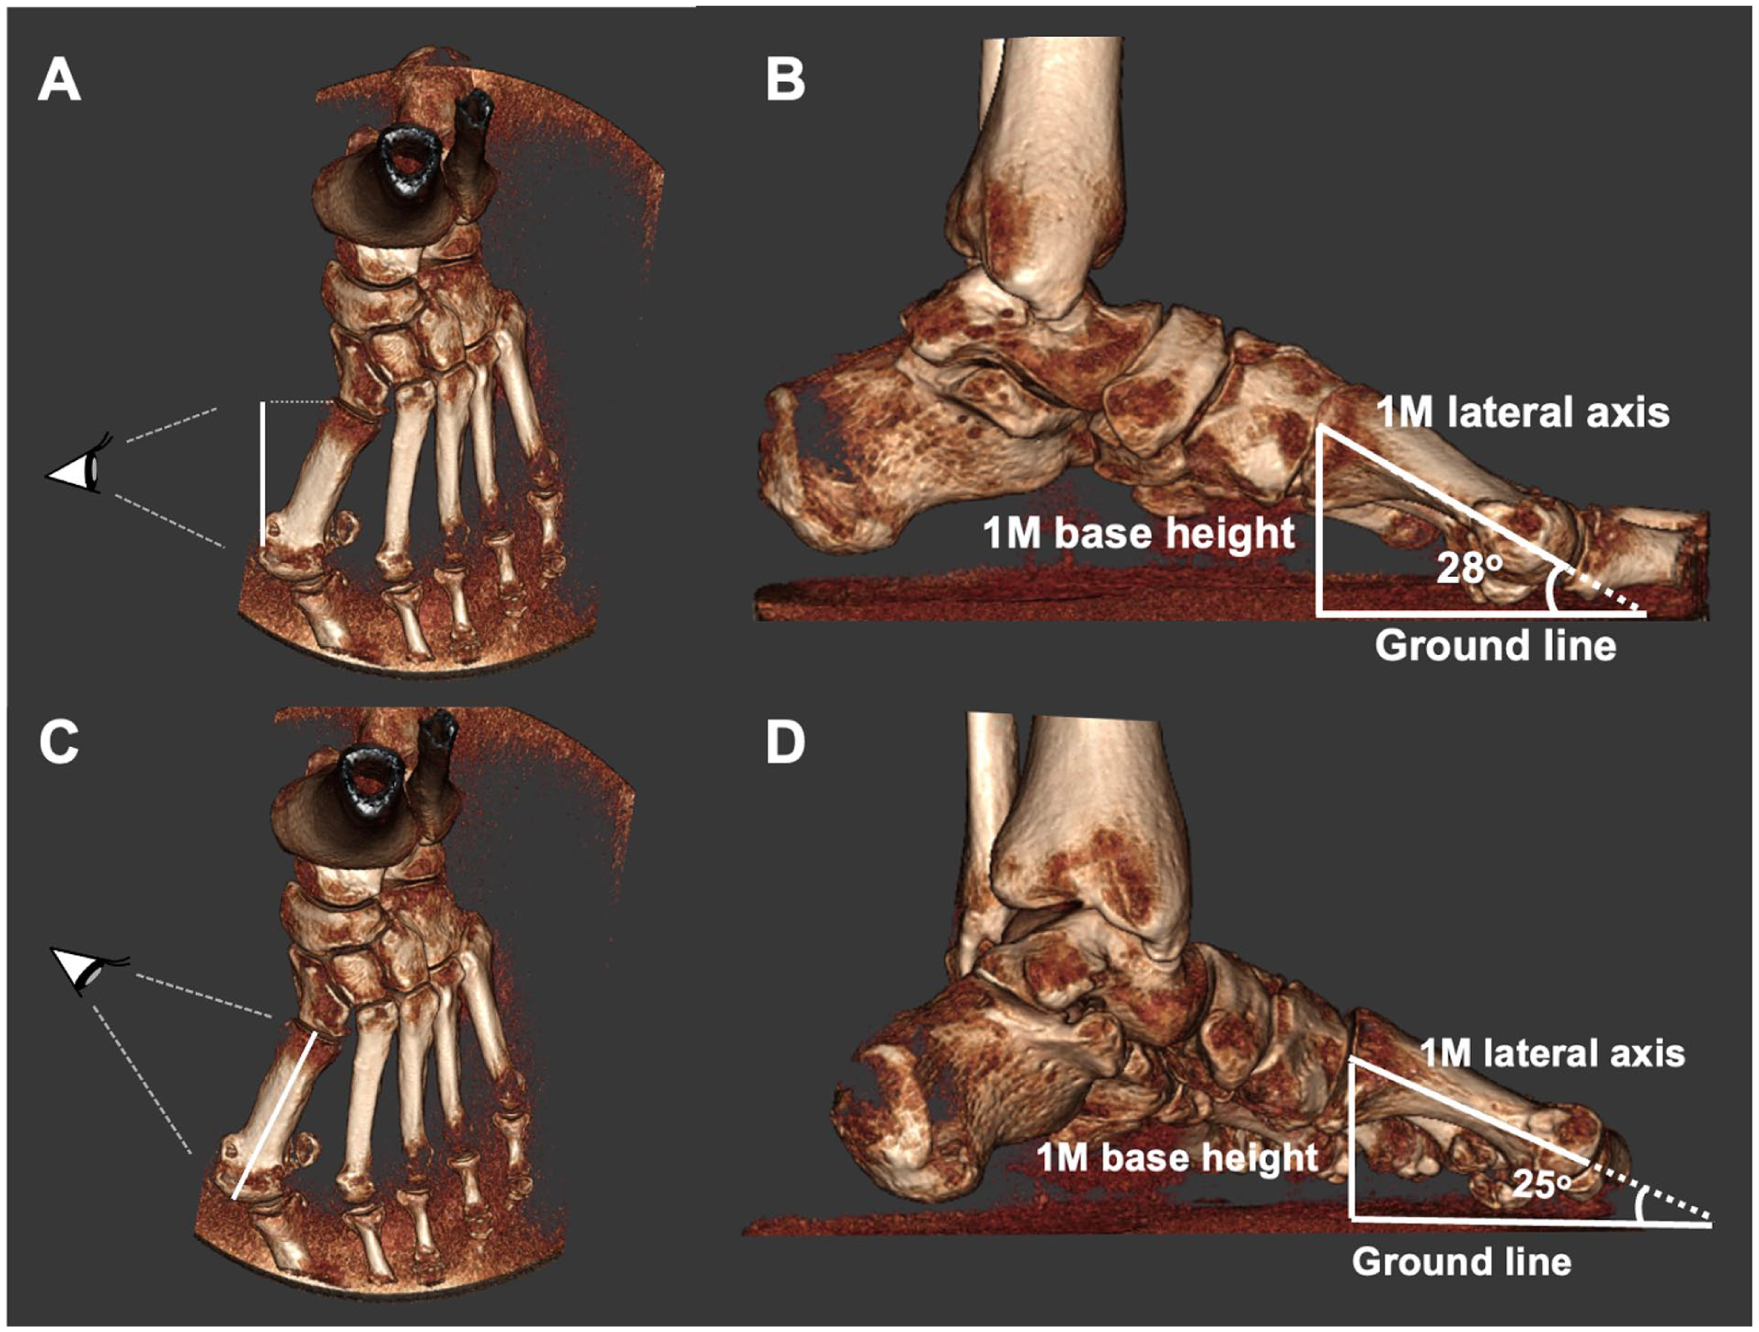
Schematic illustration of the forefoot lateral view modeled as a rectangular scalene triangle, characterized by 3 unequal sides and angles. When viewed from different perspectives, apparent changes in side lengths occurs, particularly 1M shortening, resulting in corresponding alterations in the opposite angles. Mathematically, a change in the angle between the 1M and the ground line is expected because of the obliquity (varus) of the 1M in HV. Panels (A) and (B) illustrate how the 1M appears on WBR, showing its projected image as an oblique metatarsal. Panels (C) and (D) depict the triangle as observed in WBCT, aligned with the true lateral longitudinal axis of the 1M. 1M, first metatarsal; HV, hallux valgus; WBR, weightbearing radiography; WBCT, weightbearing computed tomography.

Measurement of the FMDA using WBR and WBCT. On WBR images, the FMDA was obtained by drawing a line along the longitudinal axis of the 1M (line A) and a second line parallel to the ground (line B); the angle formed between these lines represents the FMDA. An increase in FMDA indicates plantarflexion of the 1M, whereas a decrease indicates elevation. On WBCT images, FMDA was measured using the true longitudinal axis of the 1M, which involved (A) identification of the center of the 1M base in the axial plane, (B) scrolling to identify the center of the 1M head, and (C) measurement of the FMDA in the corresponding sagittal plane. FMDA, first metatarsal declination angle; 1M, first metatarsal; WBR, weightbearing radiography; WBCT, weightbearing computed tomography.
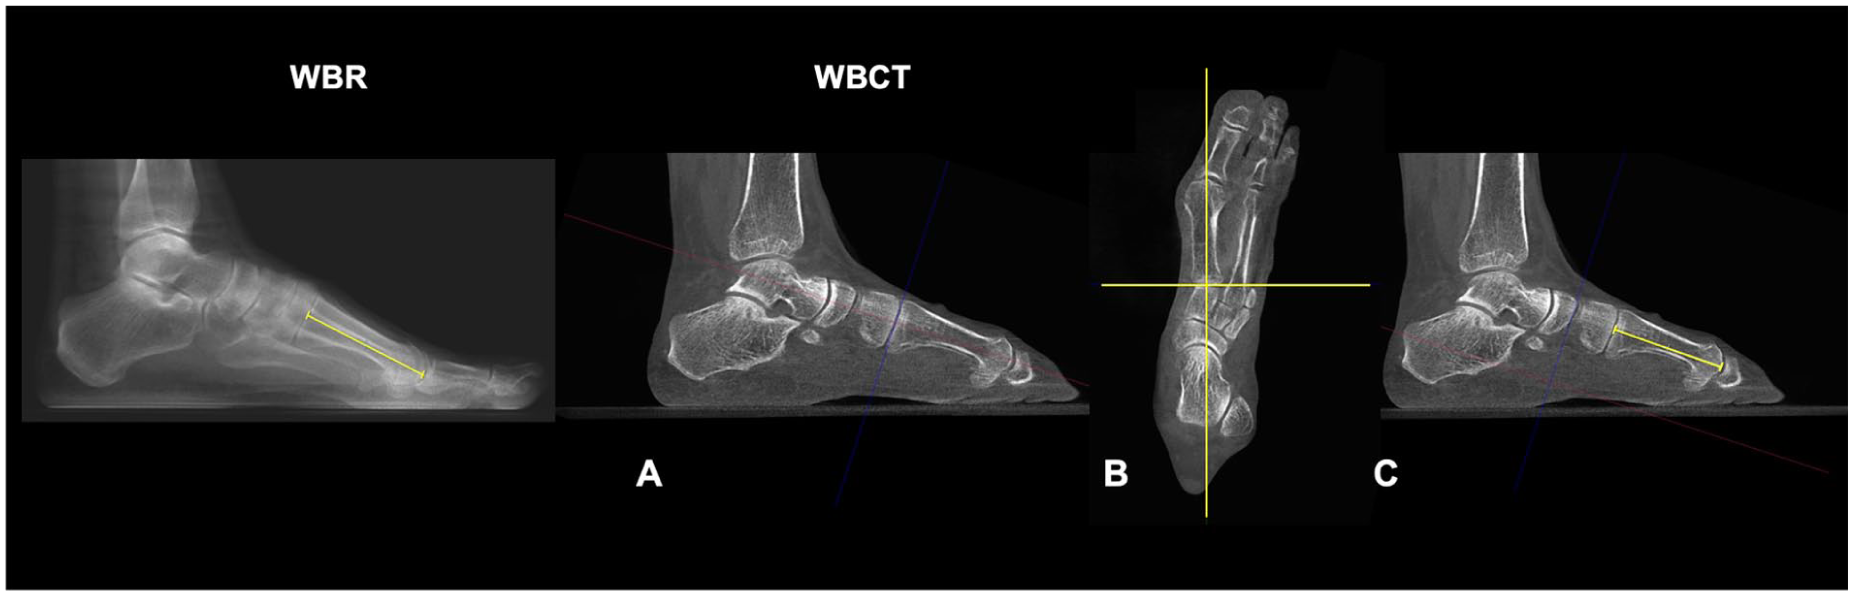
Measurement of L1M using WBR and WBCT. On WBR images, the proximal articular surface of the 1M and the most distal point of the metatarsal head were identified, and the linear distance between these landmarks was measured to obtain the L1M. On WBCT images, L1M was measured along the true longitudinal axis of the first metatarsal: (A, B) identification of the longitudinal axis in the sagittal and axial planes, followed by (C) marking of the proximal articular surface and the most distal point of the metatarsal head, with subsequent measurement of the distance between these points. Abbreviations: L1M, length of the first metatarsal; WBR, weightbearing radiography; WBCT, weightbearing computed tomography; 1M, first metatarsal.

Scatter plot demonstrating the relationship between FMDA measured on WBR and WBCT in the HV and control groups. Each point represents an individual measurement. The fitted regression lines demonstrate a strong linear correlation and close agreement between modalities in both groups, supporting the consistency of FMDA measurements across imaging techniques. Abbreviations: FMDA, first metatarsal declination angle; HV, hallux valgus; WBR, weightbearing radiography; WBCT, weightbearing computed tomography.
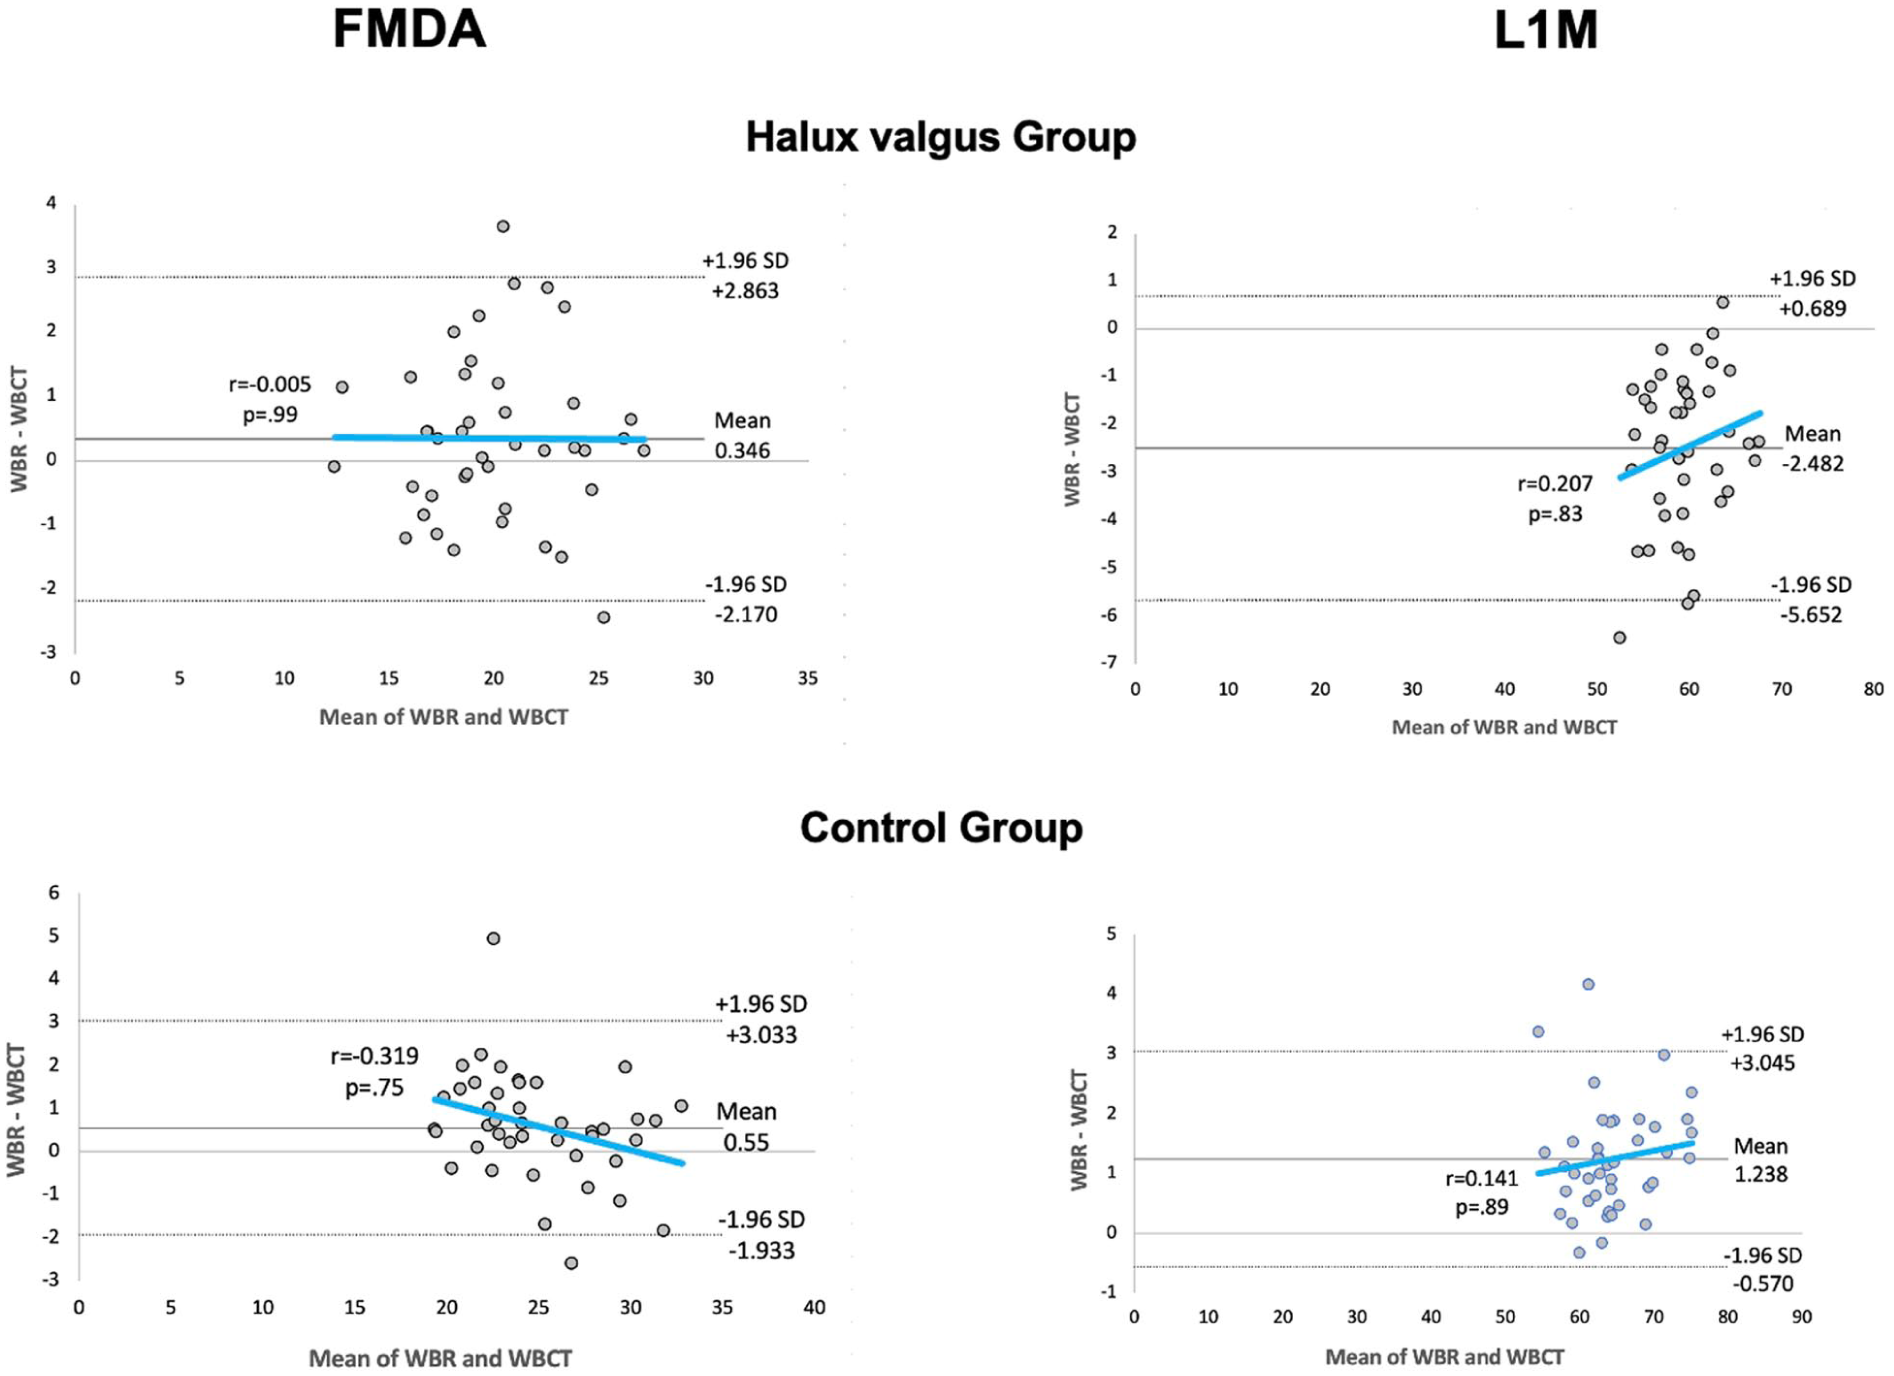
The Bland-Altman plot demonstrates good agreement between WBR and WBCT measurements, indicating that both methods provide comparable values with minimal systematic bias. FMDA, first metatarsal declination angle; L1M, length of the first metatarsal; WBR, weightbearing radiograph; WBCT, weightbearing computed tomography.
Both WBR and WBCT measurements were calculated in CubeVue software (Vue PACS; Carestream Health, Inc). The raw 3D CT data obtained in WBCT were used to reconstruct images in axial, parasagittal, and coronal planes. All measurements were independently assessed by 2 experienced observers: a foot and ankle surgeon and a musculoskeletal radiologist.
Statistical Analysis
A power analysis was previously conducted to determine the sample size required to compare WBR and WBCT measurements, yielding an estimated sample size of 42 feet. 7 FMDA, L1M, and IMA values were tested for normal distribution within each group using the Shapiro-Wilk test. Paired Student t tests or Wilcoxon signed-rank tests were used to compare WBR and WBCT measurements within and between HV and control groups, depending on data distribution.
Interobserver reliability for both radiographic and tomographic measurements was assessed using intraclass correlation coefficients (ICCs). ICC values of 0.81 to 0.99 were interpreted as excellent, 0.61 to 0.80 as very good, 0.41 to 0.60 as moderate, 0.21 to 0.40 as fair, and lower than 0.20 as slight. 24 In addition, a Bland-Altman analysis was performed to evaluate the level of agreement between WBR and WBCT measurements and to identify any potential systematic or proportional bias between the 2 methods. All statistical analysis were performed using JASP software version 0.16.2. P values less than .05 were considered statistically significant.
Results
There was a variation of 0.39° in FMDA values between lateral WBR images and WBCT sagittal images centered on the 1M longitudinal axis, but the difference was not statistically significant. The mean FMDA value in the WBR images was 20.23° (range, 12.35°-27.5°), compared to 19.84° (range, 12.2°-27.1°) in the WBCT images (P = .98). On the other side, the L1M measurements showed a significant difference of 2.48 mm between the 2 imaging modalities (P < .05). The mean L1M was 58.23 (range, 49.26-66.42) mm in WBR images and 60.71 (range, 54.46-68.77) mm in WBCT images. In the control group, there was a variation of 0.54° in FMDA values, with a mean of 25.24° in the WBR and 24.7° in the WBCT (P = .99). L1M increased 1.24 mm, from a mean value of 63.81 mm in the WBR to 65.05 in the WBCT (Table 1). The close correspondence between FMDA measurements across modalities was further illustrated by the strong linear association observed between WBR and WBCT values in both the HV and control groups (Figure 4).
When comparing measurement differences between groups, a statistically significant difference between WBR and WBCT was observed only in the L1M (Table 2). This finding in the HV group, compared with controls, supports the validity of the rectangular scalene triangle model in assessing the sagittal alignment of the 1M. However, despite a mean IMA of 18.05° (range, 15°-27.1°) in the HV groups, the degree of 1M varus deformity was not sufficient to significantly alter the inclination of its longitudinal axis as observed on conventional radiographs.
Comparison Between the HV Group and Control Group Regarding the Differences in FMDA and 1M Length Measurements Obtained From WBR and WBCT.

Abbreviations: 1M, first metatarsal; FMDA, first metatarsal declination angle; HV, hallux valgus; WBCT, weightbearing computed tomography; WBR, weightbearing radiographs.
Wilcoxon signed-rank tests.
Significance at P <.05.
In the HV group, the FMDA demonstrated very good interobserver reliability, with an ICC of 0.71 for WBR and 0.84 for WBCT measurements. The L1M showed excellent reliability, with ICCs values of 0.96 for WBR and 0.97 for WBCT measurements. For the IMA, the ICC was 0.86, indicating excellent reliability. In the control group, FMDA demonstrated ICCs of 0.78 for WBR and 0.85 for WBCT, also reflecting very good reliability. L1M measurements exhibit excellent reliability, with ICCs of 0.97 for WBR and 0.99 for WBCT. The IMA presented an ICC of 0.75, consistent with good reliability (Table 3). Overall, these findings indicate that FMDA can be measured with consistently good to very good interobserver agreement across both imaging modalities, with slightly higher reliability observed for WBCT, whereas L1M represents a highly robust and reproducible measurement regardless of modality. Furthermore, Bland-Altman analysis demonstrated strong agreement between WBR and WBCT measurements, further supporting the reliability findings and providing complementary graphical evidence of concordance with minimal systematic bias (Figure 5).
ICC Values for Measurements Obtained in the HV and Control Groups.

Abbreviations: FMDA, first metatarsal declination angle; HV, hallux valgus; ICC, intraclass correlation coefficient; IMA, intermetatarsal angle; L1M, first metatarsal length; WBCT, weightbearing computed tomography; WBR, weightbearing radiography.
Discussion
This study was the first to compare sagittal inclination measurements of the 1M in patients with HV deformities using WBR and WBCT. The application of a geometric rectangular scalene triangle model to the forefoot proved effective for assessing the 1M orientation. However, the anticipated change in projection perspective did not lead to a significant alteration in the sagittal inclination of the 1M. Clinically, these findings support the reliability of using the 1M longitudinal axis as a reference for evaluating radiographic outcomes following surgical correction of HV deformities, such as after the Lapidus procedure (LP), and hindfoot realignment surgeries. Moreover, the results indicate that FMDA measurements obtained from WBR provide information comparable to WBCT, offering practical value for surgeons who may not have access to advanced imaging modalities.22,25,26
Previous studies with a similar design have compared measurements involving the lateral longitudinal axis of the 1M obtained from conventional WBR and WBCT.27,28 Shakoor et al 6 compared talus-1M angles measured on conventional lateral WBR and sagittal WBCT images, reporting a statistically significant difference between modalities, with mean values of 11.8° on WBR and 27.3 on WBCT. In contrast, the present study specifically analyzed the lateral inclination of the 1M using the FMDA as a reference. Although small differences in lateral inclination were observed between WBR to WBCT, these were not statistically significant, suggesting that WBR provides an accurate estimation of the true sagittal alignment of the 1M, even in cases of HV with IMA greater than 15°. This discrepancy may be explained by the fact that talus–1M angles are composite measurements influenced by talar and hindfoot position, whereas FMDA reflects the intrinsic sagittal alignment of a relatively rigid first ray, which remains stable despite varus deviation or changes in talar orientation, yielding consistent measurements across imaging modalities.
The sagittal inclination of the 1M holds significant practical value in the planning and assessment of surgical correction in cases of isolated HV and HV associated with hindfoot misalignment. It serves as a key reference for measuring the FMDA and MA in these conditions.7,8 In HV surgical planning, FMDA has been used as a primary radiographic parameter to evaluate the alignment of the lateral longitudinal axis of the 1M following the LP, helping to determine the presence of 1M extension and its impact on clinical and functional outcomes. Nishikawa et al 7 evaluated 36 feet postoperatively after HV correction with the LP and found that a residual 1M extension less than 3.2°, measured by the FMDA on WBR, was associated with better clinical and functional outcomes. In contrast, Cychosz et al 1 assessed the lateral inclination of the 1M using FMDA values obtained from WBCT in a cohort of 68 patients and reported no significant correlation between FMDA and clinical and functional outcomes. Based on our findings, the FMDA measurements obtained using WBR and WBCT appear to be comparable. This consistency may be explained by the relative anatomical rigidity of the 1M in the sagittal plane and by the projection geometry of lateral WBR, which minimizes the influence of coronal plane varus deviation on sagittal inclination assessment. Consequently, sagittal inclination measurements derived from WBR can be considered a reliable reference for assessing 1M alignment in foot deformities such as progressive collapsing foot deformity associated with HV, as FMDA and MA share the longitudinal axis of the 1M as a reference. This reliability is particularly relevant for the preoperative planning and postoperative evaluation of procedures involving 1M realignment, such as the LP, in which accurate sagittal positioning of the first ray is essential.
Another relevant finding was the significant difference of approximately 2.5 mm in L1M measurements between imaging modalities. Because the 1M appears shorter on WBR, the lateral view is not reliable for accurate assessment or comparison of pre and postoperative 1M length. Consequently, this discrepancy may influence clinical interpretation and surgical planning by creating the false impression of a relatively longer second metatarsal, potentially leading to misdiagnosis of mechanical metatarsalgia based on apparent length discrepancy between the first and second metatarsals. Given that a shortening of up to 6 mm has been reported as a threshold without functional impairment of the lesser metatarsals, this misperception is clinically relevant. 29 Furthermore, reliance on lateral radiographs may prompt excessive plantarization of the 1M during fixation, particularly in LP. 8 In cases of HV associated with arthritis, preoperative planning of distal shortening osteotomies based solely on lateral radiographs may misrepresent the true amount of bone resection required. 30 These findings reinforce the importance of using relative 1M length measurements in relation to the second metatarsal on anteroposterior foot radiographs, rather than relying on lateral views for longitudinal comparisons.
Limitations of this study include its cross-sectional design and the use of a specific threshold (IMA > 15°), which may exclude milder deformities. Additionally, although power analysis was performed, the sample size was determined for the primary outcome, and secondary analyses should be interpreted as exploratory. The application of a statical mathematical model to a living, dynamic structure such as the foot simplifies functional reality and thus limits generalizability. Variables including foot adaptability and patient positioning may influence the radiographic perspective of the 1M rotation, inclination, and base height. Furthermore, our findings may not be generalizable to cases of HV associated with severe PCFD, in which the lateral longitudinal axis of the 1M may become nearly parallel to the ground. In such cases, lateral WBR visualization may be further compromised because of pronounced forefoot abduction.
This study demonstrated that in HV cases with an IMA greater than 15°, the geometric configuration of the forefoot was altered, as reflected by significant changes in L1M measurements. However, this apparent shortening did not significantly influence the lateral inclination of the 1M when assessed by FMDA on WBR compared with WBCT. Agreement analysis confirmed a strong concordance between both modalities, indicating comparable values with minimal systematic bias. Clinically, these findings support FMDA as a reliable and consistent parameter for the planning and evaluation of surgical procedures involving 1M realignment, including LP, and suggest that WBR-based FMDA assessment is sufficient for surgical planning, reducing the need for WBCT imaging.
Supplemental Material
sj-pdf-1-fao-10.1177_24730114261432620 – Supplemental material for Influence of Hallux Valgus Varus Deformity on First Metatarsal Sagittal Inclination Assessment: A Comparison Between Weightbearing Radiography and Weightbearing Computed Tomography
Supplemental material, sj-pdf-1-fao-10.1177_24730114261432620 for Influence of Hallux Valgus Varus Deformity on First Metatarsal Sagittal Inclination Assessment: A Comparison Between Weightbearing Radiography and Weightbearing Computed Tomography by Danilo Ryuko Candido Nishikawa, Fábio Côrrea Paiva Fonseca, Carlos Felipe Teixeira Lobo, Rafael Barban Sposeto, Rodrigo Sousa Macedo, Nacime Salomao Barbachan Mansur, Cesar de Cesar Netto and Alexandre Leme Godoy-Santos in Foot & Ankle Orthopaedics
Footnotes
ORCID iDs
Ethical Considerations
Ethical approval for this study was obtained from the Ethics Committee of Hospital das Clínicas da Faculdade de Medicina da Universidade de São Paulo (HCFM/USP) (approval number 81617924.4.0000.0068).
Funding
The authors received no financial support for the research, authorship, and/or publication of this article.
Declaration of Conflicting Interests
The authors declared no potential conflicts of interest with respect to the research, authorship, and/or publication of this article. Disclosure forms for all authors are available online.
References
Supplementary Material
Please find the following supplemental material available below.
For Open Access articles published under a Creative Commons License, all supplemental material carries the same license as the article it is associated with.
For non-Open Access articles published, all supplemental material carries a non-exclusive license, and permission requests for re-use of supplemental material or any part of supplemental material shall be sent directly to the copyright owner as specified in the copyright notice associated with the article.