
Abstract
Background:
Loss of subtalar (ST) motion after arthrodesis for cavovarus can alter loads through the ankle. In this context, first ray position has the potential to protect or further overload the ankle joint. This study’s purpose was to assess the influence of first ray plantarflexion on tibiotalar cartilage contact mechanics in a native ST joint and following ST arthrodesis.
Methods:
Twelve below-knee cadaveric specimens were mechanically loaded to simulate 2-legged standing (neutral ankle flexion, 600 N axial load, 45 N of Achilles tendon tension). A piezoresistive pressure sensor measured cartilage contact pressure in the loaded ankle joint both before and after ST fusion, and before and after application of a 4-mm or 8-mm dorsal opening wedge (Cotton osteotomy) in each fusion condition. Peak and mean contact pressure, contact area, and center of pressure were compared between ST-fused and unfused conditions with each first-ray correction.
Results:
Peak pressure in the unfused ST condition moved anteromedially and increased slightly over baseline by an average of 4% ± 11.5% and 11% ± 17.9% with the 4-mm and 8-mm wedges, respectively. Relative to the unfused baseline conditions, ST fusion lateralized and decreased joint contact area by an average of 18% ± 9.3% (p < 0.001). This resulted in significantly increased peak (32% ± 21.7%, 38% ± 23.4%, and 49% ± 30.5%, P < .05) and mean contact pressures (23% ± 22.2%, 23% ± 19.8%, 21% ± 19.1%, P < .05) for the fused baseline, fused 4 mm, and fused 8 mm, respectively.
Conclusion:
Overall, ST fusion had a greater effect on ankle contact pressures than changes in first-ray position. ST fusion combined with increasing plantarflexion of the first ray shifted peak contact stress anteromedially. These findings, although speculative because of the utilization of non-deformed specimens, and the use of a static loading model that does not account for dynamic muscle forces during gait, are important in the setting of a ST arthrodesis for forefoot driven cavus. As the forefoot assumes a more cavus position in the absence of ST motion, the increased contact stress may put the ankle joint at higher risk of arthritic progression.
Clinical Relevance:
These findings suggest that subtalar arthrodesis inherently increases tibiotalar contact stresses, potentially predisposing the ankle to degenerative changes regardless of the degree of first ray correction.
Introduction
The subtalar (ST) joint plays a crucial role in foot biomechanics. The 3 articulating facets (posterior, anterior, and middle) and their respective articulations assist the foot in accommodating uneven surfaces, which helps maintain balance of the tripod relationship formed by the first metatarsal head, calcaneus, and fifth metatarsal head as the foot contacts the ground.1-3 Balance of the foot tripod has major implications for an individual’s overall balance, stability, and weight distribution. For example, inversion and eversion of the ST joint can provide a compensatory role in deformity that occurs both at the level of, and proximal to, the ankle.1,4-7 Recent studies have highlighted the role of the hindfoot movement in maintaining both lower limb alignment and the weightbearing axis of the knee.8,9
In the setting of ST arthrodesis, any compensatory response of the ST joint is lost. Subsequent alterations in kinematics from loss of ST motion can lead to adjacent joint arthritis in the ankle and talonavicular joints.10-13 Effects at the ankle following hindfoot fusion can be seen in the short term with 27.3% of patients developing tibiotalar tilt after hindfoot fusion on average less than 4 months postoperatively. 12 Furthermore, In the setting of flatfoot, the presence of a hypermobile first ray allows hyper-pronation of the foot during toe-off at the end of the stance phase of gait and a subsequent valgus thrust in the hindfoot, which is usually accommodated by a functional and flexible ST joint. 14 Conversely, in cavovarus, the plantarflexed first ray makes contact with the ground early in the stance phase, and the hindfoot inverts into varus to reestablish the foot tripod. 15 Prior biomechanical studies evaluating the redistribution of ankle joint contact pressures following calcaneal osteotomies have shown only minor pressure changes in the tibiotalar joint.16-20 These results have been attributed to the fact that the intact subtalar motion compensates for ground contact point enough to minimize pressure changes seen at the ankle.18,20 However, in the setting of subtalar fusion, the absence of compensatory motion at the subtalar joint likely results in greater force transfer to the ankle, which may have clinical implications for pain and progressive joint degeneration.
The purpose of this study was to assess the influence of first ray positioning on tibiotalar cartilage contact mechanics before and after ST joint arthrodesis. We hypothesized that both the distribution and magnitude of tibiotalar joint contact stress would change with progressively greater plantarflexion of the first ray. Secondarily, we hypothesized that these changes would be more pronounced in the setting of ST arthrodesis compared to the native unfused ST joint.
Methods
Specimen and Sensor Preparation
Twelve below-knee cadaveric specimens (6 left/6 right; 5 F/7 M; average 63 years of age [range 37-73]) with no known history of injury, prior surgery, or radiographic evidence of ankle pathology were used for the study. All specimens were thawed for 24 hours prior to specimen preparation performed under the supervision of a fellowship-trained foot and ankle surgeon in our cadaver laboratory. A direct anterior approach between the extensor hallucis longus and tibialis anterior was used to access the ankle joint, and the anterior capsule was incised for sensor placement. A posteromedial approach between the interval of flexor hallucis longus and the Achilles tendon was used to access the posterior tibiotalar joint for sensor placement. To accommodate the custom Achilles clamp, the Achilles tendon was transected just distal to the musculotendinous junction using a scalpel. The tendon was reflected and the underlying fat pad was carefully excised to expose the posterior tibiotalar joint, permitting visualization and passage of the sensor, which was then secured to the talus.
Predrilling for the ST fusion and a Cotton osteotomy were performed before mechanical testing. Using fluoroscopic visualization, two 2.3-mm Kirschner wires were placed across the ST joint and overdrilled with a 4.6-mm cannulated drill for 7.0-mm fully cannulated screws. Next, the anterior incision was extended distally to expose the medial cuneiform, and a Cotton osteotomy was performed with an oscillating saw, using fluoroscopy to confirm preservation of the plantar cortex. The Cotton osteotomy was chosen to preserve first tarsometatarsal motion, while accomplishing controlled and reproducible alteration to first ray positioning. To determine if the presence of the osteotomy in our unfused baseline scenario would alter contact stresses compared to a fully intact specimen, we conducted a pilot test in 2 specimens prior to and after the Cotton osteotomy, revealing no difference in contact area, peak or average contact pressure, or recovered joint reaction forces when comparing pre- and post-osteotomy.
Real time intra-articular tibiotalar contact pressure distributions were measured using the I-Scan pressure mapping system (version 7.70) and ankle-specific sensors (model 5033; Tekscan Inc) inserted through the ankle joint capsule. The sensor is a 46 × 32 grided piezoresistive array (38.4 × 26.7 × 0.1 mm) with 1472 pressure-sensing regions (sensels), each 0.694 mm2 in area. Prior to experimental testing, sensors were conditioned and calibrated per manufacturer’s instructions. Sensors were conditioned by applying 5 cycles of uniformly distributed 800 N of compressive load (100 N above the maximum expected load) using a 90A flat rubber platen (to mimic non-rigid cartilage) mounted on a self-aligning loading plate and a stationary metal baseplate. For each conditioning cycle, load was manually ramped to 100 N, increased to 800 N at 100 N/s, held for 15-20 seconds (expected time duration of each experimental test), and removed for 30-40 seconds (double the amount of loaded time). Sensitivity was set to 39 in the I-Scan software based on the absence of saturated sensels (above 240) during application of 80% of the maximum expected experimental load. Following conditioning, sensors were calibrated by applying a series of 10 known loads (100-750 N) and using the associated average sensor intensities to develop a power-law calibration relationship. 21
As it is normal for Tekscan sensor output to degrade or drift after prolonged or repeated load application, with the potential to affect the accuracy and repeatability of measurements based on a pre-testing calibration curve, 21 the calibration protocol was repeated after the experimental tests to yield a pre- and post-calibration curve for each sensor. It was not possible to establish the true speed of sensor degradation because the sensor had to be left in the joint for the duration of testing to track contact area movement. Assuming a linear change in responsivity over the duration of testing (there were no sudden drops in sensel intensity), a set of calibration curves was created based on interpolating between the pre- and post-calibration curves for the number of experimental tests performed. For sensors that were damaged after post-test removal (n = 6), recalibration could not be performed, and a post-calibration curve was approximated using an average of those from sensors that had similar pre-test calibration curves.
Mechanical Testing
For experimental testing, each prepared specimen was mounted to a servo-hydraulic load frame (MTS Systems Corp) via a polymethyl methacrylate (PMMA) block surrounding the proximal tibia and fibula. The foot was supported by a fixed horizontal metallic plate that maintained the ankle in neutral flexion while allowing natural rotation and deformation under load (Figure 1). Calibrated pressure sensors were coated with petroleum jelly (Vaseline; Cardinal Health) to reduce friction with the cartilage, placed through the ankle joint with the sensing region centered over the talar dome. Sensors were secured using screws through the non-sensing regions of the sensor into the talar neck and non-articular posterior talus. For each experimental test, a 600-N compressive load was applied through the tibia and 50.9 N of Achilles tendon tension was applied via pneumatic cylinder (Bimba Ltd) to remove tendon slack while approximating two-legged standing. 22 With load applied, pressure data were acquired for 10 frames at 2 Hz.
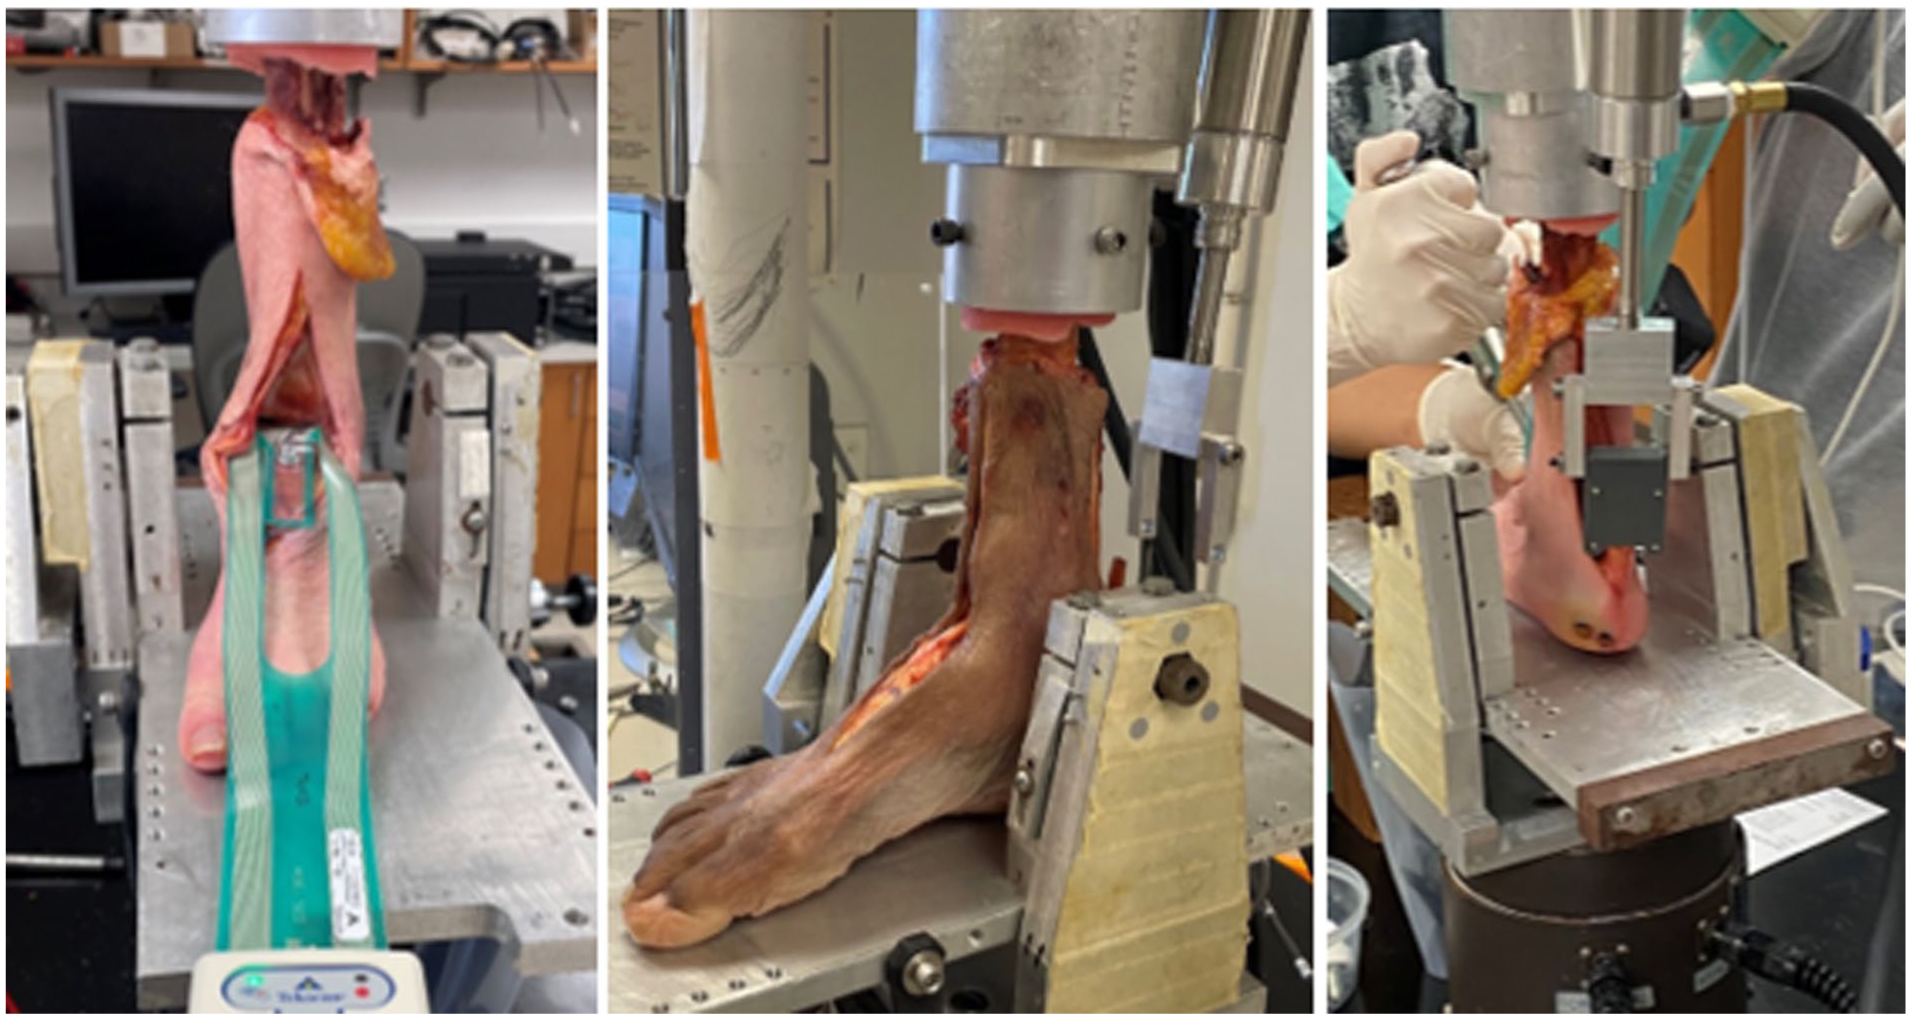
Photographs of specimens mounted in the MTS for mechanical loading. The Tekscan sensor was inserted into the tibiotalar joint through an anterior arthrotomy. The foot was positioned in neutral on a fixed metallic plate and allowed to settle under load. The pneumatic cylinder (top right) was attached to the Achilles tendon and provided tendon tension independent of MTS-applied distal compression of the tibia.
With the native (flexible) ST joint, each specimen was tested in a baseline (native first-ray) condition and after the insertion of 2 progressively larger dorsal opening wedges (4-mm and 8-mm) into a Cotton osteotomy (Figure 2). All loads were removed between tests and during the insertion of the different wedges. After removal of the 8-mm wedge, a ST fusion was performed using two 7.0-mm fully threaded screws of desired lengths measured during specimen preparation (Paragon Monster). The hindfoot was positioned in neutral and confirmed clinically and radiographically (WBCT) by a foot and ankle fellowship-trained orthopaedic surgeon. Mechanical loading was then repeated without, and then with, the 4- and 8-mm opening wedges. Six total implant configurations were tested: (1) Baseline ST unfused, (2) ST unfused with a 4-mm wedge, (3) ST unfused with an 8-mm wedge, (4) Baseline ST fused, (5) ST fused with a 4-mm wedge, and (6) ST fused with an 8-mm wedge. After all mechanical tests were completed, reference holes were made with K-wires into the talus to mark the 4 corners of the pressure sensing region. Specimens were CT scanned, and the talus with registration marks was segmented to align the spatial orientation of the sensor and associated contact pressure measurements within the joint during testing (Figure 3).
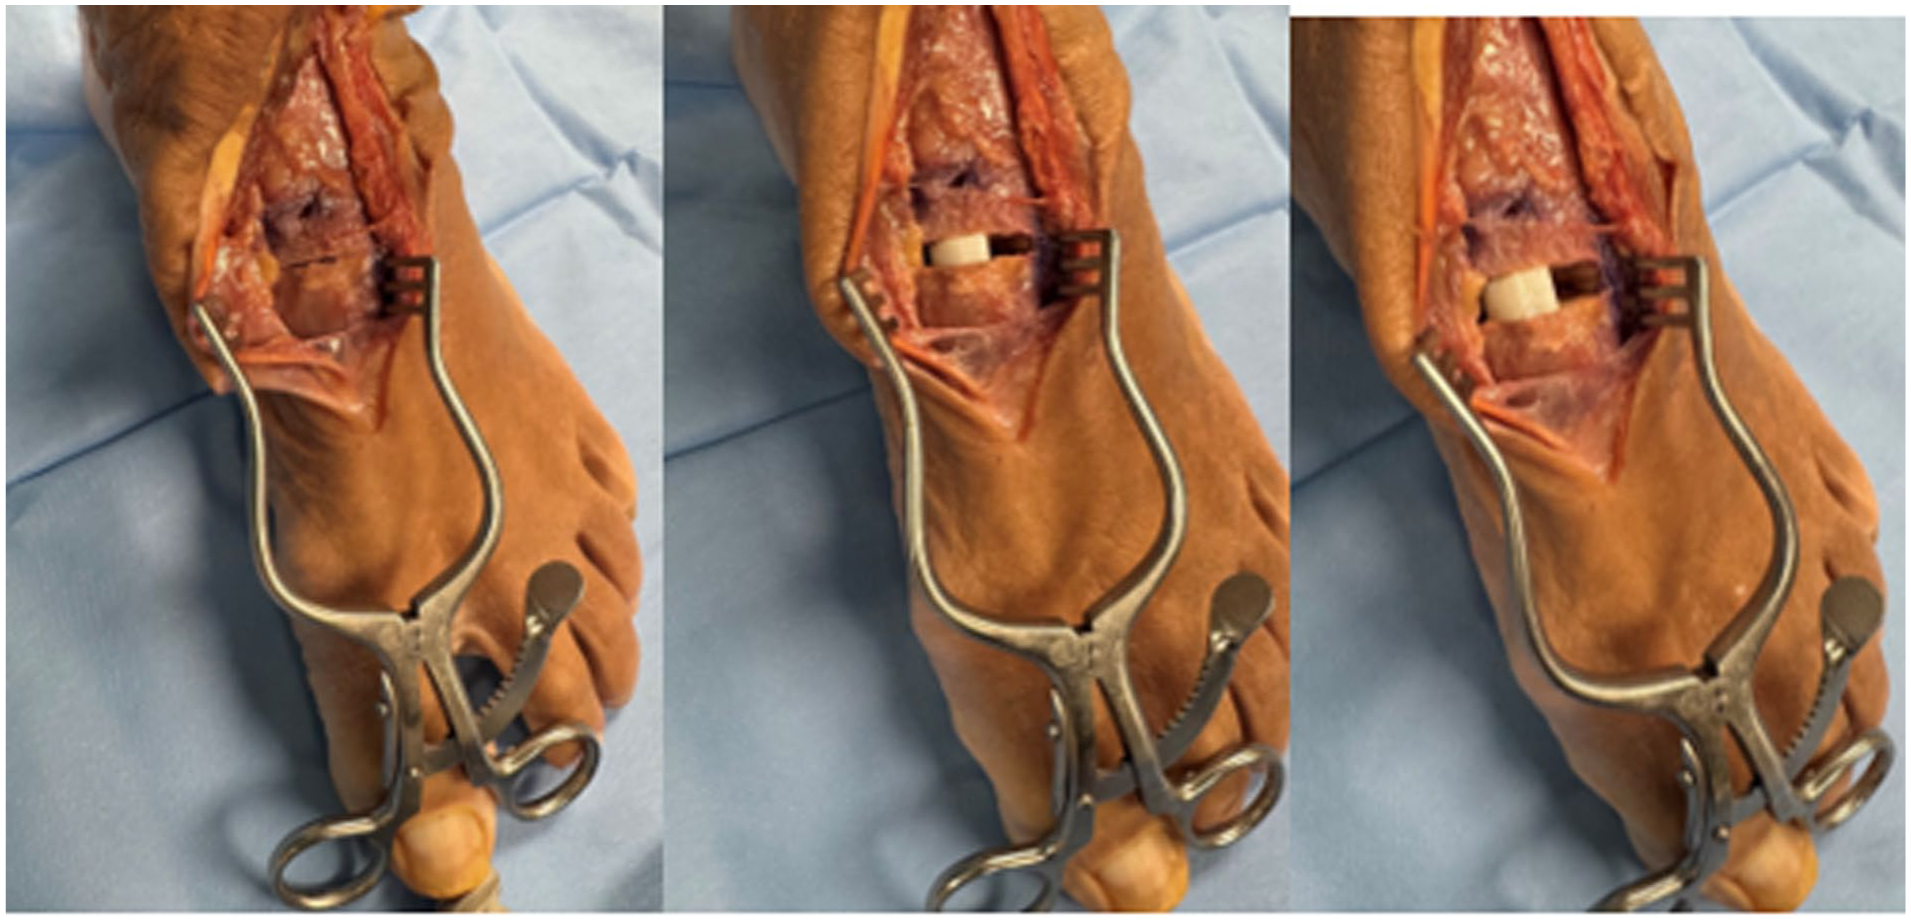
Specimen photograph showing the Cotton osteotomy with no wedge, a 4-mm wedge, and an 8-mm wedge in place for mechanical testing. Osteotomy was performed under the supervision of a fellowship-trained foot and ankle surgeon and done under fluoroscopic guidance.

Composite of Tekscan contact pressure maps for 3 representative specimens axially projected onto their respective talus surface geometry. A, B, and C are arbitrary designations assigned to 3 distinct specimens that best represent the range of contact area sizes observed across the entire specimen cohort. The sizes of the Cotton graft are arranged from left to right (smaller to larger) in each row (for unfused and fused). These qualitative results illustrate the lateral shifts of the ankle center of pressure (CoP) due to subtalar fusion, and the medial movement of the ankle CoP with progressively larger plantarflexion of the first ray in both the unfused and fused conditions.
Data and Statistical Analysis
Generation of sensor calibration curves and analysis of pressure sensor data were performed using purpose-developed routines in MATLAB (MathWorks Inc). All 10 frames acquired for each experimental test were averaged into a single representative frame, and sensel intensities were converted into pressure for a given test using the associated calibration curve interpolated for the test number (1-6) being analyzed. A pressure threshold of 0.1 MPa was used to eliminate noise and define sensels within the joint that were loaded.23,24 Active sensels that were not contiguous with the contact patches on the articular surface were manually excluded from area and average pressure calculations. Joint pressure outcome measures included average contact pressure (mean pressure of all loaded sensels on the articular surface), peak pressure (maximum contact pressure measured on a sensel), contact area (number of active sensels × sensel area), and recovered force (sum of each sensel contact pressure × sensel area). The center of pressure (CoP) was estimated using the distance-weighted mean of individual sensel forces, and the changes in CoP relative to the CoP location in the unfused baseline tests were reported (anterior and medial displacements reported as positive values).
Descriptive statistics were calculated as the mean ± SD. Friedman tests (nonparametric equivalent to repeated measures analysis of variance) were used to analyze the differences in average contact pressure, peak pressure, CoP, joint contact area, and recovered reaction force between surgical corrections. Post hoc pairwise comparisons (Dunn multiple comparison test) were performed to analyze significance of differences in pressure measures relative to the unfused baseline condition resulting from first ray position alterations and ST fusion. Statistical analyses were performed using GraphPad Prism software (version 10.2.0) with a P value of .05 to indicate significance.
Results
On average, approximately 71% of the applied 600-N load (including any contributory load from the Achilles tendon tension) was detected by the Tekscan sensors in the ankle joint during this study. The remaining load was likely born by small regions of the talar dome not covered by the sensor or the medial/lateral gutters. 25 There was no significant difference in the recovered reaction force from the unfused baseline condition and any other test, indicating calibration processes produced consistent load recovery.
First ray plantarflexion with the 4-mm wedge increased peak pressure by an average of 4.5% ± 11.5% relative to the baseline conditions (flexible ST joint, no dorsal opening wedge osteotomy), and by 11.0% ± 17.9% with the 8-mm wedge. However, neither increase was statistically significant (P > .999 and P = .318, respectively). Progressive plantarflexion of the first ray similarly caused very slight progressive increases in average contact stress and decreases in average contact area (Figure 4); however, none of the differences were significant when the ST joint was unfused. Ankle center of pressure (CoP) shifted negligibly in either the lateral/medial (LM) or anterior/posterior (AP) directions on insertion of the 4-mm (LM: 0.07 ± 0.56 mm; AP: 0.07 ± 0.66 mm) or 8-mm (LM: 0.14 ± 0.60 mm; AP: 0.14 ± 1.06 mm) dorsal opening wedges (Figure 3).

Joint contact metrics in the subtalar (ST) unfused (solid bars) and ST fused (hashed bars) conditions with differences in first ray position. Significant differences are shown relative to the unfused baseline condition: **P < .01, ***P < .001. Contact pressure tended to be higher and contact area tended to be lower with the increase in first ray plantarflexion relative to the original intact first ray position for both the ST unfused and the ST fused condition; however, these differences were not significant. The addition of the ST fusion led to significant differences in both contact pressure and contact area relative to the unfused baseline condition.
ST fusion significantly increased peak contact pressure (by 31.6% ± 21.7%; P = .008) and average contact pressure (by 23.0% ± 22.2%; P = .001) compared the unfused baseline condition (Figure 4). Joint contact area significantly decreased (by an average of 17.9% ± 9.3% in all fused tests; P < .001), and ST fusion significantly shifted the CoP laterally (average −2.9% ± 1.7 mm, P < .001) relative to the unfused CoP position (Figure 3). Plantarflexion of the first ray with the 4-mm or 8-mm dorsal opening wedges further increased peak contact pressure in the ST fused condition (by 38.1% ± 23.4% and 49.3% ± 30.5% relative to the unfused baseline condition, respectively), but these increased peak pressures were not significantly greater than the peak pressure in the ST fused condition with no first ray plantarflexion (P > .999 and P = .404, respectively). CoP with the ST joint fused shifted medially with progressively larger dorsal opening wedges (Figure 5). Interestingly, the CoP after ST fusion was still significantly lateral to that of the unfused baseline with the 4-mm opening wedge (−2.4 ± 1.9 mm, P = .023), but with the 8-mm opening wedge the CoP was no longer significantly lateral to that of the unfused baseline (−1.6 ± 2.0 mm, P = .509).

(A) Lateral-medial and (B) anterior-posterior center of pressure (CoP) displacements relative to the unfused baseline position (0 mm). Anterior and medial displacements are reported as positive values, and significant P values are indicated with asterisks. Plantarflexion of the first ray in the subtalar (ST) unfused condition does not meaningfully alter the center of pressure location. ST fusion alone significantly shifted the CoP laterally, whereas progressive dorsal opening wedges in the ST-fused foot shifted the CoP medially. (B) Although none of the anterior-posterior direction changes in ankle CoP were significant, ST fusion appeared to slightly shift the CoP anteriorly, whereas dorsal opening appeared to move the CoP slightly posteriorly.
Discussion
ST arthrodesis is an effective surgical procedure to correct foot deformity and isolated ST arthritis.11,12 The purpose of this study was to assess the influence of first ray positioning on tibiotalar cartilage contact mechanics before and after ST joint arthrodesis to better understand the potentially protective role of first ray positioning against development of degeneration-inducing loads in the ankle joint. We hypothesized that both the distribution and magnitude of tibiotalar joint contact stresses would change with progressively greater plantarflexion moment of the first ray, and that these changes would be more pronounced in the setting of ST arthrodesis compared to the native, unfused ST joint. This hypothesis was supported by our findings that ST fusion had a much stronger effect on ankle cartilage contact stress than changes in first-ray position, and changes in contact stress from changes in first ray position when the ST joint was fused were larger than with the unfused condition.
Plantarflexion of the first ray with progressively larger dorsal wedges resulted in a shift of ankle contact stresses medially, which based on the work of Schmid et al, 26 is likely due to inducing a more cavovarus foot alignment. Schmid et al evaluated the role of deformity correction in a simulated cavovarus model created by placing wedges in the medial tarsometatarsal joints. They also found contact pressures were elevated medially in the cavovarus-simulated specimens. Subsequent recovery with lateralization of contact area was seen after deformity correction via supramalleolar valgus osteotomy or lateralizing calcaneal osteotomy. 26 Hu et al 6 observed an increase in lateral ankle contact pressures associated with a varus ankle deformity, which they attributed to the flexible ST joint accommodating via valgus inclination. When the varus deformity of the ankle exceeded the capacity of the ST joint to accommodate (around 10 degrees), the lateral ankle contact pressures decreased. In the ST-fused group, a medial shift of pressure was observed. 6
Our results demonstrated a decrease in joint contact area in all ST fused conditions consistent with findings from Hutchinson et al 27 who studied the role of hindfoot fusions with progressively more rigidity (ST fusion alone vs double and triple arthrodesis) on ankle contact pressures. In neutral position loading, they found a decrease in ankle contact area by 16% for ST fusion alone, 17% for a double arthrodesis, and 17% for a triple arthrodesis. 27 Similarly, our average contact area reduction was 17.9%. The addition of the 4-mm or 8-mm wedge in the medial cuneiform did not meaningfully alter contact area compared with ST fusion alone, highlighting the strong influence of a rigid ST joint on ankle contact stresses in comparison to the effect of the first ray position.
In our setup, we tested each specimen in both the fused and unfused setting to account for specimen-to-specimen variability. Each specimen underwent the 6 experimental scenarios in the same order with the pre-prepared osteotomies and drill holes, which minimized sensor degradation. The repeated testing was accounted for statistically.
We conducted this study using healthy feet with flexible joints and normal tissue characteristics rather than using a deformity model. Although this limits some aspects of the generalizability of our findings to clinical applications, using a deformity model developed from healthy feet carries inherent limitations. A deformity model requires manipulation of normal tissue and/or bony structures to create the desired deformity,26,28-30 and for cavovarus specifically, there are very few examples (3 that we identified) of cadaveric deformity models.26,31,32 Although it would theoretically have been possible to use naturally cavovarus specimens, use of specimens with variable pre-existing deformity and variable levels of ST stiffness would have prevented to the ability to isolate the effects of ST fusion independent from first ray position.
There are several limitations to this study that are worth mentioning. Although some representative Achilles tension was applied, variation in cadaveric tissue quality and the lack of functional muscle tension may affect how directly these findings translate to specific clinical scenarios. Additionally, the static cadaveric nature of this study does not capture the dynamic forces generated by muscles or the multidirectional motion of the hindfoot joint complex during gait, and this should be acknowledged as a limitation of the current model. Next, the loading used in this work reflected standing on a flat surface, which is a low-demand activity with low ankle contact pressures. This may have resulted in smaller differences than would have been found in simulation of walking gait or other activities of daily living. We addressed sensor degradation throughout the course of testing by linearly scaling from the pretest to the posttest calibration curve based on the number of the tests performed with that sensor. 25 The assumption of linear scaling was supported by the consistency of the recovered force among each specimen’s tests; however, it is possible that there may be slight over- or underestimations of contact pressure in any individual test as a result of nonlinear sensor degradation. Further, differences in the center of pressure locations were based on sensel locations that are 2D discretized intervals; therefore, submillimeter differences of locations between specimens could not be truly appreciated. Lastly, an a priori power analysis was not conducted for this analysis; thus, we may be underpowered to detect significant differences.
Conclusion
In conclusion, this cadaveric biomechanical study underscores the impact of ST fusion on tibiotalar cartilage contact mechanics, revealing that in this cadaveric model, ST fusion reduces contact area and changes both the magnitude and distribution of ankle contact pressure compared to a native ST joint. As the first ray position became more plantarflexed, the anteromedial pressure shift suggests an effect of talar rotation resulting in preferential medial shoulder loading. In the setting of subtalar fusion, the absence of compensatory motion at the subtalar joint may lead to greater force transfer to the ankle, which may be further exacerbated by residual first ray plantarflexion. This increased force transmission through the nonhabituated cartilage may drive development of osteoarthritic joint degeneration and pain and should be considered by the treating surgeon. This study used normal, nondeformed cadaveric specimens in a static neutral position rather than using a deformity model; thus, clinical implications can only be extrapolated with caution at this time. Further investigation is needed in this important topic.
Supplemental Material
sj-pdf-1-fao-10.1177_24730114261422723 – Supplemental material for Influence of First Ray Positioning on Ankle Contact Stresses in the Setting of a Subtalar Arthrodesis: A Cadaveric Study
Supplemental material, sj-pdf-1-fao-10.1177_24730114261422723 for Influence of First Ray Positioning on Ankle Contact Stresses in the Setting of a Subtalar Arthrodesis: A Cadaveric Study by Connor Maly, Maxwell Y. Sakyi, Jessica E. Goetz, Marc J. Brouillette, Lucinda Williamson, Cesar de Cesar Netto and Bopha Chrea in Foot & Ankle Orthopaedics
Footnotes
Acknowledgements
The authors would like to thank the University of Iowa Department of Orthopedics & Rehabilitation and Lauren Crowe for funding this study and administrative assistance in the submission of this manuscript.
Ethical Considerations
Ethical approval was not sought for the present study because cadaveric studies do not require ethical approval.
Funding
The authors disclosed receipt of the following financial support for the research, authorship, and/or publication of this article: University of Iowa Investment in Strategic Priorities Grant.
Declaration of Conflicting Interests
The authors declared the following potential conflicts of interest with respect to the research, authorship, and/or publication of this article: Jessica E. Goetz, PhD, reports general disclosures of Foot & Ankle International Content Editor. Cesar de Cesar Netto, MD, reports consulting fees: Paragon 28, Ossio, Stryker, Arthrex, Extremity Medical, Zimmer Biomet, and Exactech; Royalties: Paragon 28; stock options: CurveBeam AI, Tayco Brace, and T-Soles; International Weightbearing CT Society president; AOFAS committee member; Foot and Ankle Clinics editor-in-chief. Bopha Chrea, MD, reports consulting fees: Paragon 28. Disclosure forms for all authors are available online.
References
Supplementary Material
Please find the following supplemental material available below.
For Open Access articles published under a Creative Commons License, all supplemental material carries the same license as the article it is associated with.
For non-Open Access articles published, all supplemental material carries a non-exclusive license, and permission requests for re-use of supplemental material or any part of supplemental material shall be sent directly to the copyright owner as specified in the copyright notice associated with the article.