
Abstract
Background:
Peritalar subluxation (PTS) is a key driver of symptomatic progression in progressive collapsing foot deformity (PCFD). Middle facet subluxation (MFS) is an established weightbearing computed tomography (WBCT) parameter to quantify PTS, but manual measurement is time consuming and dependent on rotation and slice selection. Automated WBCT-based tools may streamline measurement and improve reproducibility.
Methods:
Retrospective, institutional review board–approved study including 66 PCFD patients and 25 normally aligned controls. Manual MFS (mMFS) was measured by 2 fellowship-trained surgeons, repeated for intra- and interrater reliability. Automated MFS (aMFS) was calculated using a developer-level version of BoneLogic (Disior). Agreement was assessed using paired tests, correlations, intraclass correlation coefficients (ICCs), and Bland-Altman analysis.
Results:
In PCFD, no significant difference was found between mMFS and aMFS (36.4% ± 15.2% vs 37.4% ± 20.7%, P = .83). Controls showed lower automated values (18.6% ± 8.4% vs 11.9% ± 10.7%, P < .01). Across all cases, manual interrater ICC was 0.80, manual–automated ICC 0.76, and manual intrarater ICC 0.72. Agreement was moderate-to-good in PCFD but weaker in controls. Correlation between mMFS and aMFS was strong overall and moderate in PCFD. Bland-Altman analysis demonstrated minimal bias in PCFD (0.99%), within the a priori 1% acceptability threshold, whereas bias exceeded this threshold in controls (6.66%).
Conclusion:
This study evaluates agreement between manual and a predominantly automated WBCT-based MFS measurement. Automated MFS showed moderate to good agreement and interchangeability with manual methods in PCFD, whereas agreement was limited in controls. These findings support the potential clinical and research utility of automated MFS in PCFD class D assessment, following external validation.
Level of Evidence:
Level III, diagnostic study.
Keywords
Introduction
Peritalar subluxation (PTS) corresponds to class D in the most recent progressive collapsing foot deformity (PCFD) classification and has been identified as the key factor in the symptomatic progression of asymptomatic flatfoot deformities to PCFD.1 -3 One parameter used to quantify PTS is middle facet subluxation (MFS) of the subtalar joint, defined as the percentage of talar middle facet lacking coverage by the sustentaculum tali facet of the calcaneus in the coronal plane, with larger values reflecting increasing PTS and loss of sustentacular support, as commonly seen in PCFD. 4
It has been reported that MFS is significantly greater in PCFD than in controls (45.3% vs 4.8%), with a threshold of 17.9% yielding high diagnostic accuracy for PCFD. 4 Subsequent work found that MFS exceeds posterior facet subluxation by approximately 18%, progresses 1.6 times faster, and correlates more strongly with Foot and Ankle Offset (FAO), suggesting greater sensitivity to early and severe deformity. 5 More recently, a positive linear correlation between MFS and FAO has been reported, with an MFS threshold of 27.5% associated with higher FAO and greater overall malalignment. 6 MFS has also been shown to correlate with improvements in patient-reported outcomes after surgical correction of PCFD, underscoring its value for postoperative assessment. 7
Weightbearing computed tomography (WBCT) has gained traction as a 3-dimensional (3D) imaging modality for evaluating foot and ankle deformities. Compared with traditional 2D radiography or 3D multidetector CT, WBCT eliminates positional errors, enables multiplanar assessment under physiologic load, and maintains radiation doses comparable to conventional radiography.8 -10
In parallel, the development of automated and semi-automated WBCT-based 3D measurements has advanced foot and ankle imaging. These tools standardize landmark identification and axis determination, reduce operator-dependent variability, improve reproducibility across readers and institutions, and accelerate workflow, facilitating clinical decision making and large-scale research.11 -15 Several studies have reported agreement and reliability of automated or semi-automated angular and distance-based WBCT parameters in normal and pathologic feet.11,12,14
However, evidence on agreement of fully automated methods with established manual techniques for disease-specific metrics remains limited. Manual MFS measurement demonstrates good inter- and intraobserver reliability, but is technically demanding, time-consuming, and prone to variability from rotational alignment and slice selection and distance-ratio calculations.4 -6,16 A fully automated approach could streamline MFS assessment, improve its usability in clinical and research settings, enhance classification of PCFD class D, and support broader adaptation by reducing dependence on highly trained observers.17 -19
The purpose of this study was to assess agreement and reliability of a predominantly automated WBCT-based MFS measurement compared with established manual techniques. We hypothesized that the automated method would demonstrate good agreement and correlation with manual MFS, providing a reliable and efficient alternative for quantifying middle facet subluxation.
Patients and Methods
This retrospective, institutional review board (IRB)–approved study (IRB number Pro00113556) included 66 consecutive patients with PCFD, defined as FAO greater than 5.2, 20 who underwent WBCT evaluation, and had no history of prior hindfoot surgery. The control group consisted of 25 feet with neutral alignment, defined as FAO between −0.5 and 2.3. 20 These were contralateral, uninjured feet of patients who underwent WBCT for evaluation of ankle fractures, Achilles tendinopathy, or nonspecific ankle pain, and did not have a history of prior hindfoot trauma or surgery. Only 1 foot per patient was analyzed to avoid within-subject dependence.
WBCT scans (CurveBeamAI) were obtained between February 2022 and May 2024 in natural bilateral stance, with a voxel size of 0.37 mm, a 350-mm field-of-view diameter, a 200-mm field-of-view height, an exposure time of 9 seconds, and a total scan time of 54 seconds. Patients were instructed to align their calcaneus and second toe with the device sagittal plane.
Demographic data were obtained via Electronic Medical Records chart review. Measurement of the FAO, a semiautomatic 3D biometric foot alignment parameter, was performed by a single independent, experienced, and fellowship-trained foot and ankle surgeon, as previously described in the literature using the Talas tool in CubeView (CurvebeamAI). The FAO represents the position of the center of the summit of the talar dome relative to the foot tripod in the axial plane. Positive values indicate overall valgus alignment of the hindfoot. 20
Potential conflicts of interest were mitigated through multiple safeguards. All authors disclosed conflicts prior to study initiation. Study oversight, data collection, measurements, and statistical analyses were performed independently by investigators without relationships to the software providers. The first author, who conducted the statistical analyses and drafted the manuscript, had no software-related conflicts of interest. Investigators had no developer-level access to the software code, and all algorithms were executed in an anonymized manner.
Manual Measurement
Manual measurement of MFS (mMFS) was performed as initially described by de Cesar Netto et al 4 (Figures 1 and 2). First, the sagittal CT slice showing the longest length of the talar middle facet was identified. Then, the midpoint of this facet’s longitudinal length was identified, followed by selecting the coronal plane image at the intersection with this midpoint. On that coronal slice, the width of the talar middle facet (D1) as well as the linear measurement of the middle facet uncoverage (D2) were manually measured. Subsequently, the percentage of the talar middle facet not covered by the calcaneus (uncoverage) was measured (D2/D1 × 100). These metrics quantify the extent of uncoverage at the middle facet under weight-bearing conditions. Higher MFS values indicate greater PTS and loss of middle facet coverage, whereas low values reflect preserved subtalar congruency.
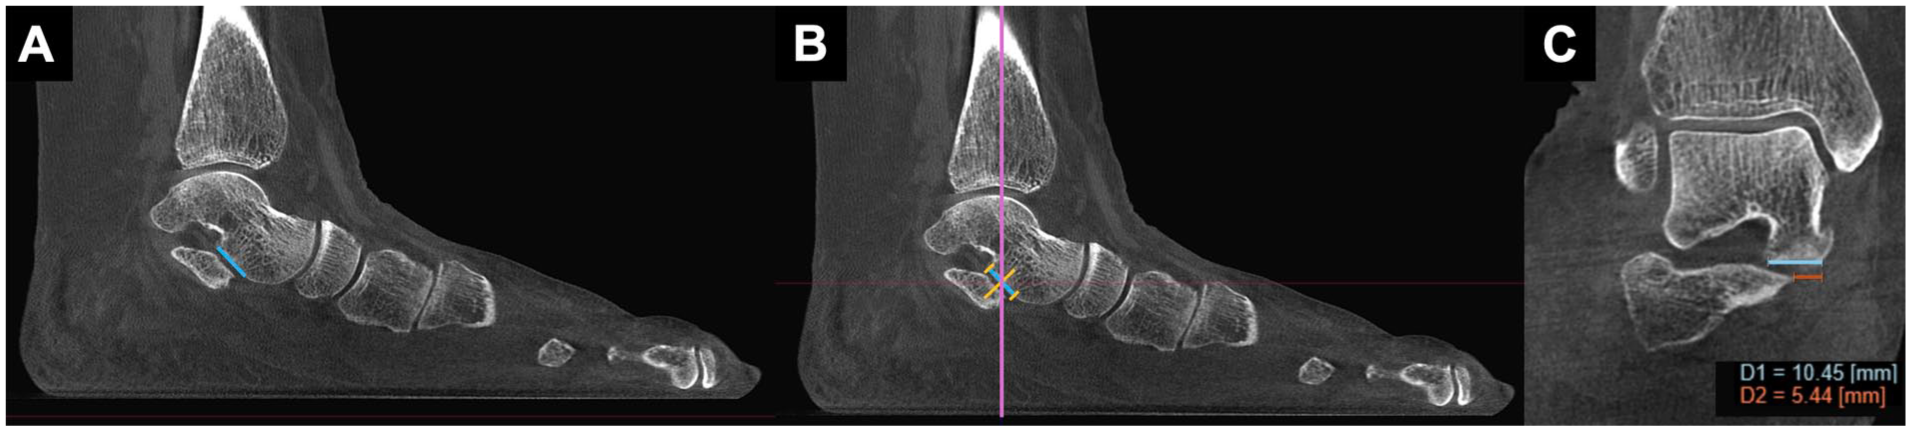
Manual middle facet subluxation (MFS) measurement in a PCFD patient. (A) The sagittal CT slice displaying the maximal longitudinal extent of the talar middle facet is identified (blue line). (B) The midpoint of this length is marked (central orange line), and the corresponding coronal slide at this level is selected (purple line). (C) On this coronal slice, the total width of the talar middle facet (D1) and the uncovered portion (D2) are manually measured. MFS is calculated as D2/D1 × 100. In this example, MFS is 52.1%.

Manual middle facet subluxation (MFS) measurement in a control foot. Steps A to C follow the same procedure as in Figure 1. In this case, the calculated MFS is 10.7%.
Two fellowship-trained orthopaedic foot and ankle surgeons independently performed all manual measurements using CubeVue, version 4.2.0.1 (CurveBeamAI). To assess intraobserver reliability, one of the surgeons repeated the measurements after a 1-month interval. At all times, the observers were masked to each other’s measurements and to their own prior measurements. For comparison with the automated measurements, the average of the 3 manual readings (2 from the first observer, 1 from the second) was used.
Automated Measurement
For the automated measurement of MFS (aMFS), BoneLogic software (Disior; Paragon28) was used with a developer-level implementation not yet publicly available; developer access was not granted to the authors. The algorithm was applied as a fixed, predefined pipeline without modification, tuning, or access to underlying source code. Segmentation and measurements were performed using a predefined automated pipeline without modification or tuning. In 2 of 91 cases (2.2%), automated segmentation was suboptimal on visual inspection, and the analysis was rerun using a semiautomated workflow with manual placement of bone seed points; no manual editing, masking, or point correction was performed. 3D models of the talus and calcaneus were generated, middle facet surfaces identified, and a 0.5-mm coronal slice automatically extracted at the centroid of the talar and calcaneal middle facets. Within this slice, lines were fitted to the middle facet vertex points of both the talus and calcaneus to define the respective facet lines. To identify the onset of uncoverage, the medial endpoint of the calcaneal middle facet line was projected onto the talar middle facet line. MFS was calculated as the uncovered talar facet width by total talar facet width × 100% (Figure 3). Measurement time was not recorded.

Automated assessment of middle facet subluxation (MFS). (A) Three-dimensional models of the talus and calcaneus are generated by automatic segmentation, and the middle facet articular surfaces are identified. A 0.5-mm-thick coronal slice is extracted at the centroid of the middle facet surfaces. (B) Within this slice, linear fits are applied to the talar and calcaneal middle facet vertex points. The medial endpoint of the calcaneal middle facet line is projected onto the talar middle facet line to define the onset of uncoverage. (C) Middle facet subluxation (MFS) is additionally calculated as the percentage of medial uncoverage, defined as the ratio of the uncovered portion of the talar middle facet to the total talar middle facet width, multiplied by 100%.
Statistics
Normality was assessed using the Shapiro-Wilk test. Paired t tests or Wilcoxon signed-rank tests for were used as appropriate, and categorical variables were compared using the χ2 test. Intermethod agreement was assessed using bivariate linear regression and Pearson or Spearman correlation coefficients, based on data distribution. A P value <.05 was considered as significant.
Inter- and intraobserver agreement for manual measurements and agreement between the manual and the automated measurements were assessed using intraclass correlation coefficient (ICC; 2-way random effects model, absolute agreement), interpreted as excellent (>0.90), good (0.75-0.90), moderate (0.50-0.75), or poor (<0.50). 21 All intraclass correlation coefficients are reported with corresponding 95% CIs (Table 3).
Bland-Altman plots were used to assess mean bias and 95% limits of agreement (LoA) with an a priori interchangeability threshold of ≤1% bias, corresponding to approximately 5% of the PCFD diagnostic threshold (17.9%).4,22 Proportional bias was evaluated using linear regression of differences on averages.
All statistical analyses were performed using EasyMedStat (version 3.42).
Results
Baseline demographic data are summarized in Table 1. Patients in the PCFD group had a significantly higher body mass index (BMI) compared with controls (P < .01). FAO values were also significantly higher in the PCFD group, confirming valgus malalignment, whereas controls demonstrated neutral alignment.
Baseline demographics of the study population. a

Abbreviation: PCFD, progressive collapsing foot deformity.
Values are presented as absolute numbers or as mean and SD.
The results of the 3 single manual measurements, their average, and the automated measurement for the entire study cohort are presented in Table 2. In the PCFD group, no significant difference was found between manual (mMFS) and automated (aMFS) measurements (36.36% ± 15.18 vs 37.35% ± 20.69; P = 0.83). In contrast, the control group showed a significant difference between mMFS and aMFS (18.57% ± 8.37 vs 11.9% ± 10.74; P < 0.01) (Figure 4).
Results of the Middle Facet Subluxation Measurements.
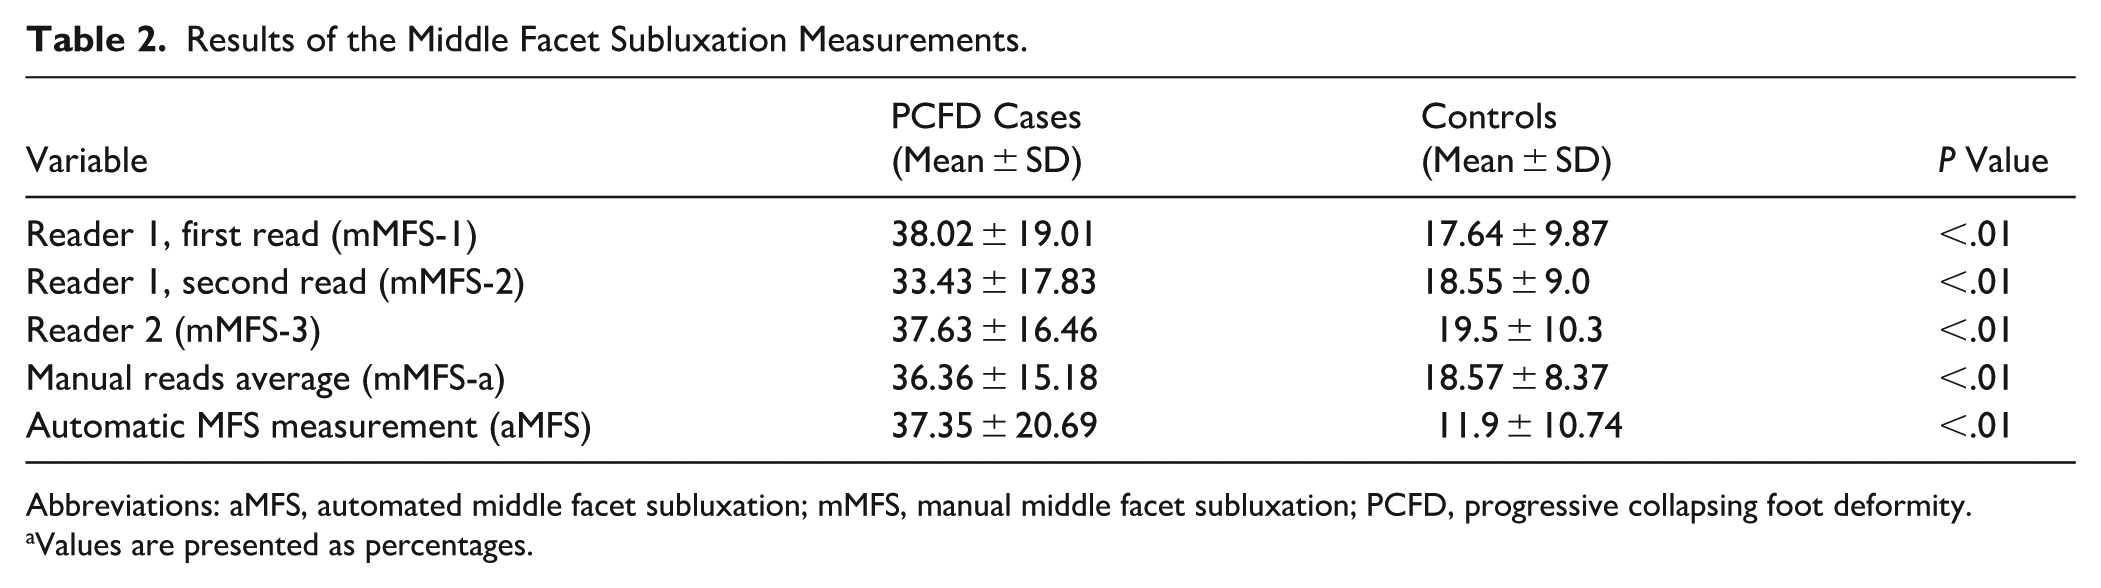
Abbreviations: aMFS, automated middle facet subluxation; mMFS, manual middle facet subluxation; PCFD, progressive collapsing foot deformity.
Values are presented as percentages.
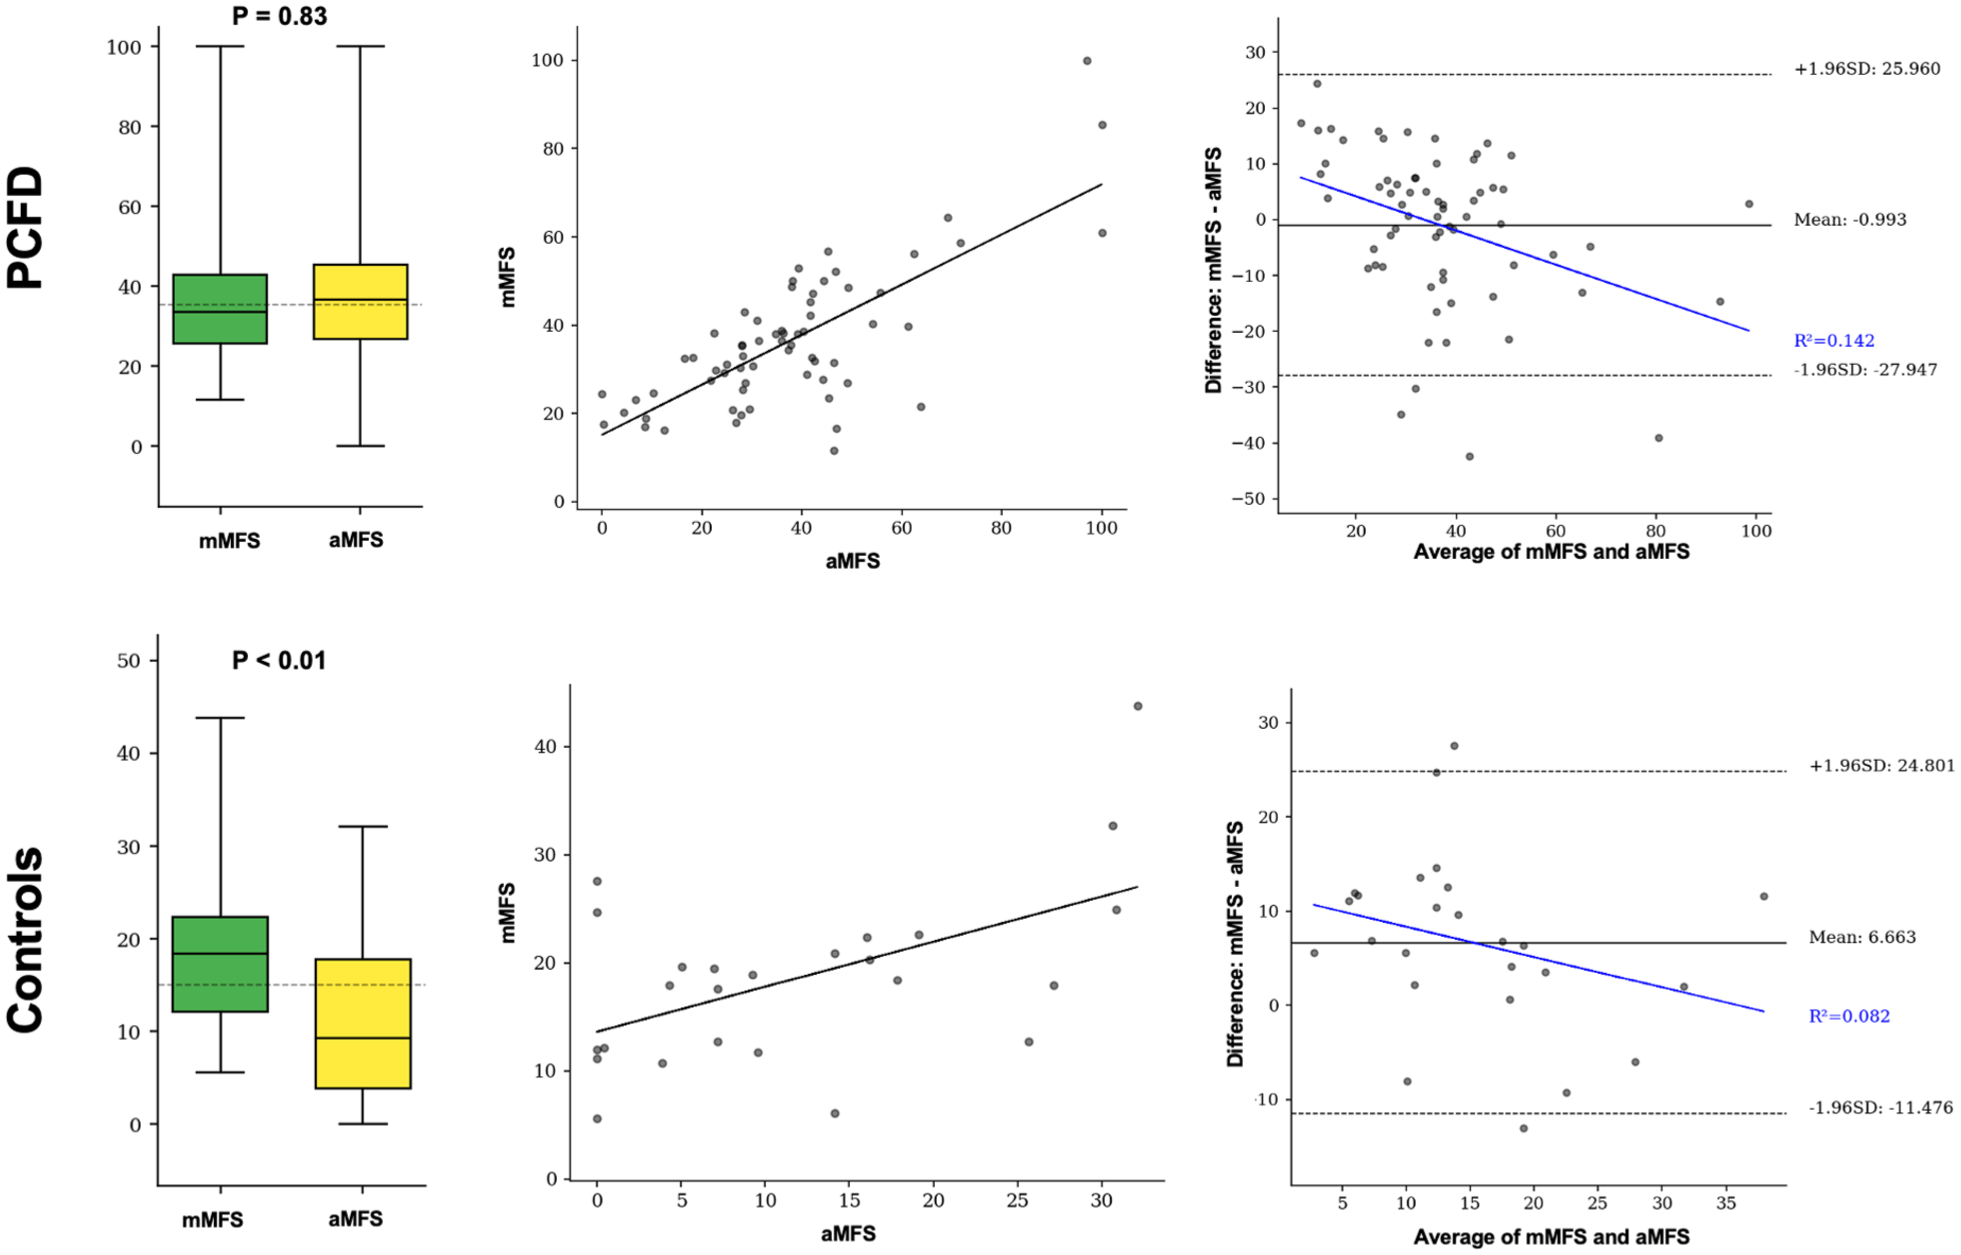
Comparison of manual (mMFS) and automated (aMFS) middle facet subluxation measurements across PCFD cases (top) and controls (bottom). Left column: Boxplots illustrate median, interquartile range, and distribution of mMFS and aMFS values. P values indicate results of paired comparisons. Central column: Scatter plots with linear regression lines demonstrate correlation between mMFS and aMFS for each group. Stronger correlation is observed in PCFD cases compared with controls. Right column: Bland-Altman plots illustrate the agreement between manual and automated MFS measurements. PCFD cases showed minimal bias and acceptable interchangeability, whereas controls demonstrated greater bias and reduced agreement.
ICCs across the entire cohort (PCFD and controls) exhibited moderate to good reliability. The highest agreement was observed for manual interrater reliability (ICC = 0.80), followed by manual vs automated comparison (ICC = 0.76), and manual intrarater reliability (ICC = 0.72). Within the PCFD group, a similar pattern emerged, with manual interrater ICC = 0.78, manual-automated interrater ICC = 0.72, and manual intrarater ICC = 0.66, all demonstrating moderate to good reliability.
For the controls, manual intrarater ICCs showed moderate reliability (ICC 0.7), whereas the interrater assessments exhibited poor reliability only (manual interrater ICC 0.47 and manual vs automated ICC 0.43) (Table 3).
Intraclass Correlation Coefficients (ICCs) for Interrater Reliability.

Abbreviations: aMFS, automated middle facet subluxation; mMFS, manual middle facet subluxation; PCFD, progressive collapsing foot deformity.
Correlation analysis revealed a moderate positive correlation between mMFS and aMFS for the overall cohort. When analyzed separately, the correlation was moderate in the PCFD group and poor in the control group (Table 4, Figure 4).
Correlations Between Manual and the Automated MFS Measurements.

Abbreviations: MFS, middle facet subluxation; PCFD, progressive collapsing foot deformity.
Bland-Altman analysis showed that in the PCFD cohort, mean bias was 0.99%, well within the predefined 1% threshold, with 95% LoA from –27.95% to +25.96%. A modest proportional bias was present (R² = 0.14), with greater MFS values tending toward smaller differences. In the control group, mean bias was 6.66%, exceeding the acceptability threshold, with 95% LoA from –11.48% to +24.80%. Proportional bias was weaker (R² = 0.08), but the larger bias indicated lack of interchangeability in neutral feet (Figure 4).
Discussion
In this study, the automated WBCT-based MFS measurement (with rare semiautomated initialization) demonstrated moderate to good agreement with manual measurements in patients with PCFD. No significant difference was observed between aMFS and mMFS in the PCFD subgroup, and Bland-Altman analysis confirmed minimal bias within the predefined acceptability threshold. Correlation between manual and automated MFS was moderate to good in the overall cohort and in patients with PCFD. Although manual measurements showed the highest interrater reliability, the automated method performed comparably in PCFD cases eliminating manual slice selection and ratio calculations. A 1% a priori threshold, corresponding to approximately 5% of the PCFD cutoff (17.9%), was selected as the smallest difference unlikely to affect classification. 4
Using this threshold, automated and manual MFS were interchangeable in PCFD, whereas controls exceeded the threshold, indicating limited interchangeability in neutral feet. Although LoAs were wide, central tendency in PCFD remained clinically acceptable, supporting group-level interchangeability; nevertheless, individual measurements should be interpreted cautiously.
Our findings are consistent with prior studies evaluating automated and semiautomated WBCT measurements. Early-generation systems showed substantial discrepancies from manual measurements due to segmentation errors, including incorrect sign assignment, whereas updated algorithms demonstrated agreement with manual measurements across multiple parameters with markedly reduced measurement time.12,23 Similarly, AI-based automated measurement of the first-second intermetatarsal angle has shown excellent agreement with manual techniques in hallux valgus. 11
These reports mirror our experience, demonstrating that with a reliable algorithm, automated measurements can match the accuracy of manual methods while substantially enhancing efficiency, particularly in pathologic feet; this observation may be less applicable in control or anatomically normal feet.
This study focuses on MFS, a PCFD-specific WBCT metric used for class D classification, severity assessment, and postoperative evaluation. MFS quantifies PTS, a key pathomechanism in PCFD, and supports clinical decision making and objective postoperative assessment. Integration of aMFS into commercial WBCT platforms could enable rapid, observer-independent assessment during routine clinical evaluation, given that performance characteristics are well understood. This automation aligns with international efforts to standardize WBCT-based PCFD metrics, supporting broader global applicability.
Using manual MFS measurements, the control group demonstrated a mean uncoverage of 18.57%, slightly above the diagnostic threshold of 17.9% identified by de Cesar Netto et al 4 for PCFD. In contrast, the automated measurement for the same cohort was 11.9%, below this threshold and significantly different from the manual values. Because both measurements were performed on identical imaging data sets, this discrepancy cannot be attributed to selection bias but rather reflects methodologic differences in slice selection and measurement techniques. We did not formally quantify the spatial offset between manually and automatically selected slices, which limits causal attribution of observed differences between reader-dependent and centroid-based approaches; this distinction is most relevant in neutral feet, where minimal and spatially localized uncoverage makes measurements particularly sensitive to small coronal slice shifts, without implying systematic undercalling by the automated method.
de Cesar Netto et al 3 showed progressive increases in PCFD class A to C markers from controls to asymptomatic flatfeet, whereas significant PTS (class D) was observed only in symptomatic PCFD, highlighting its role in driving symptoms and dysfunction. Importantly, in the present study, MFS measurements remained highly significantly different between PCFD and controls across all methods (Table 2), consistent with these prior findings. 3 Higher BMI in PCFD may further accentuate PTS under weightbearing.
Furthermore, the control group demonstrated lower ICCs and weaker correlations between manual and automated MFS measurements compared with the PCFD group. This finding is likely multifactorial. First, the control cohort was smaller in size, which may have widened CIs and reduced the stability of reliability estimates. The smaller size of the control cohort represents a constraint on generalizability and statistical robustness, although it does not affect the within–data set comparison between manual and automated measurements. Second, the absolute magnitude of MFS values in the control group was low, such that even small absolute differences between readings translate into relatively large percentage changes, which can disproportionately reduce ICC values and correlation coefficients. Although this may appear counterintuitive, this finding is consistent with the statistical properties of ICC, which reflects the ratio of between-subject variability to total variability rather than absolute inter-reader differences. In morphologically normal control feet, anatomical variability across subjects is limited, resulting in low between-subject variance; under these conditions, even minimal interreader differences can markedly reduce ICC estimates. In contrast, the greater heterogeneity of MFS values in the PCFD group increases between-subject variance, so similar absolute inter-reader differences constitute a smaller relative change and exert less influence on reliability metrics. Accordingly, lower ICCs observed in controls reflect differences in subject variability rather than reduced measurement reliability, representing expected statistical behavior rather than inferior measurement performance.
In our study, ICC values were in general lower than those reported in previous WBCT studies on MFS. We found manual intrarater and interrater ICCs of 0.72 and 0.80, respectively. We were surprised to find a lower intra- than interobserver ICC, as intraobserver reliability is typically expected to be higher. This finding likely reflects study design and timing effects rather than a true difference in measurement consistency. Specifically, the 1-month washout period used for intraobserver assessment may have introduced additional variability, whereas interobserver measurements were performed shortly after a shared training session, potentially enhancing methodological alignment. These factors should be considered when interpreting the reliability estimates. By comparison, de Cesar Netto et al 4 reported intraobserver and interobserver ICCs of 0.90 and 0.75 in a case-control study of PCFD consisting of total 60 patients. Barbachan Mansur et al 6 found interobserver ICCs of 0.87 in 74 feet with PCFD, and de Cesar Netto et al 5 reported even higher values for MFS in a series of 87 feet with PCFD, reporting intraobserver and interobserver ICCs of 0.99 and 0.97, respectively.
Several factors may account for this discrepancy. These include greater cohort heterogeneity, differences in observer training or experience, and subtle variations in WBCT acquisition parameters or reconstruction settings between institutions.
This study is the first to evaluate agreement and reliability of an automatic MFS measurement, demonstrating its potential to reduce variability and streamline analysis in clinical and research settings. Furthermore, aMFS may improve the precision of PCFD class D classification, which have been shown to have the lowest reliability and to be frequently underdiagnosed.18,19 This may enhance diagnostic accuracy and support more consistent application of the PCFD classification system in practice. 1
This study has several limitations. First, MFS relies on a single coronal slice, whereas evaluation of coverage across the entire middle facet may better reflect true PTS. 3 No formal power analysis was performed; although the PCFD sample size aligns with recommendations for ICC estimation, the smaller control cohort limits the precision and robustness of reliability estimates. Repeatability of the automated algorithm itself was not evaluated, as repeated analyses of identical data sets were not performed, representing a limitation of the automation rather than of WBCT imaging. 23 This aspect should be addressed in future validation studies. In addition, the proprietary nature of the algorithm limits transparency regarding segmentation behavior, internal settings, and potential error propagation, and no qualitative error analysis was conducted as in some prior reports. 23 Although FAO is a validated and widely used measure of global hindfoot alignment, it does not isolate subtalar joint alignment, and its sensitivity in distinguishing joint-specific or subtle deformity patterns may be limited, which could influence cohort classification near threshold values. 24 Given that only 2.2% of cases required semiautomated initialization and no manual correction was applied, the impact of user interaction on agreement and reliability analyses is expected to be negligible. Consequently, robust agreement in control feet remains essential, and automated MFS should be interpreted with caution in neutral anatomies, particularly when used for classification or group assignment, until further external validation is available.
Conclusion
Predominantly automated WBCT-based MFS measurement demonstrated substantial agreement with established manual techniques in PCFD, supporting its potential utility for PCFD class D assessment following external validation. By reducing observer dependence and measurement time, aMFS may improve the consistency of PTS evaluation, support surgical decision making, and enable objective postoperative assessment. Future studies with larger control cohorts, broader clinical scenarios (including metal implants), and cross-platform comparisons are needed to assess repeatability, particularly in low-deformity feet, and clarify the relationship between automated measurements and patient outcomes.
Supplemental Material
sj-pdf-1-fao-10.1177_24730114261422230 – Supplemental material for Automated vs Manual Measurement of Middle Facet Subluxation in Progressive Collapsing Foot Deformity Using Weightbearing CT
Supplemental material, sj-pdf-1-fao-10.1177_24730114261422230 for Automated vs Manual Measurement of Middle Facet Subluxation in Progressive Collapsing Foot Deformity Using Weightbearing CT by Wolfram Grün, Francois Lintz, Emily J. Luo, Carla Carfi, Enrico Pozzessere, Antoine Acker, Pierre-Henri Vermorel and Cesar de Cesar Netto in Foot & Ankle Orthopaedics
Footnotes
ORCID iDs
Ethical Considerations
Our institutional review board (IRB) approved this study (IRB number Pro00113556).
Authors Contributions
Wolfram Grün, MD: Original idea, Data collection, Manuscript writing, Submission. François Lintz, MD, PhD: Original idea, Data collection, Manuscript writing. Emily Luo, MHSc: Data collection, Manuscript editing. Enrico Pozzessere, MD: Manuscript editing. Carla Carfi, MD: Manuscript editing. Antoine Acker, MD: Manuscript editing. Pierre-Henri Vermorel, MD: Data collection, Manuscript editing. Cesar de Cesar Netto, MD, PhD: Data collection, Manuscript editing.
Funding
The authors received no financial support for the research, authorship, and/or publication of this article.
Declaration of Conflicting Interests
The authors declared the following potential conflicts of interest with respect to the research, authorship, and/or publication of this article: Francois Lintz, MD, PhD, reports general disclosures of Paragon28 (consultant, shareholder), CurvebeamAI (consultant, shareholder), Newclip Technics (consultant, royalties), Podonov (consultant, royalties), LINNOV (founder, shareholder), Followinvest (shareholder), International WBCT Society (co-founder, pastpresident). Emily J. Luo, MHSc, reports general disclosures of Sana Biotechnology (shareholder). Antoine Acker, MD, reports general disclosures of CurvebeamAI (shareholder). Cesar de Cesar Netto, MD, PhD, reports general disclosures of Paragon28 (consultant, medical advisory board, royalties), CurvebeamAI (consultant, shareholder), Ossio (consultant), Zimmer (consultant), Stryker (consultant), International WBCT Society (co-founder, President), Exactech (consultant), Arthrex (consultant), Tayco Brace (shareholder), extremity medical (consultant), AOFAS committee member, Foot Ankle Clinics (editor in chief). Disclosure forms for all authors are available online.
References
Supplementary Material
Please find the following supplemental material available below.
For Open Access articles published under a Creative Commons License, all supplemental material carries the same license as the article it is associated with.
For non-Open Access articles published, all supplemental material carries a non-exclusive license, and permission requests for re-use of supplemental material or any part of supplemental material shall be sent directly to the copyright owner as specified in the copyright notice associated with the article.