
Abstract
Research Type:
Level 3 - Retrospective cohort study, Case-control study, Meta-analysis of Level 3 studies
Introduction/Purpose:
Lateral column lengthening (LCL) is commonly used for reconstruction of flexible (stage 1) Progressive Collapsing Foot Deformity (PCFD). Two popular techniques are the Evans osteotomy, placed between the anterior and middle subtalar facets parallel to the calcaneocuneiform joint, and the Hintermann osteotomy, positioned obliquely between the middle and posterior facets. Both aim to preserve the articular surface, yet subtalar arthritis has been frequently observed on long-term post-operative follow-up. Given the variability in calcaneal anatomy, neglecting these differences may contribute to joint damage. This study assessed calcaneal morphology using distance maps (DM) and 3D-printed calcaneal models, which provide a tactile experience. It aimed to demonstrate the utility of 3D-printed models, hypothesizing that they might be better suited to detect anatomical variations compared to DM alone.
Methods:
44 feet (43 patients) who underwent joint-sparing reconstructive surgery for flexible PCFD were included. Preoperative Weightbearing CT (WBCT) scans were used to create stereolithography models of the calcanei, which were then 3D-printed at a 100% scale. DM were generated using Disior Bonelogic™ with a threshold from 0-5mm, visualizing the distribution of distances between opposing subtalar joint surfaces as color-coded heat maps. Four fellowship-trained foot and ankle surgeons independently classified the subtalar joint subtypes on both 3D-printed calcanei and DM using the Bruckner classification: A (three distinct facets), B (transitional anatomy between the anterior and middle facets), C (confluent anterior and middle facets), and D (absent anterior facet). The same grading was applied to DM, and assessments were repeated after two weeks. Intra- and interrater reliability was evaluated using percentage agreement as well as Cohen’s kappa and Fleiss’ kappa. Contingency analysis was run for the DM and the 3D printed reads.
Results:
Interrater percent agreement was moderate to good across all readers for both DM and 3D-printed models, however, Fleiss’ kappa for ICC was poor. Intrarater percent agreement was good for all readers across DM and 3D-printed models, with both methods demonstrating substantial to strong Cohen’s kappa for ICC. Contingency analyses revealed differences in classification frequency. More specifically, when analyzing absolute change between DM and 3D prints for all readers, 3D prints led to more Class A (+7.1%) and C (+13.4%) and fewer class B (-1.7%) and D assessments (-18.8%).
Conclusion:
Our findings suggest that DM may underestimate the anterior and confluent anterior-middle facets. In application, osteotomy planning solely relying on DM alone could therefore lead to joint damage and subsequent subtalar arthritis. WBCT-based 3D printing provides a physical, tactile representation of patient-specific anatomy, enabling a comprehensive assessment of joint morphology that could have direct surgical implications when choosing the type of osteotomy for LCL.
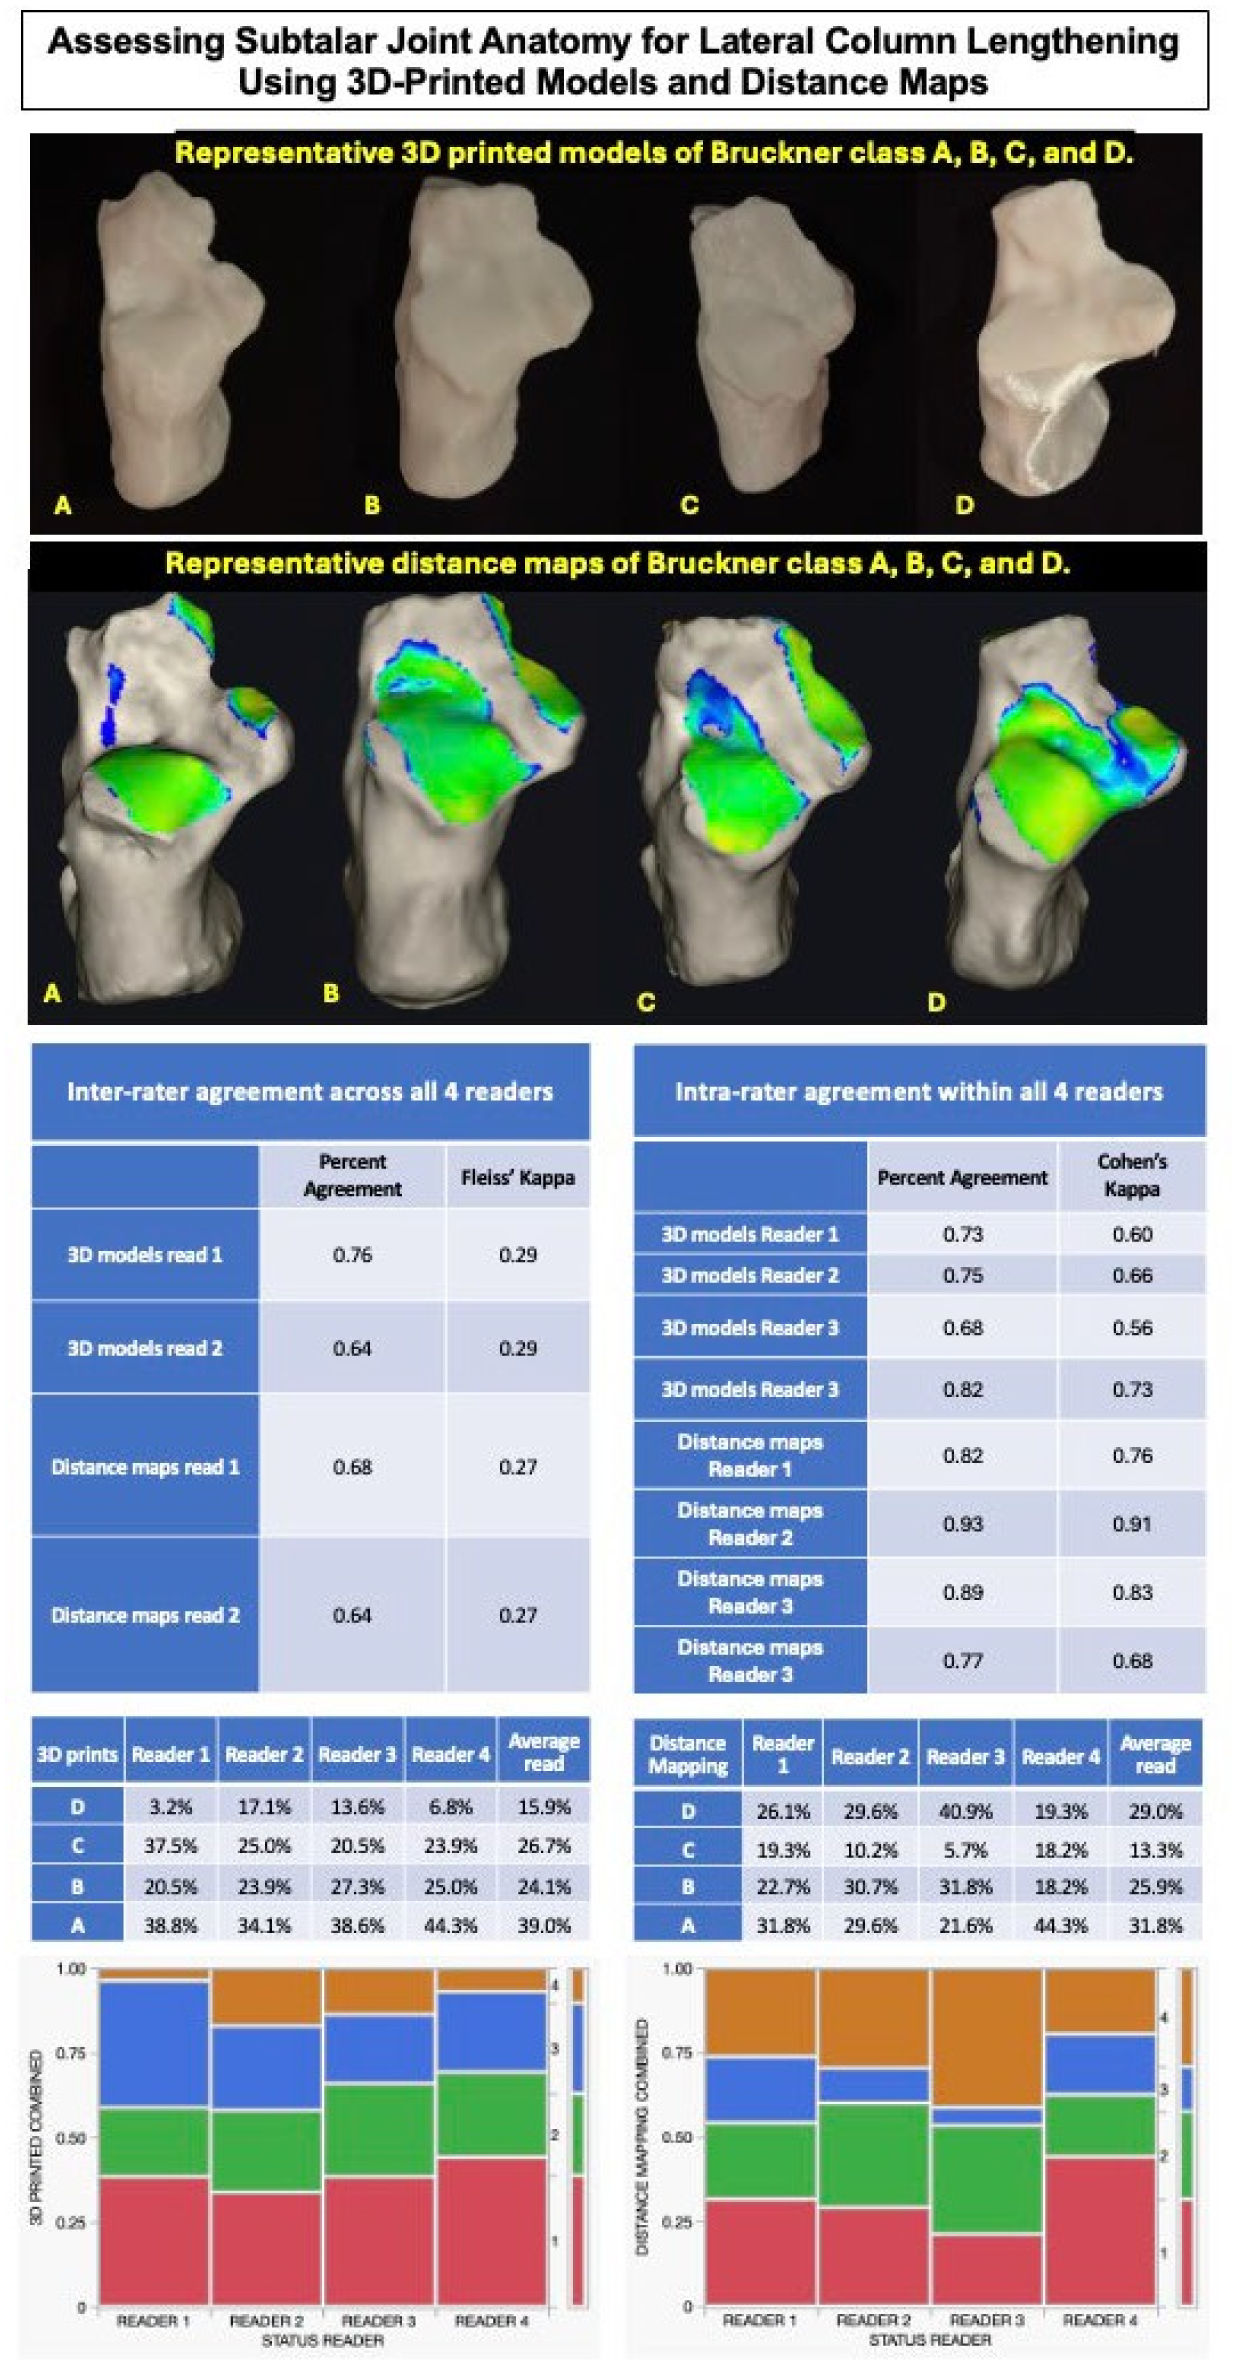
Top: 3D printed models versus Distance Maps by Bruckner classification. Middle: Inter-rater and Intra-rater reliability between 4 readers. Bottom: 3D printed models and Distance Maps percentage of reads for each classification, Mosaic plots across readers for each classification.