
Abstract
Background:
Deltoid ligament injuries occur in specific sequences during rotational ankle trauma, yet the current understanding of these sequences may be flawed. Computer modeling offers a new method for assessing ligament behavior under rotational injury mechanisms.
Methods:
A biomechanical computer simulation model was developed using AnyBody Modeling Software to evaluate ligament strain in rotational ankle injuries. Experimental data from a cadaveric study involving 15 human ankle specimens subjected to various loading conditions were used to identify the model parameters. After parameter identification from uninjured cadaveric data, we simulated Supination-External Rotation (SER) stage 2-4b injury model by removing the corresponding ligaments. Validation was performed by comparing the model predictions against the biomechanical experimental data.
Results:
The computer model replicated experimental findings, with correlation coefficients ranging from 0.81 to 0.99 across all injury stages and loading conditions. Furthermore, tension in the deep posterior tibiotalar ligament (DPTTL) progressively increased from SER2 to SER4a but remained unchanged in the SER2 phase. The model effectively captured progressive ligament strain and changes in medial clear space during injury progression.
Conclusion:
This study presents and validates an early-stage biomechanical simulation model for rotational ankle injuries, providing a novel tool for examining ligament biomechanics and injury mechanisms.
Clinical Relevance:
Our model offers insights that were previously unattainable through cadaveric or clinical studies by simulating ligament strain during injuries. This can assist in generating hypotheses, enhance injury detection, refine treatment strategies, and may challenge existing classification systems.
Introduction
Rotational ankle fractures may be managed nonoperatively when ligament integrity is preserved.9,12 However, radiographs frequently miss ligament injuries, reducing diagnostic accuracy. Identifying fracture and ligament injury patterns can predict radiographically occult injuries.
The Lauge-Hansen classification remains a cornerstone for defining fracture mechanisms, identifying injuries, and guiding treatment. Yet, recent evidence suggests it may not fully reflect current biomechanical and clinical understanding.6,10 -12,15 Advances in deltoid ligament research have revealed its intricate anatomy, 4 highlighting functional distinctions between partial tears (intact deep posterior tibiotalar ligament [dPTTL]) and complete ruptures.1,6 Partial tears, in particular, challenge conventional treatment strategies and raise concerns about the accuracy of the Lauge-Hansen model.6,16
Although biomechanical research has advanced our understanding of the deltoid ligament’s structure and function, directly measuring ligament strain during fractures remains challenging. To bridge this gap, we aimed to develop and validate a computer simulation model capable of evaluating changes in ligament strain during common rotational ankle injuries. This model would provide insights into ligament behavior that is difficult to achieve through live tissue studies. Model optimization was performed by feeding the model with data from uninjured specimens, with subsequent validation achieved by comparing computer model predictions to injured biomechanical experimental data.
Materials and Methods
Experimental Setup
The biomechanical data used to optimize and validate the computer model were obtained from a published study involving fifteen fresh-frozen human cadaveric foot and ankle specimens. 6 The Regional Committee for Medical and Health Research Ethics (REK Sør-Øst, ref. 178067) granted ethical approval for the study. Prior studies detail specimen preparation, testing protocols, and statistical analyses. 6
The experimental setup used an industrial robot (KR6 R900 Sixx; KUKA, Augsburg, Germany). The calcaneus was fixed to a mounting platform, whereas the proximal tibia was secured to the robot's distal arm via a force-torque sensor (Gamma; ATI Industrial Automation, Apex, NC). Biomechanical data were collected across 4 injury states: uninjured, SER2, SER4a, and SER4b (Table 1); and for 3 talocrural positions: neutral, 10 degrees dorsiflexion, and 20 degrees plantarflexion. The biomechanical testing protocol included applying a 45-N axial force during 4 stability tests for each injury state and talocrural position. The tests were (1) lateral translation with a 30-N force displacing the tibia medially, (2) external rotation until 2-Nm torque or 40 degrees, (3) internal rotation until 2-Nm torque or 40 degrees, and (4) valgus rotation with 2-Nm torque or until 25 degrees. Further details on the data structure can be found in the original study. 6
Lauge-Hansen SER Classification and Corresponding Injuries Used in the Development of Injury Assessment Models.

Computer Model
The computer model was developed using the AnyBody Modeling System (version 7.4), 7 simulating bones, joints, and ligaments. The model represented the tibia, fibula, and talus as separate bones, whereas the foot was modeled as a single rigid body. The subtalar and talocrural joints were defined as 1–degree of freedom (DOF) hinge joints with force-dependent kinematics (FDK) in the other DOFs. The tibiofibular joint was modeled as a fixed mechanical joint with FDK-DOFs. Unlike previous single-DOF models, 8 FDK enables the computation of muscle, ligament, and joint forces, as well as internal joint displacements constrained by contact surfaces and ligament structures. 14 FDK-DOFs were modeled with a linear stiffness. Stiffness values for each DOF, reflecting joint capsule influence and bony congruences, are provided in the supplementary materials.
Ligament definitions
The computational model incorporated key ankle ligaments, including the anterior talofibular (ATFL), calcaneofibular (CFL), posterior talofibular (PTFL), deep and superficial posterior tibiotalar (dPTTL, sPTTL), tibiocalcaneal (TCL), tibiospring (TSL), deep anterior tibiotalar (dATTL), and tibionavicular (TNL), posterior talocalcaneal (pTCL), and tibiofibular syndesmosis ligaments (interosseous [IoL], anterior tibiofibular [ATiFL], and posterior tibiofibular [PTiFL] ligaments). Figures 1 and 2 illustrates the ligament origin and insertion points, which were based on Campbell, Michalski, et al 4 and Clanton, Campbell, et al, 5 whereas tibiofibular syndesmosis definitions used anatomical data from Hermans et al 13 and Tano et al. 20 Furthermore, ligament stiffness was calculated by first using the ATFL stiffness as a reference. This was averaged from several studies.2,18,19,21 Then, the stiffness of the other ligaments was scaled based on their cross-sectional area and length.3,17,19
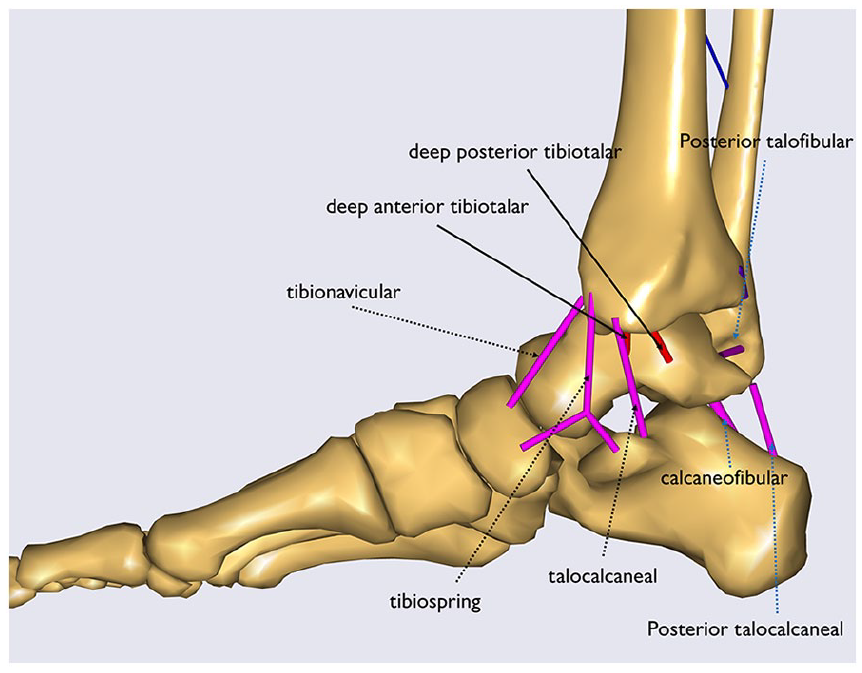
A medial sagittal view of the computer model, highlighting the specified ligaments. The deltoid ligament sections are indicated with black arrows, whereas other ligaments are represented with blue arrows. The deep deltoid sections are marked with solid arrows and shown in red. Note that the tibiofibular syndesmosis ligaments are concealed for clarity.

A lateral sagittal view of the computer model showing the tibiofibular syndesmosis ligaments. Please note that the other ligaments are hidden here for clarity.
Parameter Identification and Validation
The model parameters were identified using sequential least squares programming, with an objective function formulated as the root mean square error (RMSE) between simulation predictions and biomechanical data. 6
Identification targeted joint stiffness and ligament slack lengths as model parameters, which lack comprehensive data sets in the literature.
To simulate the biomechanical experiments in the computer model environment, the robot dynamics were simulated as a force (45-N axial, 30-N lateral) and a moment (2-Nm valgus, internal rotation, external rotation) on the tibia plateau, and the calcaneus was fixed to the ground. The robot-tibia interface was simulated as 6-DOF stiffness, with 70 700 N/mm for translation and 14 700 N/rad for rotation.
The parameter identification aimed to align the computer model with the uninjured data set. After this, the model was validated against the SER injury data set. The simulation sequence followed the biomechanical test protocol as previously detailed, with 4 progressive ligament injury models (uninjured, SER 2, SER 4a, SER 4b) simulated in 3 different talocrural positions (neutral, 10 degrees plantarflexion, 20 degrees dorsiflexion), evaluated by 4 stability tests (lateral translation, internal rotation, external rotation, valgus rotation). The SER injury stages were simulated by removing the corresponding ligaments, consistent with the biomechanical cadaver study, 6 as shown in Table 1 and visualized in Figure 3.

Frontal views of the injury stages: uninjured, SER2, SER4a, and SER4b in the computer model.
Outcomes
Outcomes included tibial rotation, measured by tracking the rotation of a vector defined between nodes on the calcaneus and superior tibia (Figure 4), and the lateral translation, calculated as the distance between defined nodes on the medial talus and medial malleolus in the direction of the superior talar surface (Figure 5).

Rotation caused by a valgus load in the computer model.

This figure illustrates the definition of the medial clear space, which is measured as the widest distance between the lateral border of the medial malleolus and the medial side of the talus, parallel to the dashed line.
The results of the computer model were compared to the experimental results, and the ligament tensions were extracted for verification.
Statistical Analysis
Pearson correlation coefficients were calculated to assess the agreement between the computer model and experimental results across 12 tests. Values between 0.5 and 0.75, 0.75 and 0.9, and greater than 0.9 are classified as moderate, good, and excellent reliability, respectively. 17 Analyses were carried out using Microsoft Excel (Microsoft Corp, Redmond, WA) and programmed statistics in Python (version 3.13.1) (Python Software Foundation, Wilmington, DE).
Results
Model Validation
The correlation coefficients of the computer model (Table 2) indicate excellent agreement with the experimental results for all tests except neutral-valgus and plantarflexion-valgus, which were moderate. This confirms that the model accurately replicated the observed progressive trends in tibial rotations and MCS across the various stages of ligament injury models.
Pearson Correlation Coefficients Related to the Computer Model and the Experimental Results for Each of the 12 Tests.

Figure 6 provides a comprehensive comparison between the computer model predictions and the biomechanical data for each test and injury stage. The results demonstrate that the model effectively captured the changes in joint behavior as ligament injury models progressed through the SER2, SER4a, and SER4b stages. The RMSE was larger for SER4b than the other stages (Table 3).
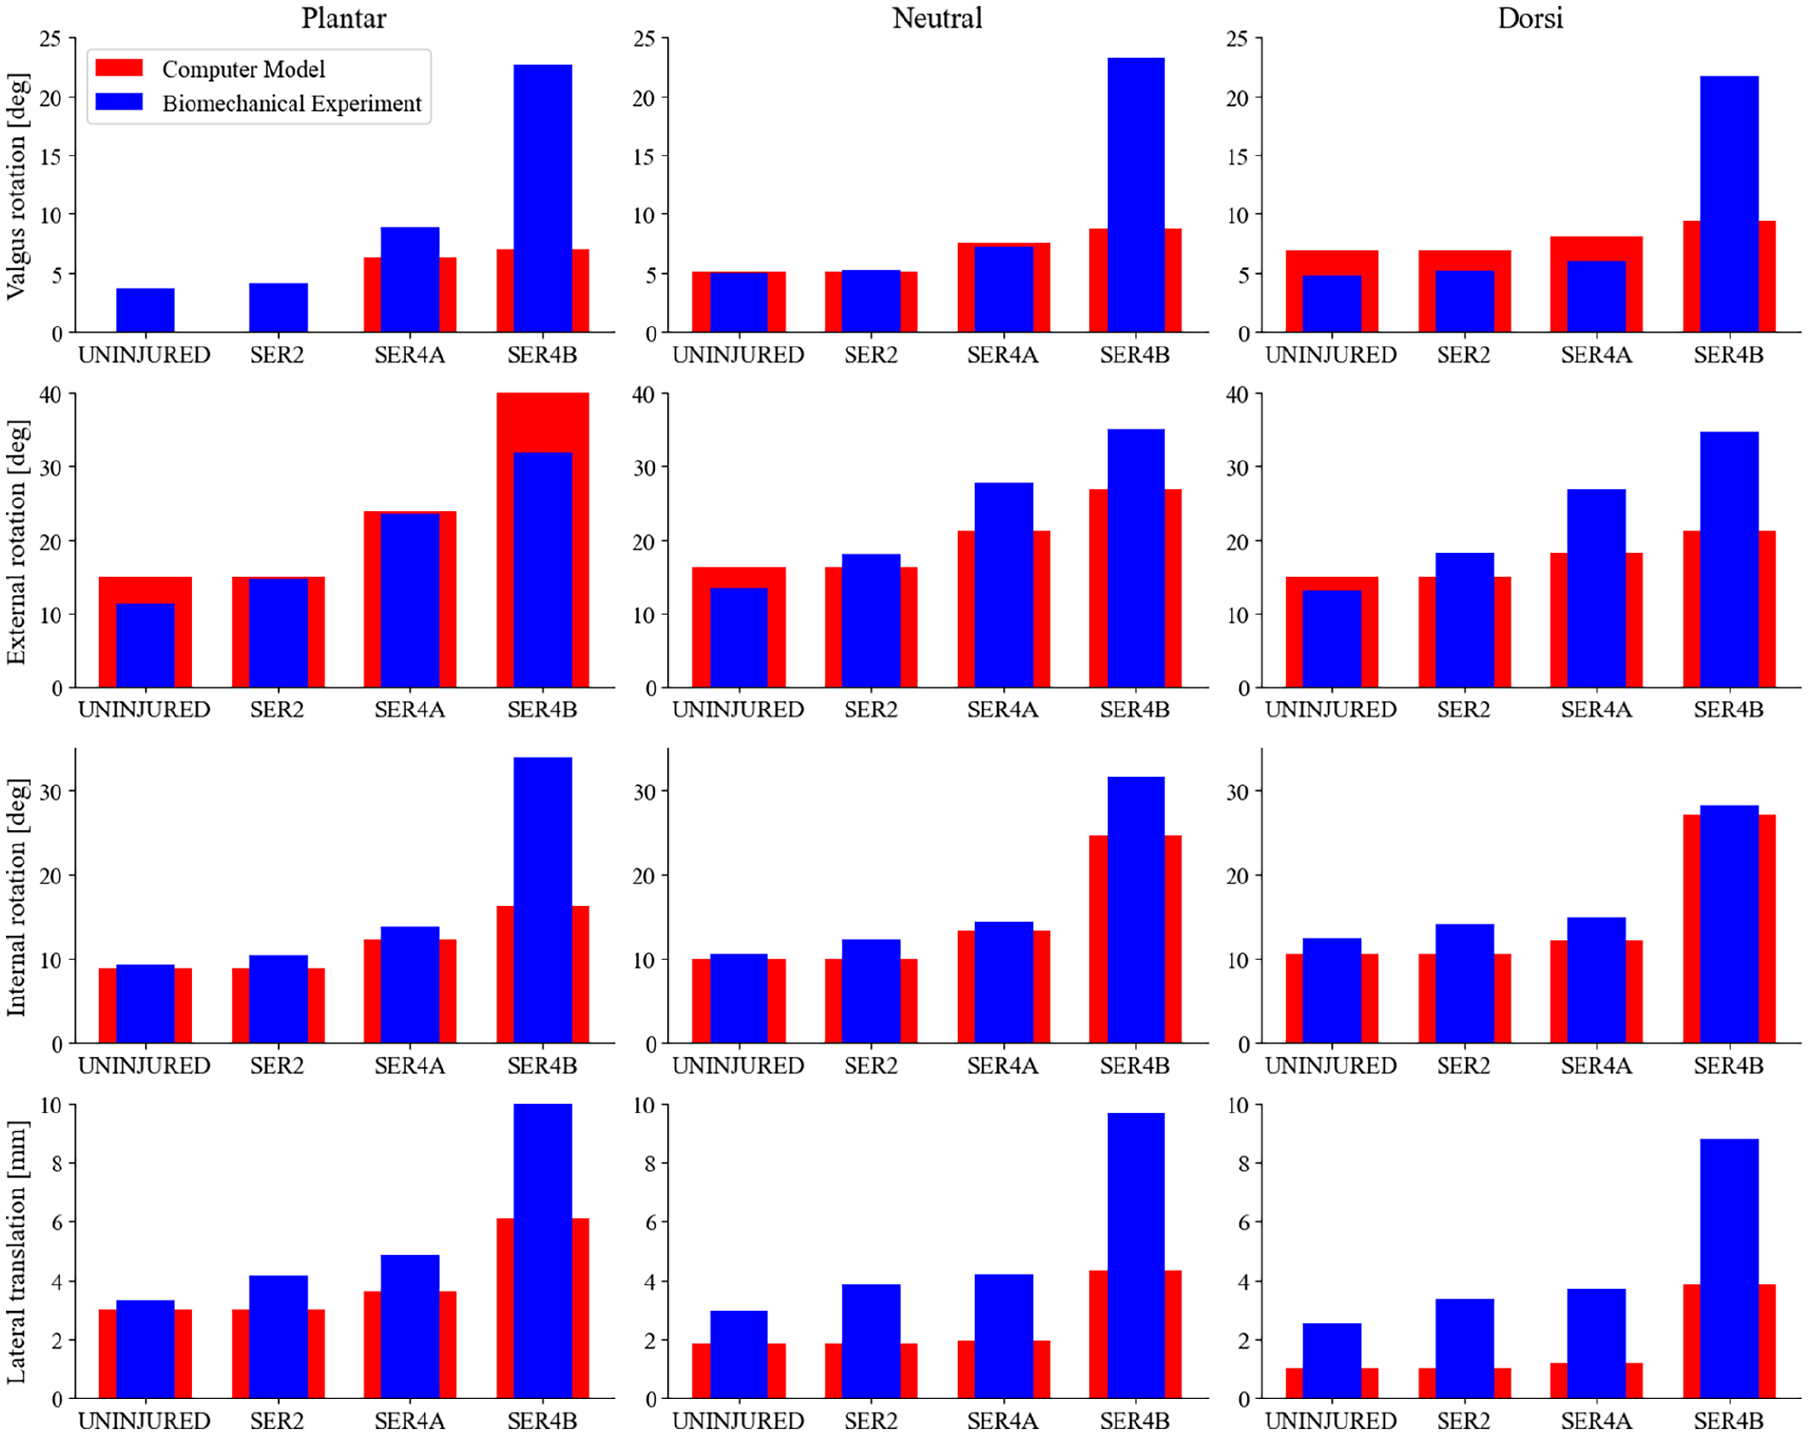
Comparison of rotation and talar shift between the injured computer model and the biomechanical data. In each graph, the X-axis displays the test conditions, including the uninjured state, SER2, SER4a, and SER4b, whereas the Y-axis represents the rotation in degrees or the displacement in meters for the MCS. Each column corresponds to tests under different flexion states, and each row indicates various tests: valgus, external rotation, internal rotation moments, and the lateral translation test, arranged from top to bottom. The blue columns represent the biomechanical data, whereas the red columns illustrate the results from the computer model.
RMSEs Between the Computer Model and Experimental Biomechanical Data for the Progressive Ligament Injury Models in Valgus, External Rotation, Internal Rotation, and Lateral Translation Tests.

Abbreviation: RMSE, root mean square error.
Ligament Tension
The tension in the deep posterior tibiotalar ligament (DPTTL) was measured for each injury stage (Figure 7). The results showed that DPTTL tension increased significantly between the SER2 and SER4a stages across all tests. There was no measurable difference in DPTTL tension between the native (uninjured) and SER2 stages in the computer model.
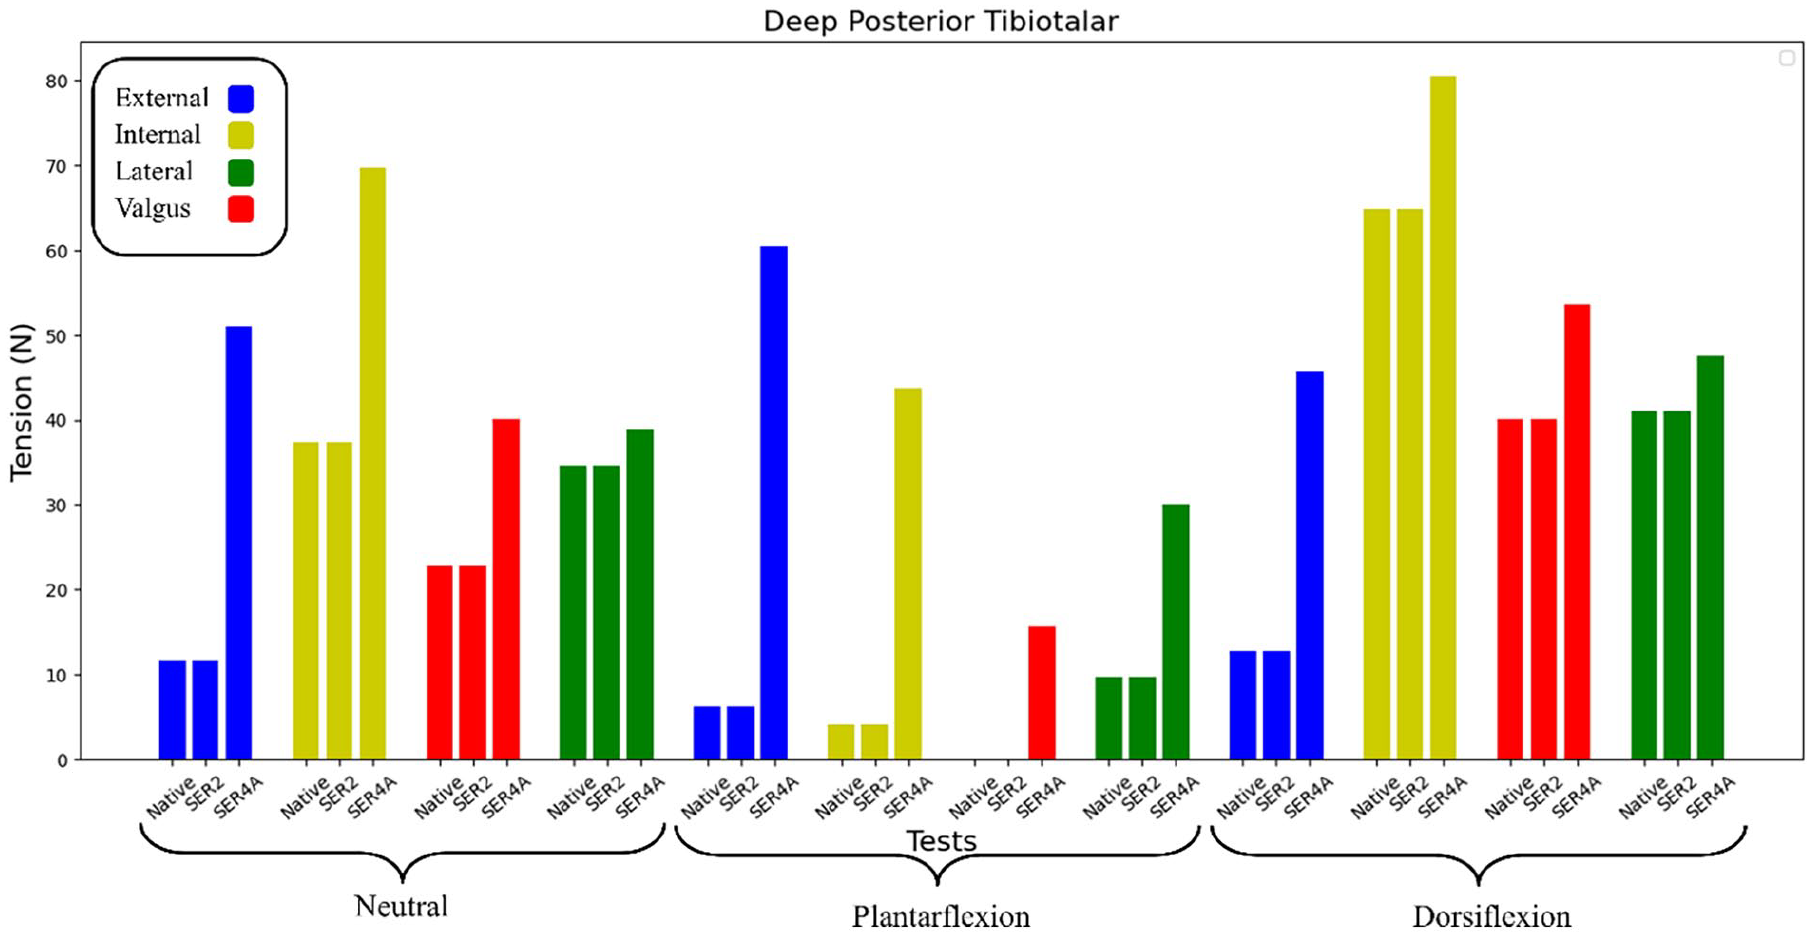
DPTTL tension during the stages of SER injury as predicted by the computer model. The tests were categorized into 3 brackets—neutral, plantar flexion, and dorsiflexion—representing the flexion states of each test. Blue, yellow, red, and green indicate external rotation, internal rotation, lateral force, and valgus rotation, respectively. Lastly, each of the 3 columns displays the results of one test as it progresses to the SER2 and SER4a stages.
Discussion
This study validates a pilot computer simulation model for assessing ligament strain during rotational ankle injuries. By incorporating biomechanical data on uninjured ankle stability, the model accurately predicts stability changes following ligament removal, which corresponds to the SER2-SER4b injury stages. The strong correlation between the simulation results and cadaveric data confirms the model’s validity and indicates its utility for understanding ligament behavior in this context. Unlike previous models, this simulation integrates force-dependent kinematics, enabling multi-DOF movement that more accurately mimics in vivo biomechanics.
A key advantage of computer simulations is their ability to control and manipulate variables and test conditions that are challenging to study in live tissue. This study demonstrates the potential of computer models to offer unique insights into ligament strain caused by rotational ankle injury mechanisms—insights that would be unattainable through traditional experimental methods.
Clinical Relevance
This initial validation of a simulation model offers a novel platform for generating hypotheses and refining study designs for future in vitro and in vivo research. By providing detailed insights into ligament behavior during ankle injuries, such models may bridge gaps in current knowledge regarding injury sequences, which enhances injury detection and has the potential to inform the development of more effective treatment strategies. Although the biomechanical data used for model validation offers valuable insights, several limitations must be acknowledged. The experiments were performed on cadaveric specimens with inherent variability in bone quality, soft tissue condition, and ligament laxity, which may not fully reflect an in vivo situation. Additionally, the loading conditions in the laboratory setting may not replicate physiological stresses encountered during daily activities. These factors may influence both the accuracy and clinical applicability of the results, and should be considered when interpreting the findings. Another key limitation of this study is that the computer model did not include a simulated fibular fracture, whereas the cadaver experiments used for validation did. This discrepancy may limit the ability of the model to fully replicate the mechanical behavior of SER-type injuries. However, the experimental data suggest that the fibular fracture itself may play a limited role in contributing to overall instability, except during external rotation, where the effect may largely stem from concomitant anterior-interior tibiofibular ligament rupture. The fact that the model produced results closely resembling those of the cadaver experiments, despite the absence of a fracture, may indicate that ligamentous injury is the dominant driver of instability in these injury stages. Nonetheless, this assumption should be interpreted with caution, and future model refinements could benefit from incorporating fracture simulation for improved anatomical accuracy. In addition, no data on the healed state of ligaments or their effects on joint contact forces were modeled, limiting direct clinical translation.
Model Limitations and Future Directions
Despite its strengths and potential, the existing computer model has limitations that need to be addressed to enhance its alignment with real-world clinical scenarios. Currently, the computer model does not adapt dynamically to ligament ruptures. Future iterations should incorporate dynamic features to better capture the progressive effects of these injuries and their impact on surrounding structures.
The biomechanical data were derived from cadaveric studies where a robotic arm manipulated the tibia. Because the forces exerted by the robotic arm directly influence the tibia, this setup could introduce inaccuracies in talocrural joint stiffness. Future studies should concentrate on minimizing this effect by precisely measuring and accounting for the robotic forces.
The lack of data regarding the movements of each bone segment creates numerous possibilities for how these bones can interact with one another. To address this challenge, we can carefully establish design constraints based on existing literature, an approach that could be considered for future model versions. However, the ideal solution would be to obtain specific data on bone movements to eliminate this issue. Future studies should incorporate motion-capture techniques or validated constraints from existing research to tackle the absence of precise bone movement data.
As shown in Figure 6, the simulation underestimated displacements and rotations for the SER4b ligament injury models. This can be explained by the linear stiffness models implemented for calculating the FDK forces, which were calibrated for the uninjured state and thus best represent that region. We hypothesize that as joint displacements increase in ligament injury models, nonlinear dynamic effects arising from bone congruence and ligament behavior become increasingly relevant. This highlights a limitation of the current model. Large-displacement accuracy could be improved by fitting parameters to a nonlinear quadratic FDK stiffness model.
Another challenge arises from the limited anatomical data available for the deltoid ligament complex, which includes the TCL, TNL, DATTL, and TSL ligaments. The variability in ligament dimensions and cross-sectional areas among individuals complicates the development of a generalized model. Additionally, this limitation also extends to ligament material assumptions, which were inferred from geometric properties and may not reflect subject-specific variability. However, despite this limitation, a generalized framework can still serve as a foundation for creating subject-specific models. Although ligament data are limited, integrating artificial intelligence and machine learning could help address this issue and improve predictions. Future iterations should incorporate dynamic rupture simulations, fibular fractures, and more refined ligament parameters.
Conclusions
This study introduces and validates a pilot biomechanical simulation model for rotational ankle injuries. It offers a new tool for examining ligament biomechanics and injury mechanisms.
Supplemental Material
sj-pdf-1-fao-10.1177_24730114251356497 – Supplemental material for A Pilot Validation Study of a Biomechanical Simulation Model for Rotational Ankle Injuries Using Robotic Cadaveric Testing
Supplemental material, sj-pdf-1-fao-10.1177_24730114251356497 for A Pilot Validation Study of a Biomechanical Simulation Model for Rotational Ankle Injuries Using Robotic Cadaveric Testing by Mohammad Amin Shayestehpour, Martin G. Gregersen, Ola Saatvedt, Øystein Bjelland and Marius Molund in Foot & Ankle Orthopaedics
Footnotes
Supplementary Data
Optimized Joint Stiffness Values for Talocrural and Subtalar Joints. a

| Optimization Parameter | Description | Optimized Value | Unit |
|---|---|---|---|
| Talocrural joint rotation Y | Talocrural rotational stiffness in local Y axis | 38.26 | N/radian |
| Talocrural joint rotation X | Talocrural rotational stiffness in local X axis | 0.00 | N/radian |
| Talocrural joint linear X | Talocrural translational stiffness in local X axis | 5403.54 | N/mm |
| Talocrural joint linear Z | Talocrural translational stiffness in local Z axis | 10 000.0 | N/mm |
| Subtalar joint rotation Z | Subtalar rotational stiffness in local Z axis | 2623.91 | N/radian |
| Subtalar joint rotation Y | Subtalar rotational stiffness in local Y axis | 301.73 | N/radian |
| Subtalar joint rotation X | Subtalar rotational stiffness in local X axis | 3986.59 | N/radian |
| Subtalar joint linear X | Subtalar translational stiffness in local X axis | 1943.75 | N/mm |
| Subtalar joint linear Z | Subtalar translational stiffness in local Z axis | 10 000.0 | N/mm |
The joint stiffness of talocrural and subtalar joints as well as the ligament strength coefficient identified in the model.
Ethics Approval
Ethical approval for this study was obtained from the Regional Committees for Medical and Health Research Ethics in Norway, reference number 178067.
Declaration of Conflicting Interests
The author(s) declared no potential conflicts of interest with respect to the research, authorship, and/or publication of this article. Disclosure forms for all authors are available online.
Funding
The author(s) disclosed receipt of the following financial support for the research, authorship, and/or publication of this article: This study was funded by the Østfold Hospital Trust and the South-Eastern Norway Regional Health Authority (grant 2023014).
References
Supplementary Material
Please find the following supplemental material available below.
For Open Access articles published under a Creative Commons License, all supplemental material carries the same license as the article it is associated with.
For non-Open Access articles published, all supplemental material carries a non-exclusive license, and permission requests for re-use of supplemental material or any part of supplemental material shall be sent directly to the copyright owner as specified in the copyright notice associated with the article.