
Abstract
Background:
Hallux valgus (HV) is a common forefoot deformity that often leads to foot pain and functional limitations, requiring surgical intervention when conservative treatments fail. Tarsometatarsal arthrodesis is a widely used procedure for severe HV deformities, with plantar plate fixation demonstrating superior biomechanical outcomes. However, the biomechanical equivalence of different plantar plate designs remains unclear. Specifically, there is a lack of biomechanical studies comparing how design variations affect load distribution, durability, and the risk of material failure postoperatively. This study aims to address this gap by evaluating the biomechanical performance of 2 commonly used plantar plate designs.
Methods:
This study involved a biomechanical analysis of 2 widely used plantar Lapidus plating designs: U-shaped plates and straight-shaped plates. A total of 20 fresh frozen cadaveric feet from 10 donors were included. The plates were assigned randomly to each specimen, and tarsometatarsal arthrodesis was performed according to the manufacturers’ guidelines. Mechanical testing was conducted using a universal testing machine, focusing on cyclic loading and maximum load capacity to assess the mechanical stability of each system. Cyclic loads were systematically applied in 4 increments, culminating in a ramp test to ascertain the maximum load to material failure.
Results:
Both the U-shaped and the straight-shaped plantar Lapidus plates demonstrated commendable mechanical stability under cyclic loading, with nearly no significant differences in stiffness across the 4 cyclic loading force cycles. In the maximum load capacity test, the straight-shaped plate showed a higher mean load capacity (540.6 N, SD = 36.09) compared with the U-shaped plate (446.6 N, SD = 91.32), with a statistically significant difference (P = .03) and a large effect size (Cohen d = 1.56).
Conclusion:
This biomechanical study demonstrated that both U-shaped and straight-shaped plantar Lapidus plating systems provided comparable mechanical performance under stepwise cyclic loading conditions. The straight-shaped plates showed a higher failure rate during cyclic loading but achieved a significantly greater maximum load capacity in the final load-to-failure test. In contrast, the U-shaped plates were more consistent under repeated loading, suggesting potential advantages in fatigue resistance. These findings may reflect a trade-off between repetitive load endurance and maximum load-bearing capacity. Although these results offer biomechanical insight into the design-specific behavior of 2 commonly used plantar plating systems, their clinical relevance should be interpreted with caution, given the limitations of cadaveric testing, the absence of biological bone healing, and small sample sizes. Further clinical and long-term outcome studies are needed to confirm whether the observed mechanical differences translate into meaningful differences in patient function or fusion success.
Level of Evidence:
Level V, preclinical biomechinal study.
Introduction
Hallux valgus (HV) is one of the most prevalent forefoot deformities, characterized by the lateral deviation of the proximal phalanx and the medial deviation of the first metatarsal head, often accompanied by metatarsus primus varus. 7 Although the precise biomechanical etiology of HV remains incompletely understood, various predisposing factors contribute to its development, including anatomical differences, ligamentous laxity, shoe choice, and increased first ray hypermobility, particularly in women. 14 Additionally, the prevalence of HV increases with age, attributed to age-related alterations in joint mechanics and plantar loading patterns.17,18 Other contributing factors include pes planus, Achilles tendon contractures, and metatarsal length.2,7,13,15
The functional impairment caused by HV often leads to foot pain and significant limitations in mobility, 1 making surgical intervention necessary when conservative treatments fail or when the deformity results in substantial disability. 6 Tarsometatarsal arthrodesis is a widely accepted approach for moderate to severe HV deformities, offering excellent clinical, radiologic, biomechanical, and pedobarographic outcomes.8,10,12,18 Plantar plate fixation has emerged as a superior osteosynthesis method, enabling early protected weightbearing, a key component of postoperative recovery that allows patients to resume activity while the joint heals.1,3,5,9 However, there remains a gap in the literature regarding the biomechanical comparison of different plate designs, particularly in terms of their effect on load distribution, durability, and the risk of material failure. 4
To address this issue, we conducted a biomechanical comparative analysis of 2 widely used plantar Lapidus plating systems: the U-shaped plate design from Arthrex (Plantar Lapidus Plate; Arthrex, Naples, FL) and the straight plate design from Wright Medical (Darco Plantar Lapidus Plating System; Wright Medical, Memphis, TN). The primary objective of this study was to evaluate the biomechanical equivalence of these systems, particularly in terms of their load-bearing capacity. Given the distinct structural differences between the U-shaped plate and the straight-shaped plate, this study aimed to determine how these design differences may influence their mechanical performance and durability under load, thereby providing deeper insight into the optimal choice of plantar plating system for first tarsometatarsal joint arthrodesis.
Patients and Methods
A total of 20 fresh frozen cadaveric feet (10 left, 10 right) from 10 body donors were included in this study. The body donors granted informed consent for the use of their bodies or portions thereof for the advancement of research. The agreement was proven by the ethics committee of the Medical Faculty. None of the specimens displayed any indications of prior surgical interventions on the foot that would necessitate exclusion from the study. The mean age of the body donors was 86 (range 77-97) years. The allocation of the U-shaped (Arthrex) or straight-shaped (Wright Medical) plate to each specimen was performed using a computer-generated randomization schedule. Note that plate types were not systematically paired to contralateral limbs of the same donor (ie, not matched left vs right within donors), but rather assigned independently to each foot. This approach was intended to avoid potential bias introduced by side dominance or anatomical asymmetry between limbs, even within the same individual. The first metatarsal, medial cuneiform, and navicular bones were resected en bloc, with the ligaments and joint capsule preserved to maintain anatomical integrity. 19 Subsequently, the arthrodesis was conducted in accordance with the manufacturers’ guidelines, employing a plantar plate placement at the first tarsometatarsal joint. Figure 1 illustrates the specimen positioning and technical setup in the testing machine using a straight-shaped plate.

Specimen positioning and technical setup in the testing machine using a straight-shaped plate.
The respective plates were secured using screws provided by the manufacturers. The length of the screws was determined after bicortical drilling using a depth gauge. The preformed plates were not manually contoured. The instrumentation was performed by a senior foot and ankle surgeon. To ensure consistent cantilever conditions, all specimens were mounted with a standardized moment arm length. The distance between the proximal embedding block and the load application point at the plantar metatarsal head was kept constant across all specimens using a custom positioning jig and reproducible anatomical reference points. Correct positioning of the implants was subsequently confirmed through conventional radiographic imaging. All specimens were subjected to bone densitometry (DXA). No relevant deviations in the implant positioning or in bone density has been registered between the groups.
For biomechanical testing, a universal servo-hydraulic testing machine (Z010, Zwick Roell, Ulm, Germany; load cell 100 kN) was employed in sinusoidal cyclic compression load control modus at a rate of 1 Hz. The channel’s force, distance, and time were registered. The biomechanical evaluation was conducted according to a standardized protocol previously used in similar testing configurations by other authors. 15 The load was applied as axial compression through the plantar head of the first metatarsal. The specimens were fixed in the testing apparatus in a bottom-up configuration in a dorsoplantar position, ensuring physiological load bearing of the construct with the bending moment as the primary load. Initially, the specimens were preconditioned with a force of 25-50 N over 20 cycles. This was followed by cyclic loading at 4 different primary loading levels. The first cyclic load was applied for 50 cycles between 50 and 150 N, the second for 50 cycles between 100 and 200 N, the third for 50 cycles between 150 and 250 N, and the fourth for 50 cycles at 200 and 300 N. Each specimen was subjected to the next higher load level only if no material failure of the plate system occurred. Material failure was defined as a sudden drop in the load-displacement curve. The bending stiffness of each specimen was determined from the resulting load-displacement diagram. Finally, the remaining specimens were tested to failure, starting with a load ramp of 20 N, progressing to failure in dorsiflexion. In this portion of the protocol, the maximum load to material failure was assessed. Throughout the testing procedures, efforts were made to keep the specimens moist. Importantly, the ramp-to-failure test was conducted even in specimens that had experienced considerable plastic deformation during cyclic loading, with displacements exceeding 10 mm in some cases. This portion of testing reflects nonphysiological, worst-case mechanical conditions and is intended to assess residual strength of the constructs.
The bending stiffness after preconditioning was evaluated for each of the 4 primary loading levels by analyzing the slope of the load-displacement curve within the quasi-linear elastic region during the respective cyclic stage. This region was identified based on the consistent, near-linear response observed in the loading portion of the cycle, prior to any indication of permanent deformation or plastic displacement. Thus, the term “stiffness” as used in this study refers to the elastic behavior of the construct under repetitive loading, and not to time-dependent creep. Figure 2 illustrates the testing protocol for cyclic loading at these four primary levels.

Example of the graphical progression of the load curve for a straight-shaped plate during cyclic loading. The next higher load level was applied only if no material failure of the plate system occurred. y = standard force in newtons; x = displacement in millimeters.
The maximum load to material failure was determined based on the displacement progression observed during the ramp test. Figure 3 presents an example of the testing protocol used to assess the maximum load leading to material failure.
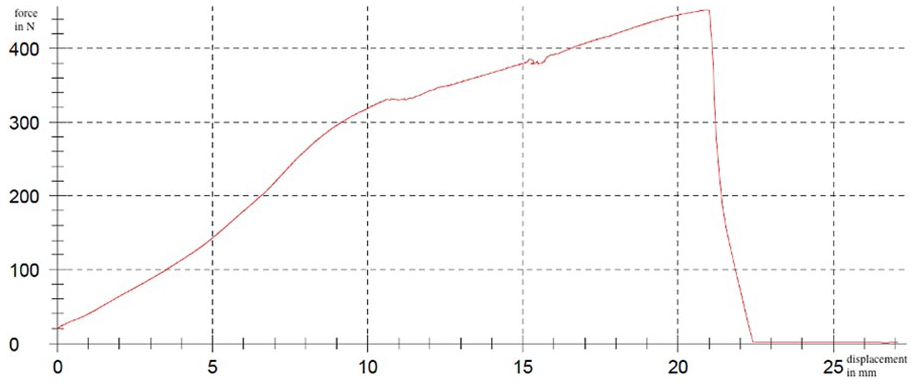
Example of the graphical progression of the load curve for a straight-shaped plate during maximum load. y = standard force in newtons; x = displacement in millimeters.
Statistical analysis was conducted using the SPSS software package (IBM SPSS Statistics 27; IBM Corp, Armonk, NY).
The statistical tests conducted to evaluate comprehensive analysis of the mechanical performance of the 2 plate systems during 4 distinct force cycles included the following: normality was assessed using the Kolmogorov-Smirnov test, with the Lilliefors correction applied when necessary, and the Shapiro-Wilk test provided an additional measure of normality, particularly for smaller sample sizes. Levene’s test for equality of variances was performed to determine if the variances of the 2 groups were equal, assessing both means and medians to ensure robustness in the results.
Descriptive statistics were calculated for each plate system across the different force cycles, including sample size (n), mean (M), SD, and SE of the mean. Independent samples t tests were used to compare the means of the 2 plate systems within each force cycle, with the assumption of equal variances evaluated through the Levene test. Two-tailed t tests were conducted to identify statistically significant differences between the groups. Effect sizes, calculated as Cohen d, quantified the magnitude of differences observed between the plate systems, with interpretations categorized as small (0.2), medium (0.5), and large (0.8). Statistical significance was defined at the 5% level (P < .05).
For the failure analysis, the Kaplan-Meier survival curve was used. Only specimens that successfully completed cyclic loading and entered the ramp-to-failure test were included in this analysis. Constructs that failed during cyclic loading were excluded. The Pearson correlation revealed the relationship between the stiffness of the osteosynthesis and bone density of the specimens. The log rank test was applied to compare the survival curves.
Results
Cyclic Loading
The results of the mechanical performance testing for both plate systems across the 4 force cycles are summarized in Table 1 and Figure 4. Construct survival after each cyclic loading stage is presented in Table 2. A detailed breakdown of failure modes for each individual plate is provided in Table 3.
Mechanical Performance Statistics of the Straight-Shaped and U-Shaped Plate Systems Across the 4 Different Cyclic Force Cycles.


Mechanical performance statistics of the straight-shaped (green) and U-shaped (red) plate systems across the 4 different force cycles. y = standard force in newtons.
Summary of the number of constructs remaining after completion of each cyclic loading phase, separated by plate type. a

The table indicates the cumulative survival of the constructs and the number of mechanical failures observed at each force level.
Detailed Overview of Individual Construct Failures During Cyclic Loading, Including the Corresponding Force Level, Plate Type, Plate Number, and Failure Mode.

Normality tests
For force cycle 1, normality testing revealed that both the straight-shaped and U-shaped plates displayed a normal distribution, as indicated by the Kolmogorov-Smirnov and Shapiro-Wilk tests (P values > .05). In force cycle 2, similar tests confirmed normal distribution for both plates. For force cycle 3, the Kolmogorov-Smirnov statistic for the straight-shaped plate was 0.24 (P = .615), and for the U-shaped plate, it was 0.16 (P = .950), affirming normality. Finally, in force cycle 4, both plates also showed normal distribution, with Kolmogorov-Smirnov statistics of 0.18 (P = .939) for the straight-shaped plate and 0.26 (P = .589) for the U-shaped plate.
Levene’s test for equality of variances
In force cycle 1, Levene’s test yielded a P value of .188, confirming equal variances between the groups. However, in force cycle 2, Levene’s test produced a significant P value of .01, leading to the rejection for equal variances. For force cycle 3, the P value was .079, indicating variance equality. In force cycle 4, the P value was .894, further confirming equal variances.
Independent samples t test
An independent samples t test for force cycle 1 showed no statistically significant stiffness difference between the 2 plates, with t = −0.66, P = .52. The results indicated that the straight-shaped plate had a mean of 53.67 N/mm (SD = 13.71) and the U-shaped plate had a mean of 48.16 N/mm (SD = 21.49). In force cycle 2, the t test indicated a near-significant difference between the plates, with t = −2.12 and P = .058. The means were 91.94 N/mm (SD = 8.74) for the straight-shaped plate and 75.38 N/mm (SD = 21.70) for the U-shaped plate. For force cycle 3, the t test again showed no significant difference, with t = −1.57, P = .136. The means for this cycle were 103.79 N/mm (SD = 15.99) for the straight-shaped plate and 86.94 N/mm (SD = 27.95) for the U-shaped plate. Finally, in force cycle 4, the t test indicated no significant difference, with t = −0.30, P = .772. The mean for the straight-shaped plate was 99.28 N/mm (SD = 39.99), whereas the mean for the U-shaped plate was 93.39 N/mm (SD = 36.77).
Effect size
The effect size for force cycle 1 was calculated to be 0.3, indicating a small effect. For force cycle 2, the effect size was found to be 1, denoting a large effect. In force cycle 3, the effect size was 0.74, suggesting a medium effect. Finally, for force cycle 4, the effect size was calculated at 0.15, indicating a very small effect.
Maximum Load Capacity
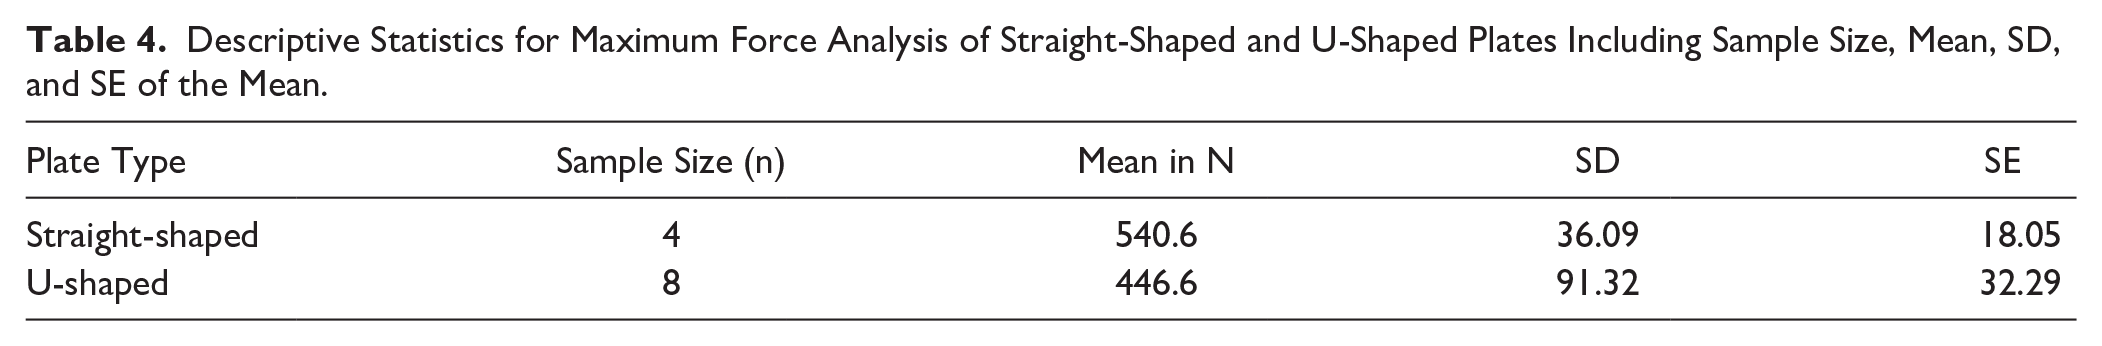
For the analysis of the maximum load capacity, only 4 straight-shaped plates and 8 U-shaped plates could be used. This limitation was due to prior instances of sample displacement in the universal testing machine or material failures, which affected the availability of intact specimens and plates for testing. The failures were primarily attributed to screw loosening, with some instances of bone fracture occurring at the screw-bone interface. The biomechanical results during the maximum load capacity are presented in Table 4 and Figure 5.
Descriptive Statistics for Maximum Force Analysis of Straight-Shaped and U-Shaped Plates Including Sample Size, Mean, SD, and SE of the Mean.

Kaplan-Meier survival curve for maximum load capacity of both plate systems. Shaded regions indicate the 95% CIs. Note: Only specimens that successfully completed all cyclic loading phases were included; constructs failing during cyclic loading were excluded from this analysis.
The descriptive statistics indicate that the straight-shaped plates exhibited superior values for maximum load, with a mean of 540.6 N (SD = 36.09), compared with the U-shaped plate, which achieved a mean of 446.6 N (SD = 91.32). An independent samples t test was conducted, which revealed a t value of 2.54 with a P value of .03. The effect size, as measured by Cohen d, was calculated to be 1.56, indicating a large effect.
No correlation was registered between the bone density and stiffness in the straight-shaped plate group. A moderate correlation (r = 0.7) was registered in the U-shaped group. The posttest analysis of the fluoroscopy imaging revealed no significant secondary dislocation of the implants.
Discussion
For a long time, screw fixation was the most commonly used technique for Lapidus arthrodesis and continues to be an accepted method. 20 However, with the development of specialized angle-stable plating systems, plate fixation is gaining increasing importance in the treatment of this condition. 9 The advantages of plantar plate positioning have also been confirmed in several clinical studies11,15,19 and is in accordance with the AO principles, 16 leading to considerable biomechanical advantages in performing a first tarsometatarsal joint arthrodesis. In the present analysis, we compared the performance of the U-shaped and straight-shaped plating systems under cyclic loading and maximum load conditions, specifically examining how the design variations might influence their mechanical behavior and stability. The findings, summarized in Tables 1 and 2, indicate that although both plating systems exhibited robust mechanical properties, the observed differences were relatively small.
Mechanical Performance Under Cyclic Loading and Maximum Load Capacity Analysis
The results from our cyclic loading tests revealed that both the U-shaped and the straight-shaped plates performed comparably across the 4 force cycles. Although the U-shaped plates demonstrated slightly higher mean values in certain cycles, these differences were not statistically significant. This suggests that both systems provide sufficient stability to withstand the physiological loads typically encountered in postoperative settings. Following completion of cyclic loading, maximum load testing was conducted on the remaining specimens. However, it must be acknowledged that the comparison of maximum load capacities was underpowered because of the small and unequal sample sizes between groups. Therefore, the findings from this part of the analysis should be considered exploratory. Although the straight-shaped plates demonstrated a higher failure rate during cyclic loading compared with the U-shaped plates, they ultimately exhibited a greater maximum load capacity. This may appear contradictory at first but can be explained by differences in construct behavior under progressive loading. It is important to note that some specimens displayed considerable plastic deformation during cyclic testing, with permanent displacements exceeding 10 mm. Although such deformation would not represent a desirable clinical outcome, maximum load testing was deliberately performed to assess the constructs’ residual strength under extreme, nonphysiological conditions. These results should not be interpreted as predictors of clinical outcomes or implant survivorship, but rather provide insight into mechanical robustness in rare but critical scenarios, such as delayed union, nonunion, or persistent mechanical loading.
One possible explanation for the observed load-to-failure differences lies in the structural characteristics of the 2 plate types. The straight-shaped plates may be more susceptible to localized stress concentrations during repeated loading, potentially contributing to earlier failure in the cyclic tests. However, once they progress beyond the cyclic phase, their greater stiffness may confer an advantage in resisting peak loads in the subsequent failure test. Conversely, the broader distribution of stress through the curved geometry of the U-shaped plates might enhance their resilience to repetitive loading, reducing early failure but limiting ultimate load-bearing capacity.
However, their ability to handle extreme peak loads may be limited, potentially resulting in a lower maximum load capacity compared with the straight-shaped plates. It is important to note that 8 U-shaped plates successfully made it to the maximum load testing phase, whereas the straight-shaped group had only 4 plates available for this phase. This difference in sample size for the maximum load testing should be considered, as it increases the statistical variability and the likelihood of encountering outliers or weaker specimens in the straight-shaped group. This variability could contribute to the higher failure rate observed during cyclic loading, while the remaining straight-shaped plates that survived this phase were able to withstand higher peak loads, leading to the observed higher mean maximum load. In conclusion, although the straight-shaped plates exhibited a higher failure rate during cyclic loading, their design stiffness likely allowed them to endure greater peak loads when tested to failure. In contrast, while the U-shaped plates showed consistent performance during cyclic loading, their design may have limited their ability to handle extreme forces in the maximum load test. This might highlight a potential trade-off between the ability to withstand repetitive loading and the capacity to resist high, single-instance loads, which could influence clinical decisions when selecting the appropriate plate system.
Clinical Implications
The findings of this study have important clinical implications for the choice of plantar Lapidus plating systems, particularly regarding their performance under cyclic loading and maximum load conditions. Despite the higher failure rate of the straight-shaped plates during cyclic loading, their ability to achieve a significantly higher maximum load capacity suggests that these plates may offer advantages in situations where high, single-instance loads are encountered. This could be particularly relevant for patients who engage in high-impact activities or those who are at risk for higher peak forces on the first ray, such as athletes or individuals with significant weightbearing requirements. The increased rigidity of the straight-shaped plate may provide enhanced stability under these circumstances, potentially reducing the risk of late-stage implant failure under peak loading conditions.
In contrast, the U-shaped plates, with their more flexible design, showed slightly better performances during cyclic loading, indicating that they may offer superior resilience in the long term under repetitive stress. This could be advantageous for patients with less demanding postoperative activity levels or those at risk for prolonged loading over time, as the plates appear less prone to early failure during routine, repetitive movements. The ability of the U-shaped plate to maintain stability through cyclic loading could provide more predictable outcomes for patients who may not require the load-bearing capabilities of the straight-shaped plate.
It is important to consider that the differences in maximum load capacity and failure rates observed between the 2 systems could be influenced by various factors, such as patient-specific anatomical variations and the potential for different loading patterns postoperatively. Therefore, surgeons should take into account both the design characteristics of the plates and the individual needs of their patients when selecting the appropriate plate system. For patients with higher functional demands or those at risk for acute overload, the straight-shaped plate might be the preferable option. Conversely, for patients with lower functional activity levels or a higher risk of repetitive stress, a U-shaped plate may be a more suitable choice.
Ultimately, both the straight-shaped and U-shaped plates demonstrated comparable mechanical performance in this cadaveric model, suggesting potential mechanical viability for clinical use. Although subtle biomechanical differences were observed, the clinical implications of these findings remain uncertain, and both plating systems appear mechanically capable of supporting first tarsometatarsal arthrodesis under the tested conditions. Moreover, although subtle biomechanical differences were observed, both plating systems appear mechanically capable of supporting tarsometatarsal arthrodesis under the tested conditions. However, a number of limitations should be acknowledged in the present study.
This investigation was conducted as a pilot study using cadaveric specimens. Because of feasibility constraints and limited specimen availability, no a priori power analysis was performed, and sample sizes were modest. As a result, findings should be considered exploratory and interpreted cautiously. Further studies with larger and adequately powered sample sizes are necessary to confirm these observations.
The use of cadaveric specimens, while providing a relevant model for biomechanical testing, may not fully replicate the biological conditions of living human tissue, particularly regarding bone quality, joint kinematics, and healing responses.
Furthermore, the advanced mean age of the cadaveric donors (86 years) represents an important limitation regarding the generalizability of our results. Age-related changes such as decreased bone mineral density, alterations in trabecular microarchitecture, increased cortical porosity, and degeneration of joint-supporting soft tissues may have influenced the mechanical behavior of the constructs. These factors could potentially lead to lower load-bearing capacity or different failure patterns compared with a younger or middle-aged patient population typically undergoing hallux valgus correction. As a result, caution should be exercised when extrapolating these biomechanical findings to clinical settings involving younger patients with generally higher bone quality and tissue resilience.
The relatively small sample size in some groups, especially during the maximum load testing phase, could have contributed to variability in the results and may limit the generalizability of the findings.
Additionally, the lack of systematic measurement of permanent displacement after cyclic loading represents a limitation, restricting the ability to characterize plastic deformation before ramp-to-failure testing.
Furthermore, the absence of long-term follow-up data on the clinical outcomes of the tested plate systems means that the effects of these biomechanical differences on implant survival and patient functionality remain uncertain. Lastly, although the study focused on 2 specific plate designs, multiple additional factors—such as variations in surgical technique, postoperative rehabilitation protocols, and patient-specific anatomical differences—may influence the clinical success of plantar Lapidus arthrodesis. Further prospective studies with larger sample sizes and long-term clinical follow-up are needed to confirm and expand on these findings.
Supplemental Material
sj-pdf-1-fao-10.1177_24730114251342799 – Supplemental material for Biomechanical Comparison of Two Plantar Lapidus Plating Systems
Supplemental material, sj-pdf-1-fao-10.1177_24730114251342799 for Biomechanical Comparison of Two Plantar Lapidus Plating Systems by Felix Werneburg, Maria Felsberg, Juliane Beschauner, Christin Arnold, Darius Arbab, Heike Kielstein, Alexander Zeh, Karl-Stefan Delank and Natalia Gutteck in Foot & Ankle Orthopaedics
Footnotes
Ethical Approval
Ethical approval for this study was obtained from the Ethics Committee of the Medical Faculty of Martin Luther University Halle-Wittenberg.
Declaration of Conflicting Interests
The author(s) declared the following potential conflicts of interest with respect to the research, authorship, and/or publication of this article: Christin Arnold, MD, reports provision of the universal testing machine and performance of the load tests as well as delivery of the results data (force-displacement diagrams, numerical values from the Testexpert software). Natalia Gutteck, MD, reports general disclosures as consultant for educational courses organized and conducted by Arthrex Company. Disclosure forms for all authors are available online.
Funding
The author(s) disclosed receipt of the following financial support for the research, authorship, and/or publication of this article: The authors acknowledge the financial support of the Open Access Publication Fund of the Martin-Luther-University Halle-Wittenberg.
References
Supplementary Material
Please find the following supplemental material available below.
For Open Access articles published under a Creative Commons License, all supplemental material carries the same license as the article it is associated with.
For non-Open Access articles published, all supplemental material carries a non-exclusive license, and permission requests for re-use of supplemental material or any part of supplemental material shall be sent directly to the copyright owner as specified in the copyright notice associated with the article.