
Abstract
Background:
Orthopaedic patients’ expectations for surgical treatment are often disparate compared with those of their surgeon. There is increasing interest in assessing and understanding patient preoperative expectations and their potential association with postoperative satisfaction. Previous literature has found several predictors of patient-provider discrepancies in expectations for elective orthopaedic surgery, although no studies have included patients undergoing surgery for traumatic injuries. The aim of this study was to determine if there are differences in expectations between patients undergoing elective vs nonelective foot and ankle surgeries.
Methods:
A prospective study of adult foot and ankle patients was performed over 6 months (October 2023–March 2024). At the time of preoperative evaluation, patients and their surgeon each independently completed a validated Foot and Ankle Surgery Expectations Survey, developed by the Hospital for Special Surgery. For each survey, the total number of expectations for which a respondent anticipated at least “a little improvement” were counted, giving the Number of Expected Areas of Improvement (NEAI); and a validated Aggregate Score (AS), capturing the overall magnitude of expectations, was calculated. Average NEAI and AS for each patient group were calculated and analyzed in regression models that included several demographic covariates.
Results:
Sixty-nine patients were prospectively enrolled, 53 (76%) elective and 16 (24%) nonelective. The groups were demographically similar except for race. Patient expectations did not differ significantly between groups in NEAI or AS (P = .988, P = .462). Surgeon expectations were significantly lower both in NEAI and AS than those of patients in both groups (P < .001). Of the covariates tested in this study, increasing patient body mass index was the only significant predictor of increased patient-surgeon discrepancy (P = .005).
Conclusion:
This study confirms previous findings that surgeons have lower preoperative expectations than patients who undergo orthopaedic foot and ankle surgery. This exploratory study suggests that neither patients’ nor providers’ overall expectations differ between elective and nonelective foot and ankle surgeries.
Level of Evidence:
Level III, prospective observational study.
This is a visual representation of the abstract.
Introduction
Orthopaedic patients often have higher preoperative expectations than their surgeons, expecting a greater degree of recovery and improvement of a greater range of symptoms. 10 This discrepancy is important to recognize because discordantly higher preoperative expectations among patients are associated with lower postoperative satisfaction across several orthopaedic subspecialties, including foot and ankle surgery.9,13,14 It has been proposed that aligning preoperative expectations between patients and surgeons may improve postoperative outcomes and patient satisfaction.9,14 Unrealistic expectations may impact a patient’s decision to undergo surgery and thus are relevant to patient selection and counseling. 6
There have been increasing efforts to characterize expectations among various patient subpopulations and identify predictors of significant patient-provider discrepancies within the foot and ankle discipline. Previous studies have found that nonwhite race, female sex, and higher body mass index (BMI) predicted higher patient expectations.2,3,15 Clinical factors including worse functional status and greater medical comorbidity have also been associated with higher patient expectations.2,3,6,10 Furthermore, worse preoperative pain, poorer physical function, and greater depression symptoms have been associated with larger patient-provider discrepancies (patient > provider). 9 Cody et al 2 found that diagnosis accounted for the largest percentage of variation in expectations among patients undergoing elective foot and ankle surgeries.
Still, there are no studies to our knowledge describing expectations for time-sensitive surgeries for traumatic injuries. Previous studies comparing patient and surgeon expectations have excluded patients with traumatic injuries citing difficulties with consent and enrollment in the short time between initial presentation and surgery. 10 Extrapolating from previous studies, one might predict that expectations among trauma patients differ from elective patients given their inherently different demographic and clinical features. Trauma patients, on average, are younger, have fewer comorbidities, and a shorter duration of symptoms. Trauma patients may also have greater perceived disability because of the acute nature of their condition and sudden change in mobility. Conversely, some patients undergo surgery for a traumatic injury with a higher comorbidity burden, which would make them ineligible for elective surgery.
The primary aim of this study was to assess differences in expectations of foot and ankle surgery between patients undergoing elective vs nonelective surgeries. Secondarily, we sought to describe discrepancies between patient and surgeon expectations and the effects of age, sex, BMI, insurance status, and operative location on the magnitude of differences in expectations. We hypothesized that orthopaedic foot and ankle patients presenting with acute traumatic injuries would have higher expectations than those undergoing elective procedures.
Materials and Methods
Subjects and Setting
Patients scheduled to undergo any foot or ankle surgery at a single level 1 urban trauma center by a fellowship-trained foot and ankle surgeon were prospectively enrolled over 6 consecutive months (October 2023 to March 2024). All adult patients, aged 18 years or older, presenting with foot and ankle pathology and indicated for surgery were approached for inclusion. Exclusion criteria included inability to communicate in English or unwillingness to participate in the study. This study was approved by the Institutional Review Board at our institution.
Data Collection
Expectations survey
All enrolled patients underwent standard preoperative education using evidence-based practices and a comprehensive informed consent discussion for the indicated operation. Each patient then completed the Hospital for Special Surgery Foot and Ankle Surgery Expectations (HSS F&A) Survey either at the preoperative clinic appointment or in the preoperative surgical area. The survey is a 23-item questionnaire covering various physical and psychosocial domains including ambulation, pain, work, exercise and sports, footwear, cosmesis, and social activities (Figure 1). These categories represent common and highly prioritized expectations among foot and ankle patients. The survey was developed from patient interviews and is similar in derivation and form to those used in other orthopaedic subspecialties.1,7,11,12 In comparison with other survey tools for foot and ankle surgical expectations, 15 this survey is unique for its foregrounding of patient perspective and applicability to a broad range of diagnoses.4,6 The survey was previously demonstrated to be a valid and reliable tool for querying expectations for a diversity of foot and ankle procedures. 4

Hospital for Special Surgery Foot & Ankle Surgery Expectations Survey.
For each survey item, respondents report the level of improvement they expect from surgery on a 5-point scale, from “I do not have this expectation, or this expectation does not apply to me” to “complete improvement or back to normal.”
For each completed survey, the total number of items for which a respondent expected at least “a little improvement” were counted (out of 23 possible items), giving the Number of Expected Areas of Improvement (NEAI). Also, an Aggregate Score (AS) was calculated by a validated process 4 that assigns each item response a point value (0 points for “I do not have this expectation,” up to 4 points for “complete improvement”). The points are summed and divided by the maximum possible sum of 92 and then multiplied by 100, giving a percentage score.
The surgeon was blinded to patient responses and independently completed the HSS F&A expectations survey following each patient visit, which included preoperative education and informed consent.
Demographic and clinical variables
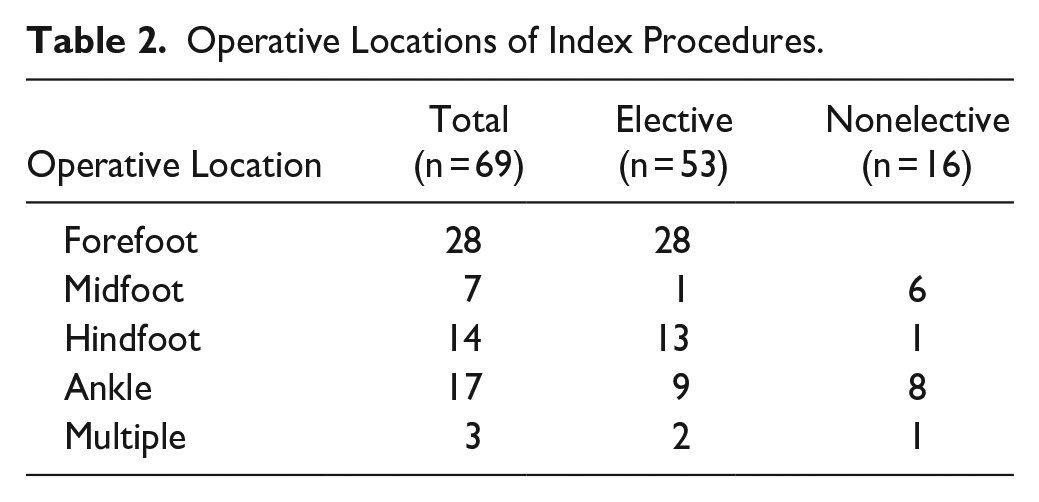
Primary diagnosis and primary surgical procedure were determined based on the surgeon’s preoperative note and the Current Procedural Terminology (CPT) code for the scheduled surgery (Table 2). Where multiple simultaneous procedures were scheduled, only the primary procedure and CPT code was recorded (e.g., flatfoot reconstruction with gastrocnemius recession was recorded as flatfoot reconstruction). Patients undergoing multiple or staged procedures during the study period were enrolled only once at the time of scheduling the first planned surgery.
Electronic medical record chart review was performed after the subjects were consented, and demographic information was extracted including age, sex, BMI, and self-reported race. For gender-nonconforming and nonbinary patients, the sex assigned at birth was recorded to facilitate statistical analysis. Insurance status was collected from the medical record and classified into one of 4 primary coverage groups: Medicaid, Medicare, private, or uninsured.
Statistical Analysis
Descriptive statistics are reported as means and SDs for continuous variables and frequencies for categorical variables. All statistical analyses were performed with Python.
Patient and provider expectations are expressed as means and SDs of the NEAI and the AS. Comparison of the NEAI and AS between elective and nonelective subgroups was conducted as a mixed effects linear regression model. The influence of additional demographic and clinical covariates—including age, sex, BMI, operative location, and insurance status—were assessed by ordinary least squares (OLS) regression.
The discrepancy between patient and provider expectations was also determined by (1) the difference in NEAI (patient NEAI less provider NEAI), and (2) the difference in AS (patient AS less the provider AS). The average patient-provider discrepancy in NEAI and AS were calculated on a per-patient level for each subgroup and compared in a separate OLS regression that again accounted for the influence of demographic and clinical covariates. For these models, alpha was set at .00625 (.05 with Bonferroni correction for 8 comparisons). Our null hypothesis was that there would be no difference in preoperative expectation between the elective and nonelective patient groups.
An a priori power analysis was conducted to determine the number of participants needed to detect a 20-point difference in AS with alpha = 0.05 and beta = 0.2. Assuming that elective procedures were 3 times as common as nonelective procedures based on institutional data of practice patterns, 40 patients were needed in total, 30 elective and 10 nonelective. The calculations were based on previous studies of 352 elective foot and ankle patients that reported a mean AS of 60.3 ± 18.7.3,10
Results
Over the 6-month study period, 73 patients were eligible for inclusion. Three patients were unwilling to participate, leaving 70 enrolled. One patient did not complete the expectations survey and thus was excluded from analysis (Figure 2). There were 53 (77%) elective and 16 (23%) nonelective subjects. Subject demographics are summarized in Table 1. The mean age was 51.4 (range, 18-83) years, and 70% were female. The elective and nonelective groups had similar demographic characteristics except for race. The elective group had a higher proportion of White patients whereas the nonelective group had a higher proportion of Black or African American and Asian patients (P < .001).

Recruitment and enrollment flowchart.
Patient Demographics and Insurance Status. a

Abbreviation: BMI, body mass index.
Data are expressed as mean (range), mean ± SD, or number (percentage). Boldface indicates statistically significant values by Fisher exact or Mann-Whitney U test. Percentages may not add to 100% because of rounding.
Operative Locations of Index Procedures.
Patient Expectations
Patient expectations did not differ significantly between the elective and nonelective groups in NEAI (P = .988) or AS (P = .462) (Figure 3). The effect size of the difference in NEAI using the Cohen d effect size calculation 8 was 0.45. This suggests a moderate effect size of the finding. The Cohen d value for AS was 0.24, suggesting a small effect size.
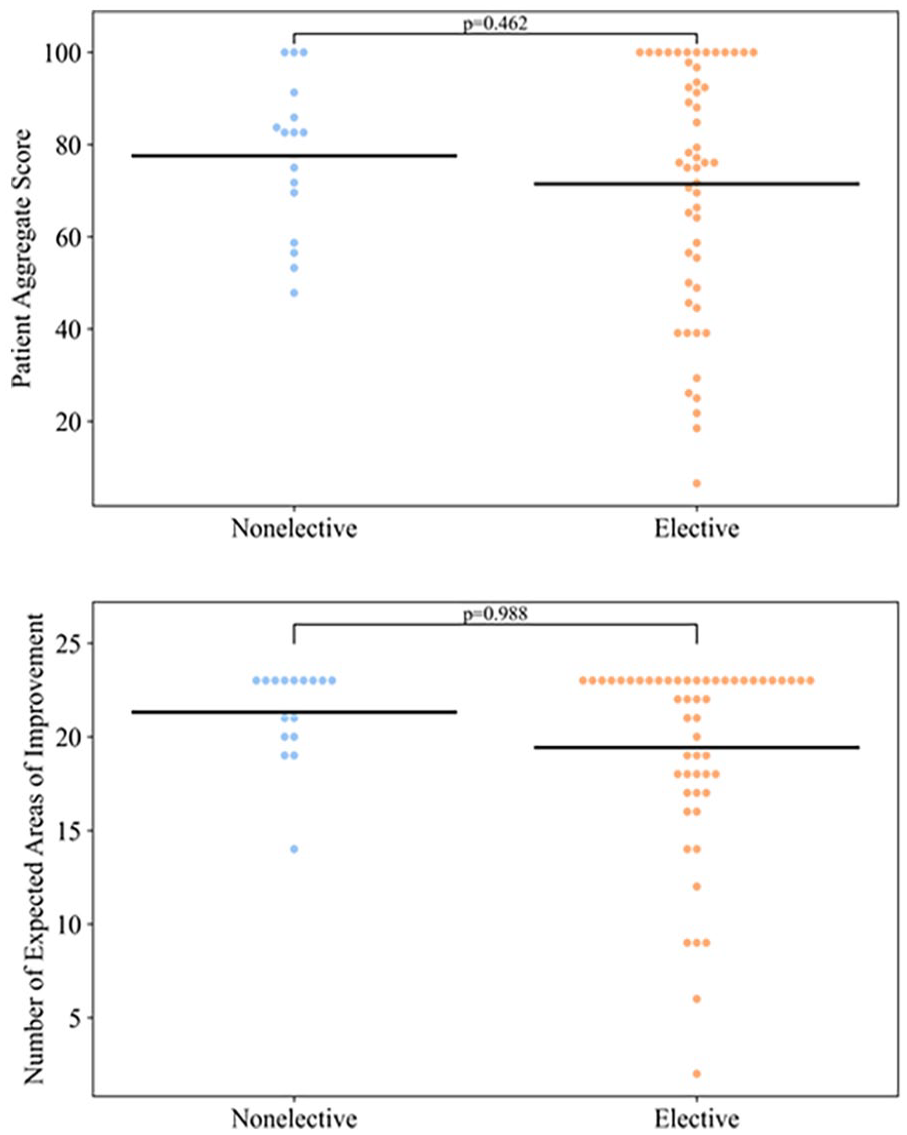
Patient expectations in elective vs nonelective groups. Black bars represent mean values.
Patients in the elective group most commonly expected at least moderate improvement in “pain at rest” (94%), “ability to walk on uneven ground” (91%), and “go back to normal” (93%). Patients in the nonelective group most commonly expected at least moderate improvement in “ability to walk longer or farther” (100%), “foot/ankle balance and stability” (100%), “go back to normal” (100%), and “prevent foot/ankle from getting worse” (100%) (Figure 4).

Percentage of respondents indicating expectation of at least “moderate improvement,” and percentage point difference between patient and surgeon. Cells are highlighted if there is at least a 30–percentage point discrepancy between patient and surgeon percentages for a given survey item. Values are rounded to 2 significant figures.
Being obese (BMI > 30) was associated with a higher NEAI as compared to patients with a normal BMI (P = .005) (Table 4).
Surgeon Expectations
The surgeon’s NEAI (P = .147) and AS (P = .024) did not significantly differ between groups. The effect size of the difference in NEAI using the Cohen d effect size calculation 8 was 0.64, which suggests a moderate effect size of the finding. The Cohen d value for AS was 1.10, suggesting a large effect size.
For elective patients, the surgeon most commonly expected at least moderate improvement in “ability to walk longer or farther” (79%), “ability to perform daily activities or household chores” (77%), and “participate in more family/social activities” (70%). For nonelective patients, the surgeon most commonly expected at least moderate improvement in “ability to walk longer or farther” (100%), “ability to go up and down stairs” (94%), and “gait or decreased limp” (88%) (Figure 4).
Surgeon NEAI and AS did not differ significantly with demographic or clinical covariates (Table 4).
Patient-Surgeon Discrepancies
Surgeon expectations were significantly lower both in NEAI (P < .001) and AS (P < .001) than those of patients for both elective and nonelective groups. There was no significant difference in the average patient-surgeon discrepancy between elective and nonelective groups (NEAI P = .286, AS P = .082) (Figure 5). The average NEAI difference between patient and surgeon overall was 7 ± 5.4 (8 ± 5.9 elective, 7 ± 3.0 nonelective). The average AS difference overall was 44 ± 25 (44 ± 27 elective, 41 ± 23 nonelective) (Table 3).

Patient vs surgeon expectations for total cohort. ***Statistically significant P values resulting from mixed linear regression model. Black bars represent mean values.
Average Number of Expected Areas of Improvement (NEAI) and Aggregate Score (AS).

Comparing the percentage of patients who expected at least moderate improvement for a given survey item to the percentage of surgeon responses of the same, the survey items with the largest discrepancy between elective patients and the surgeon were “improve pain at rest” (88.7pp), “go back to normal” (90.6pp), and “prevent foot/ankle from getting worse” (88.7pp). For nonelective patients, the largest patient-surgeon discrepancies were for “improve foot/ankle flexibility” (93.8pp), “increase variety of shoe options” (93.8pp), and “decrease pain elsewhere” (81.3pp) (Figure 4). “Participate more in family/social activities” was the only item for which the surgeon had higher expectation than patients (−1.9pp).
Of the demographic and clinical covariates tested, being overweight as compared to a normal weight was significantly associated with greater patient-surgeon discrepancy in NEAI (P = .005) (Table 4).
P Values From OLS Regression for Average Number of Expected Areas of Improvement (NEAI) and Aggregate Score (AS) Among Patients and Surgeon by Patient Trait. a

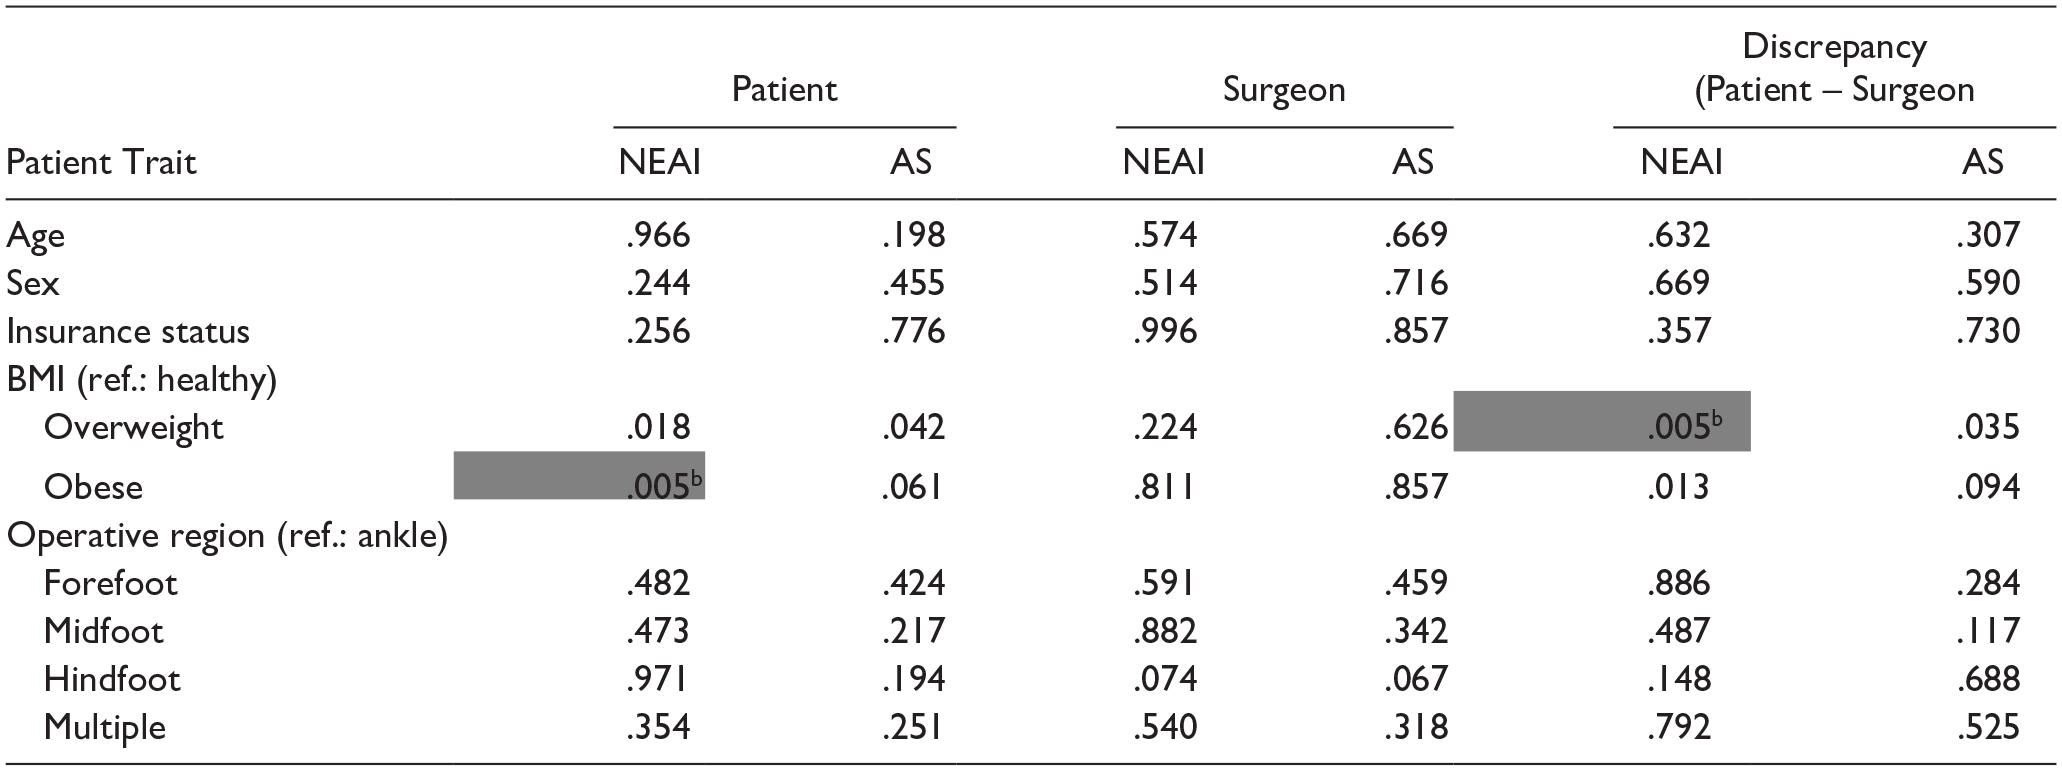
Abbreviations: BMI, body mass index; ref., reference group.
BMI classifications are made according to the World Health Organization criteria. Insurance status compares subsidized (Medicaid, Medicare, uninsured) vs nonsubsidized (private) insurance plans.
Cells are highlighted where the average value for the comparison group was significantly higher than the average value for the reference group, where alpha = 0.00625 using a Bonferroni correction for 8 comparisons.
Discussion
In this exploratory study, we build on prior investigations of preoperative expectations by assessing differences between foot and ankle patients undergoing elective vs nonelective surgeries. To the authors’ knowledge, the present study represents the first to specifically evaluate preoperative expectations of patients with acute traumatic injuries. 4 We found that both elective and nonelective patients had significantly higher expectations than their surgeon, but that there was no significant difference in the average number or magnitude of expected areas of improvement between the patient groups.
The anticipated degree of improvement per individual survey item did differ between groups, suggesting that patients undergoing elective procedures have different expectations than those undergoing nonelective surgery. Elective patients most often expected improvement in resting pain level and other domains pertinent to everyday life, whereas nonelective patients expected to regain functions of stability and endurance. These differences could be due in part to baseline activity levels or the difference in duration of symptoms. The orthopaedic trauma population at our center typically includes a larger proportion of younger, more active individuals who expect to return to high levels of physical activity. This contrasts with patients with chronic and/or advanced degenerative conditions who are more likely anticipating relief from longstanding pain or limitations on activities of daily living.
Variation in individual expectations on the HSS survey has been previously described in elective foot and ankle patients by Cody et al, 2 who noted that some survey items were reported more often for specific diagnoses (eg, appearance for hallux valgus correction) but that patients sometimes reported having expectations that were not attainable or relevant to their planned procedure (eg, improvement in numbness or tingling when there was none preoperatively). The latter finding was observed in the present study in that a large number of participants expected complete improvement for every item, even when not pertinent to their condition. Such responses could indicate patient misunderstanding of the survey although it may also represent patients’ mindset entering surgery in that they are hoping for a complete return to normal rather than critically assessing the potential impact of the operation on individual symptoms. This could explain, in part, why patients have higher expectations than surgeons as they show less discrimination in selecting relevant expectations. Survey fatigue may also play a role in this pattern of patient responses. Although it is helpful to have an assessment tool that is meant to apply to a broad range of conditions, these findings suggest that asking more pointed questions relevant to a particular diagnosis or procedure may be more appropriate.
The present study redemonstrates that surgeons consistently have lower preoperative expectations than their patients. Tai et al 15 found significant discrepancies between surgeons and their patients undergoing hallux valgus surgery, and MacMahon et al 10 demonstrated the same in the elective foot and ankle population using the HSS survey. This pattern is further underscored by responses to the survey item “go back to normal again”: both patient groups had large proportions of patients expecting to “go back to normal again” (93% elective vs 100% nonelective), although the surgeon held the same expectation for only 1.9% of elective patients vs 44% of nonelective patients. Cody et al 4 similarly found that “go back to normal again” was among the items with the largest patient-surgeon discrepancy.
Patient expectations in this study were higher than what has previously been reported in studies using the HSS F&A survey. Our average patient AS overall was 74 (±26) as compared to 70 (±20), 10 and the average Number of Expectations among patients was 20 (±5) as compared to 17. 5 Although partially explained by the nonelective subgroup of patients who tended to have higher expectations, the study population of these previous studies is also not comparable to the present study as it was predominately White and commercially insured whereas this study primarily included patients of color, had greater racial diversity overall, and almost half had subsidized or no insurance. Cody et al 2 showed that non-White race was significantly associated with higher provider expectations. It is possible that differences in health literacy or social deprivation underlie these socioeconomic differences and is worth investigating in future work based on these findings.
This study has several limitations. First, it is limited in its generalizability because of the urban, academic location and because the study included only 1 surgeon. MacMahon et al9,10 found that individual surgeon was significantly associated with degree of expectations reported by and for a patient, where patients’ sense of partnership with their surgeon was positively correlated with NEAI and years in practice had a significant, but nonlinear, relationship. Second, this study includes all presenting diagnoses and surgical procedures to capture the breadth of expectations among patients. This presents high variability, particularly among elective patients, which could obscure distinctions between groups.
Third, the HSS survey, although validated and derived from a patient perspective, is still limited as a tool for comparing expectations across various respondents given the inherent subjectivity. The value of this tool to the practitioner is dependent on further discussion between individual patient-provider dyads and self-reflection on the surgeon’s part to assess their baseline skepticism or optimism and any biases that may influence that perception. Fourth, the total proportion of nonelective subjects (23%) was relatively small. A larger and more balanced comparison of elective to nonelective surgeries is needed.
Finally, this study is powered to detect a difference of 20 points in AS, higher than the previously reported minimal clinically important difference of 10 points. 10 Therefore, this study may be underpowered to detect a clinically significant difference between groups and is likely prone to a greater type II error in its multiple comparisons. The pattern demonstrated here with insignificantly higher AS among nonelective patients could benefit from analyses of larger samples to verify if a difference truly exists. A post hoc power analysis where alpha = 0.05 and beta = 0.2 demonstrates that 280 elective and 70 nonelective participants would be needed to detect a 10-point difference in average AS.
In conclusion, this study characterized patient expectations among patients with traumatic injury and compared them to those undergoing elective surgery. The survey has potential value as a clinical tool for use in better understanding patient expectations and guiding preoperative counseling. 4 Continued study of patient expectations is valuable as a way to demonstrate the complexity of these phenomena. This study is part of a growing body of work that suggests that surgeons are prone to more conservative estimations of surgery benefits. Recognition of such a pattern may serve to enhance preoperative discussion and understanding between patients and providers by preempting misunderstandings that arise from the subjective interpretation of “good” or “complete” recovery.
Supplemental Material
sj-pdf-1-fao-10.1177_24730114251322431 – Supplemental material for Preoperative Expectations for Elective vs Nonelective Foot and Ankle Patients
Supplemental material, sj-pdf-1-fao-10.1177_24730114251322431 for Preoperative Expectations for Elective vs Nonelective Foot and Ankle Patients by Lily Upp, Sahil Sethi, Jason Strelzow and Kelly Hynes in Foot & Ankle Orthopaedics
Footnotes
Ethical Approval
Ethical approval for this study was obtained from the University of Chicago Institutional Review Board (IRB 23-0689).
Declaration of Conflicting Interests
The author(s) declared no potential conflicts of interest with respect to the research, authorship, and/or publication of this article. Disclosure forms for all authors are available online.
Funding
The author(s) received no financial support for the research, authorship, and/or publication of this article.
References
Supplementary Material
Please find the following supplemental material available below.
For Open Access articles published under a Creative Commons License, all supplemental material carries the same license as the article it is associated with.
For non-Open Access articles published, all supplemental material carries a non-exclusive license, and permission requests for re-use of supplemental material or any part of supplemental material shall be sent directly to the copyright owner as specified in the copyright notice associated with the article.