
Abstract
Background:
The aim of this study was to compare plain lateral radiographs and 3D surface rendering (SR) CT imaging, in the characterization of posterior malleolar fracture (PMF) morphology using the Mason and Molloy classification. The null hypothesis was that there was no difference in characterization of morphology between plain radiographs and 3D SR CT.
Methods:
Morphology of the PMF was categorized initially by the CT scan as classified by Mason and Molloy on 180 trimalleolar ankle fractures. PM fracture fragment size on the lateral radiograph were compared to their respective 3D surface rendering CT reconstructions, by two independent observers. Morphology of the PMF was assessed using all preoperative radiographs as compared to 3D SR CT.
Results:
On comparison of fracture fragment morphology, all fractures had poor categorization by plain radiographs although rotational pilon fractures (type 2A and 2B fractures) had the worse sensitivity and specificity (below 33% and below 50%, respectively). Radiographs underestimated joint involvement in type 2B fracture patterns because of the underappreciation of the posteromedial fragment.
Conclusion:
This study shows that the use of plain radiographs to categorize morphology of PMFs is poor. The study adds to the ever-growing body of evidence on the inaccuracy of using plain radiographs in PMFs to plan treatment. Additional CT imaging is imperative to allow for appropriate treatment planning in the management of PMF. Smaller fracture fragments are more susceptible to inaccuracies, especially the rotational pilon subtypes (2A and 2B) because of the obliquity of the posteromedial fragment to the plane of the X-ray source.
Level of Evidence:
Level III, retrospective comparative study.
This is a visual representation of the abstract.
Introduction
Ankle fractures that have posterior malleolar involvement are reported to have poorer long-term outcomes. 28 Historically, ankle trauma literature has advocated the internal fixation of a posterior malleolus fracture (PMF) when the fracture fragment size involves 25% to 33% of the articular surface. 25 In the last decade, cadaveric, clinical, and biomechanical studies have all worked to disprove this ideology by assessing fracture fragment size and its relevance to fracture mechanics and clinical outcomes.10 -12,28 The historical dogma of 25% to 33% relies on fragment size measured on a lateral radiograph. However, multiple studies have clearly demonstrated the failure of assessment of fracture fragment size from plain radiographs, intercalated fragments and misleads the surgeon about the extent of articular surface involvement.5,7 A number of authors have developed classifications of PMFs based on fracture morphology using CT, with reported improvement in functional outcomes when these classification systems have been used to direct surgical management.3,15,16,22,26 A scoping review of methods of biomechanical testing of PMFs recommended the use of the Mason classification because of its addressing the pathomechanism of the fracture. 31 Use of radiology to classify and quantify morphology as compared to CT has not been reported.
PMFs are both over- and underestimated by plain radiographic evaluation.13,24 Quantitative 3D CT (Q-3D CT) has previously been described for the precision measurement of pilon fractures, 8 coronoid fractures, and distal humerus fractures 6 and has been more recently proposed as a reference standard to quantify PMFs.20,34 The primary aim of this study was to compare plain lateral radiographs and 3D surface rendering (SR) CT imaging, in the characterization of posterior malleolar fracture morphology using the Mason and Molloy classification (Figure 1). Our null hypothesis was that there was no difference in characterization of morphology between plain radiographs and 3D SR CT.

3D surface rendering CT and lateral preoperative radiograph of types 2A, 2B, and 3 PMFs of the Mason and Molloy classification showing only 1 obvious PMF fragment on the lateral radiograph even in the type 2B fracture pattern. CT, computed tomography; PMF, posterior malleolar fracture.
Methods
A historical cohort study was completed involving all surgically treated foot and ankle trauma presenting to a level 1 major trauma center was undertaken. All PMFs on the database were identified and considered for inclusion in the study. The database was analyzed for all ankle fractures attending between August 26, 2014, and September 20, 2019. Inclusion criteria were all adult ankle fractures containing a PMF, where both a preoperative lateral radiograph and a preoperative CT scan had been obtained. Exclusion criteria were ipsilateral tibial fractures, other associated pilon fractures, and any case where other factors prevented clear radiographic imaging (such as prior metal work insertion). Classification of all fractures were undertaken according to the Mason and Molloy Classification. 22 Evaluation of the measurement accuracy of the PMF fragment size was given as the percentage of tibial plafond articular surface, based on plain lateral radiographs and comparison to 3D SR CT scans. Morphology classification was attempted using the preoperative plain radiographs and compared to the CT scan as a reference standard (Figure 1).
Image Analysis
All imaging data was analyzed using the hospital’s Picture Archiving and Communication System (Carestream Vue PACS; Carestream Health). Morphology of the PMF was categorized initially by the CT scan as described by Mason et al. 22 The preoperative lateral radiographs were used to measure the distance from the most posterior aspect of the articular margin to the observed fracture line of the fracture fragment (Figure 2). In addition, the anterior-to-posterior distance of the tibiotalar joint was also measured, and the primary measurement was divided by the secondary measurement to achieve a percentage, which resembled the PMF size. The images were measured by 2 independent observers.
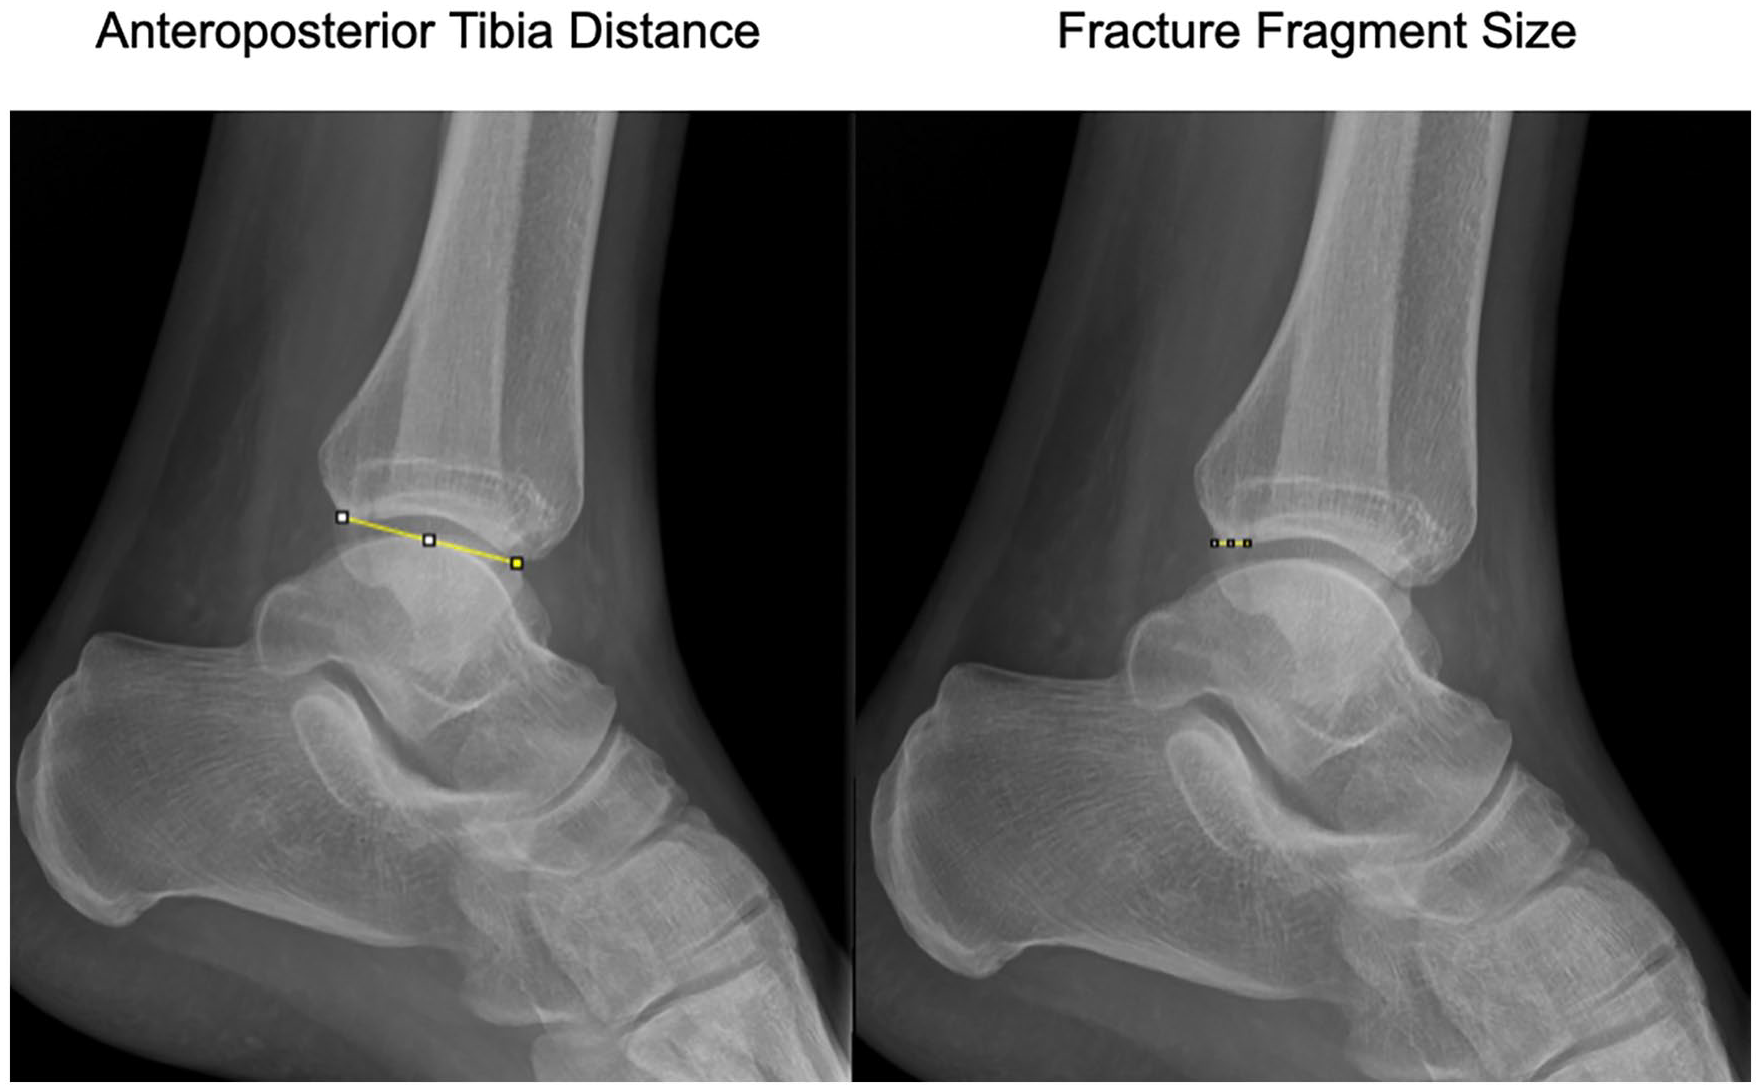
Preoperative lateral radiograph of an ankle illustrating the 2 measurements: (1) Anteroposterior distance measured from the posterior corner of the articular margin to the anterior corner of the articular margin and (2) the fracture fragment size measured from the posterior corner of the articular margin to the observed fracture line of the fracture fragment. The fracture fragment size was divided by the anteroposterior distance to achieve a percentage.
Using a 3D SR CT image constructed from the CT scan (0.5 mm per axial slice), the PMFs of all included cases were then independently measured again by the same 2 observers in a random and anonymized manner. The PACS system was used to remove the talus from the CT reconstruction to allow visibility of the inferior surface of the distal tibia articular surface. An image of the inferior tibial surface was exported in DICOM 3.0 format to ImageJ Plugin (Java NIH & LOCI, University of Wisconsin). 29 The distal tibial articular surface was outlined, as were all fracture fragments, and the ratio of the fracture fragments to the total articular surface was calculated as previously described (Figure 3).2,10,34 Radiographs were further assessed independently by 2 reviewers to attempt to categorize into the Mason and Molloy classification by radiology.

Images illustrating the DICOM 3.0 image of the inferior tibial surface exported to ImageJ Plugin (Java NIH & LOCI, University of Wisconsin). An example of the outlines of the distal tibial articular surface and fracture fragments are shown. The ratio of the fracture fragments to the total articular surface was calculated to also give a percentage (A and B). The compass is used to illustrate orientation. A, anterior; L, lateral; M, medial; P, posterior.
Statistical Analysis
Minimal total sample size was estimated to be 30 by keeping the desired statistical power level at 0.8 using prior study data on percentage articular involvement differences between radiographs and CT. 24 The anticipated effect size (Cohen d) was 0.5, and the probability level was set at .05. However, we decided to include all 180 patients who fulfilled the study criteria in our study.
All data were assessed using SPSS Inc, version 25.0 (IBM, Armonk, NY). Two-way mixed effects model, where people effects are random and measures’ effects are fixed, was used to determine interclass correlation coefficient (ICC) for interobserver reliability. The minimum value for interclass correlation coefficient was kept at 0.8 for the study to be significant as interpreted by Landis and Koch. 18 Landis and Koch defined slight agreement as 0.00-0.20, fair agreement as 0.21-0.40, moderate agreement as 0.41-0.60, substantial agreement as 0.61-0.80, and almost perfect agreement as greater than 0.81. For the reliability of intraclass correlation coefficient, the CI was set at 95%. Kurtosis and skewness were used to test if data was parametric. In all scaled nonparametric data, Wilcoxon signed rank test was used, with a P value less than .05 considered significant.
Results
There were 180 PMFs which matched the inclusion criteria. The average age of the whole study population was 49.9 years (range, 17-90 years). The fractures were classified based on the CT scans according to the Mason and Molloy Classification as 64 type 1 injuries (35.6%), 45 type 2A injuries (25.0%), 41 type 2B injuries (22.8%), and 30 type 3 injuries (16.7%) (see Table 1). 22 The average age among the subgroups was similar, with type 1 being 51.7 years (range, 17-81 years), type 2A 49.6 years (range, 21-87 years), type 2B 46.8 years (range, 24-70 years), and type 3 51.0 years (range, 22-90 years). There was a female preponderance in the whole group, with 115 females and 65 males.
Mean Percentage Joint Involvement for Both 3D SR CT and Radiographs, With 95% CIs and Statistical Analysis Between Groups. a

Abbreviations: CT, computed tomograph; SR, surface rendering.
The intraclass correlation coefficient between groups is shown. The fractures are classified by the Mason and Molloy classification. 20
Table 1 shows the mean percentage joint involvement for the different PMF fragment types based on 3D SR CT scan and radiographic measurement, with 95% CIs and statistical analysis between groups. When calculating the percentage joint surface involved by the PMF fragment, both methods of measurement had significant agreement between observers, with an overall interclass correlation coefficient for 3D SR CT being 0.852 and for plain radiographs 0.947. The intraclass correlation coefficient between groups was slight for 2A fractures, fair for type 1, moderate for type 2B, and substantial for type 3 injuries. On both 3D SR CT and plain radiographs, all Mason and Molloy categories apart from type 3 fractures had percentage joint involvement less than 30% on both 3D SR CT and lateral radiographs.
When comparing the accuracy of morphology description by radiographs as compared to CT, we found that the intraclass correlation coefficient of classification by radiograph between observers was fair. The intraclass correlation coefficient between 3D SR CT and radiographs was fair to moderate. As illustrated in Table 2, in the comparison between 3D SR CT and radiographs, the sensitivity of radiographs to correctly categorize the PMF morphology was lowest for the rotational pilon fractures (type 2A and B); however, the sensitivity was less than 61% for all PMF subtypes.
Sensitivity and Specificity of Plain Radiographs to Correctly Categorize Fracture Morphology Using the Mason and Molloy Classification.
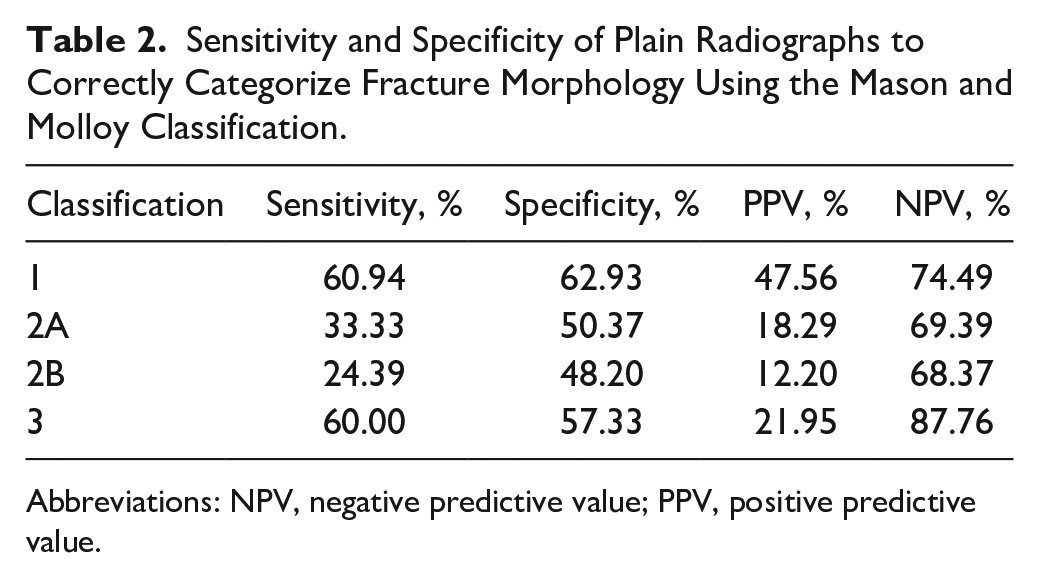
Abbreviations: NPV, negative predictive value; PPV, positive predictive value.
Discussion
The primary aims of this study were to compare the plain radiographs and 3D SR CT in the characterization of posterior malleolar fracture morphology using the Mason and Molloy classification, our null hypothesis being that there was no difference in characterization. Our study has shown that predicting the Mason and Molloy classification by radiographs is not only poor but also not repeatable (interclass correlation coefficient 0.306). Therefore, our null hypothesis can be rejected. This is important as although it is often accepted that CT is now required for PMFs, smaller fragments may not undergo CT when they may in fact represent a much more complex morphology.
In our study, no PMF pattern showed significant correlation between the PMF fragment size on the lateral radiograph compared with the 3D SR CT. This finding is similar to several studies who have also shown that PMF fragment size and morphology could not be accurately judged based on plain lateral radiographs.4,7,13,17,19,23,24,30 In this study, the 2B fracture pattern had almost 3 times the number of joint involvements underestimated as compared to the other fracture patterns. We theorize that the type 2B fracture, a 2-fragment rotational pilon, is more likely to be underreported because of the second medial fracture line being oriented away from the radiographic plane (Figure 3). As described by Vosoughi et al, 32 the large rotational pilon type of posterior medial fragments in PMF have fracture lines on axial CT approximately 30 degrees to the posterolateral fragment. Therefore, a radiograph taken in a single plane is less likely to visualize both fragments because of their orientation to one another. However, not all posteromedial fragments are susceptible to this, as Vosoughi et al also found that avulsion-type posteromedial fragments had orientation similar to the posterolateral fragment. Meijer et al 23 also concluded that there was a tendency to misjudge posteromedial injury.
Comparing both imaging modalities in the characterization of PMF morphology, the use of the Mason and Molloy classification has been shown to be both useful in the planning of the surgical approach for PMF management and dictating the choice of fixation.14,21,27 This study has shown that predicting the Mason and Molloy classification by radiographs has low sensitivity and specificity. Although the type 1 and type 3 fracture patterns showed a 40% to 60% agreement with the CT classification, the type 2 fractures (both A and B) showed agreement in only up to a third of the cases. Therefore, the use of only radiographs in PMF management does not allow appropriate planning.
A number of authors have reported that the addition of CT evoked a change in management when compared to only plain radiographs in the treatment of PMF. Donohoe et al 9 found that the use of CT changes operative management in 44% of cases in PMF. Similarly, Sheikh et al 30 found that the use of CT compared with radiographs changed the surgical approach in 32.7% of cases and the decision to stabilize the PMF in 25.6% of cases. The inability to guide the surgeon to the size of the fracture, notwithstanding radiographic redundancy in determining fracture morphology, should be reason enough to prompt CT imaging (Figure 4). Contrary to the argument that pursuing this imaging is excessive, 33 we believe that this is now supported by many studies driving us toward treatment. A major component the current article adds to the literature is the identification of type 2B fractures as the lowest fracture type in regard to sensitivity in diagnosis on plain radiographs. Small fracture fragments on plain radiograph can often be disregarded as type 1 fractures, when in fact an additional much larger posteromedial fragment may be present. Additionally, die punch fragments can also be hidden because of the out-of-plane X-ray source. In their recent study, Aamir et al 1 noted that if the fracture plane enters the tibialis posterior sheath, there was an approximately 40% chance of tendon entrapment, which can also be witnessed on CT and not radiograph.

Lateral radiograph showing a small PMF fragment with an ankle fracture subluxation. This appears to be an avulsion-type fracture pattern; however, on the 3D SR CT joint, surface impaction and fragmentation is evident. CT, computed tomography; PMF, posterior malleolar fracture; SR, surface rendering.
Our study has limitations. The edges of the articular surface and the fracture lines are determined manually. However, it should be noted that the interclass correlation coefficient in our study was significant between both investigators. Use of ImageJ Software to measure percentages was done on the premise that this is validated software developed by the National Institute of Health and therefore was both accessible and repeatable. This is supported by the interclass correlation coefficient being significant in its use. Additionally, the articular cartilage is not demonstrated on CT and thus the percentages given are a surrogate to the true articular surface damage. Finally, we limited the amount of observers in our study as the interclass correlation coefficient measured was either significant or very poor and therefore unlikely to be changed with more observers. Despite having only 2 observers, this is the largest study regarding number of cases in the literature.
Conclusions
This study shows that the use of plain radiographs to categorize the morphology of PMFs has poor results. The study adds to the ever-growing body of evidence on the inaccuracy of using plain radiographs in PMFs to plan treatment. Additional CT imaging is imperative to allow for appropriate treatment planning in the management of PMF. Smaller fracture fragments are more susceptible to inaccuracies, especially the rotational pilon subtypes (2A and 2B) because of the obliquity of the posteromedial fragment to the plane of the X-ray source.
Supplemental Material
sj-pdf-1-fao-10.1177_24730114241311879 – Supplemental material for 2B or not 2B, should this not be the question? Comparison of 3D Surface Rendering CT to Plain Radiographs for Characterization of Posterior Malleolar Fracture Morphology
Supplemental material, sj-pdf-1-fao-10.1177_24730114241311879 for 2B or not 2B, should this not be the question? Comparison of 3D Surface Rendering CT to Plain Radiographs for Characterization of Posterior Malleolar Fracture Morphology by Laura-Ann Lambert, Howard Stringer, Lizzy Weigelt, Lois Duncan, Jake Cowen and Lyndon Mason in Foot & Ankle Orthopaedics
Footnotes
Ethical Approval
Ethical approval for this study was waived by the Liverpool Orthopaedic and Trauma Service research review board (submission number 23-50) following protocol review and was evaluated to be a service evaluation project and therefore did not require ethical approval.
Declaration of Conflicting Interests
The author(s) declared the following potential conflicts of interest with respect to the research, authorship, and/or publication of this article: Lyndon Mason, MB BCh, MRCS, FRCS(Tr&Orth), SFHEA, reports general disclosures of implant designer and consultant for Orthosolutions. Disclosure forms for all authors are available online.
Funding
The author(s) disclosed receipt of the following financial support for the research, authorship, and/or publication of this article: Lyndon Mason, MB BCh, MRCS, FRCS(Tr&Orth), SFHEA, is an implant designer and receive royalties from Orthosolutions. The other authors declare no financial or nonfinancial interests.
References
Supplementary Material
Please find the following supplemental material available below.
For Open Access articles published under a Creative Commons License, all supplemental material carries the same license as the article it is associated with.
For non-Open Access articles published, all supplemental material carries a non-exclusive license, and permission requests for re-use of supplemental material or any part of supplemental material shall be sent directly to the copyright owner as specified in the copyright notice associated with the article.