
Abstract
Background:
The incidence of primary total ankle arthroplasty (TAA) is rising, with a corresponding increase in revision surgeries. Despite this, research on risk factors for revision TAA following primary TAA remains limited. Radiographic soft tissue thickness has been explored as a potential predictor for outcomes in hip, knee, and shoulder arthroplasty, but its role in TAA has not been assessed. This study aimed to assess the predictive value of radiographic soft tissue thickness for identifying patients at risk of requiring revision surgery following primary TAA.
Methods:
A retrospective study was conducted on 323 patients who underwent primary TAA between 2003 and 2019. Radiographic measurements of soft tissue thickness were obtained from preoperative radiographs. Two novel radiographic measures of soft tissue thickness were developed and assessed (tibial tissue thickness and talus tissue thickness). Clinical variables including age, gender, body mass index (BMI), American Society of Anesthesiologists (ASA) classification, diabetes, smoking status, primary diagnosis, and implant type were recorded. Logistic regression analysis was used to assess the predictive value of soft tissue thickness and BMI for revision TAA.
Results:
The rate of revision surgery was 4.3% (14 of 323 patients). Patients requiring revision had significantly greater tibial tissue (3.54 vs 2.48 cm; P = .02) and talus tissue (2.79 vs 2.42 cm; P = .02) thickness compared with those not requiring revision. Both the tibial tissue thickness (odds ratio 1.16 [1.12-1.20]; P < .01) and the talus tissue thickness (odds ratio: 1.10 [1.05-1.15]; P < .01) measurements were significant predictors of revision TAA in multivariable logistic regression models. However, BMI was not a significant predictor of revision TAA. The two metrics demonstrated excellent interrater reliability.
Conclusion:
Greater soft tissue thickness was a better predictor of revision TAA compared with BMI. These findings suggest that radiographic soft tissue thickness may be a valuable tool for assessing the risk of the need for revision TAA following primary TAA. Further research is needed to validate and explore the potential impact on clinical practice.
Level of Evidence:
Level III, comparative study.
Keywords
Introduction
The incidence of primary total ankle arthroplasty (TAA) is growing, with 41,060 primary TAAs identified from 2009 to 2019 and annual incidence increasing by >130% nationwide. 16 As the utilization of primary TAA increases, there remains a notable risk of implant failure and subsequent necessity for revision surgery.20,40 Identifying risk factors would enhance surgical decision making, patient counseling, and the development of strategies for risk mitigation. 1 However, there is a paucity of research focusing on potential risk factors for revision TAA following the index procedure.
Obesity has been shown to be a modifiable risk factor for various postoperative complications following TAA.19,29,39 As a result, body mass index (BMI) has been used as a proxy for body composition because of its ease in calculation. However, BMI is limited by its ability to accurately assess body composition and specific adipose tissue distribution. Research investigating the use of BMI as a surrogate for risk stratification in primary TAA has not been unifom.2,6,17,19,29,39 A database study found that the incidence of TAA failure was higher in individuals classified as obese (BMI ≥ 30) compared to those with a normal BMI. 39 However, recent retrospective studies have demonstrated that obesity was not associated with increased rates of complications after primary TAA 17 and BMI was not a risk factor of implant failure. 6 Additionally, multiple studies have demonstrated that body fat percentage is a better predictor of outcomes after knee and hip arthroplasty, but these assessments require specialized tools limiting their widespread adoption.21,22 These previous studies underscore the necessity of exploring alternative methodologies to assess obesity-related risks in orthopaedic surgeries.
Moreover, preoperative radiographic soft tissue thickness has been suggested as a predictor of outcomes following hip, knee, and shoulder arthroplasty.25,26,28,33,36,38,41 In hip arthroplasty, measurements included the distance from the tip of the greater trochanter to the skin along a perpendicular line to the femoral diaphysis, whereas knee arthroplasty focused on prepatellar and pretubercular thickness measurements.26,36,38 Shoulder arthroplasty measured the deltoid muscle and subcutaneous fat thickness using concentric circles centered on the humeral head. 41 Assessing soft tissue thickness in the ankle could offer a cost-effective means to gauge fatty composition, as radiographs are routinely taken during standard preoperative assessments. This study aimed to assess the predictive efficacy of two distinct preoperative radiographic metrics, tibial tissue and talus tissue thickness, for the need for revision TAA and to compare their predictive abilities with BMI. We also examined the interobserver reliability for these two radiographic metrics. We hypothesize that greater tibial tissue and talus tissue thickness would be predictive of the need for revision TAA following primary TAA.
Methods
Study Design
The study involved querying of our institution’s medical record system of patients who underwent primary TAA between 2003 and 2019. A total of 1312 patients were identified during this period. Exclusions were applied based on the following criteria: (1) all revision cases; (2) charts lacking adequate preoperative lateral plain films; (3) cases with less than five years of follow-up; and (4) cases with a history of surgery on the ankle of interest prior to primary TAA. A total of 830 patients were excluded because of insufficient follow-up time and 136 cases were excluded because of prior ankle surgery. An additional 23 patients were excluded owing to missing or poor preoperative radiographs, resulting in a final cohort of 323 patients (Figure 1). The selection of TAA implant systems, including the INBONE I, INBONE II, STAR, Salto-Talaris, Infinity, and Vantage TAA, was based on surgeon preference and patient-specific factors. All procedures were performed at a single institution by one of four fellowship-trained surgeons with significant experience in TAA. Prior to commencing the study, approval was obtained from the Institutional Review Board.

Study cohort selection.
Radiographic Measurements
Preoperative lateral weightbearing radiographs were taken and assessed using the Picture Archiving and Communication Systems (PACS). No preoperative radiographs were determined to be excessively rotated. All TAAs included within our study underwent the procedure using an anterior approach. Two distinct measurements were developed to accurately capture the soft tissue at the surgical site (Figure 2). The two radiographic measurements were obtained on preoperative radiographs as follows: (1) a line was drawn from the posterior distal tibia to the anterior distal tibia, and the distance of the parallel segment extending from the anterior cortex of the tibia to the end of the soft tissue shadow was measured (referred to as tibial tissue), and (2) a line was drawn from the lateral process of the talus to the head/neck junction of the talus, and the distance of the parallel segment, extending from the head/neck junction of the talus to the end of the soft tissue shadow, was measured (referred to as talus tissue).
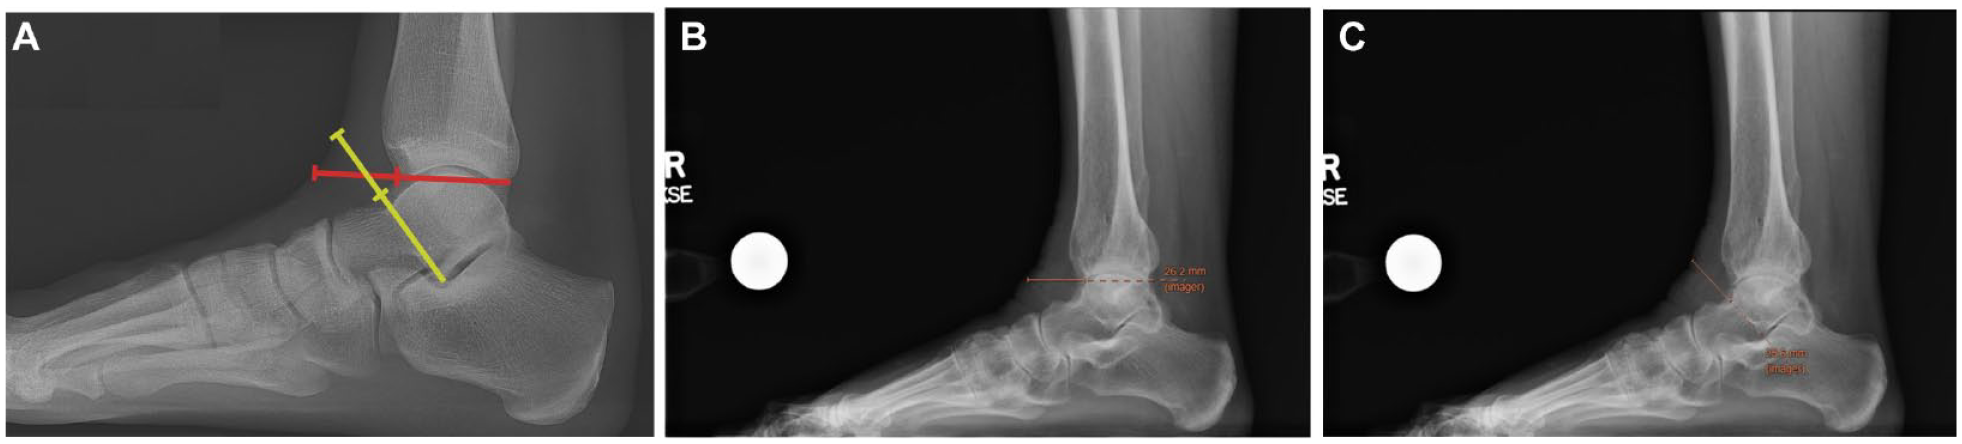
Radiographical assessment of tissue thickness. The figure illustrates the method for obtaining the radiographic measurements on weightbearing lateral radiographs. (A) A line was drawn from the posterior distal tibia to the anterior distal tibia (red line), and the distance of the parallel segment extending from the anterior cortex of the tibia to the end of the soft tissue shadow was measured to determine the tibial tissue thickness. A line was drawn from the lateral process of the talus to the head/neck junction of the talus (yellow line), and the distance of the parallel segment, extending from the head/neck junction of the talus to the end of the soft tissue shadow, was measured to determine the talus tissue thickness. (B) The tibial tissue thickness in this patient measures 2.62 cm. (C) This patient’s talus tissue thickness measures 2.56 cm.
In cases where anterior osteophytes exist at the tibia, the tibial tissue thickness was determined to start at the anteriormost point of the tibial plafond following the intersection point of the anterior tibial cortex and the tibial plafond (Figure 3). In cases where imperfect radiographs or ankle deformity made it challenging to visualize the lateral process of the talus, other preoperative sets of radiographs were used to arrive at a more accurate location point for the lateral process for use in the talar tissue thickness metric.

Radiographic assessment of the tibial tissue thickness in a patient with anterior tibial osteophytes. The tibial tissue thickness (orange line) was determined to start at the anteriormost point of the tibial plafond following the intersection point of the anterior tibial cortex and the tibial plafond. This patient’s tibial tissue thickness measured 2.24 cm.
Interobserver Reliability
The two radiographic measurements were assessed independently by three masked raters using 10 randomly selected preoperative lateral radiographs to determine interobserver agreement, calculated using the intraclass correlation coefficient (ICC). 3 ICC values below 0.5 are generally considered indicative of poor reliability, whereas those falling between 0.5 and 0.75 suggest moderate reliability. ICC values between 0.75 and 0.9 indicate good reliability, and values exceeding 0.90 are indicative of excellent reliability. 18
Clinical Variables
Data variables were gathered through manual chart review, encompassing patient demographics and characteristics such as gender, American Society of Anesthesiologists (ASA) classification, age at primary TAA, BMI, smoking status, primary diagnosis, and the presence of diabetes. The total tourniquet time for the TAA was also documented. Additionally, outcomes, including whether the patient underwent revision TAA defined as either single component extraction or extraction of both components, were recorded.
Statistical Analysis
Standard descriptive statistics were calculated, including the mean, standard deviation (SD), and frequency. The Student t test was used to compare continuous variables, whereas the χ2 test was employed for the analysis of categorical variables. The logistic regression models reported odds ratios with 95% CIs, P values, and Nagelkerke R2 values for the analyses. The ICC analysis employed a two-way random effects model, considering a single rater/measurement type, with a relationship defined as consistency. 18 ICCs were reported with their corresponding 95% CIs. A power analysis was conducted to determine the minimum sample size required to detect a significant effect of soft tissue thickness on the risk of revision TAA using a two-tailed test with a significance level of .05 and a power of 0.80. The revision rate was estimated to be 4.0%, and a clinically significant odds ratio was estimated to be 2.0 based on prior literature. 6 The analysis demonstrated that a minimum sample size of approximately 250 patients would be needed to detect a significant effect of soft tissue thickness on the risk of revision TAA with a power of 0.80 and a significance level of .05. The R software (version 3.6.1; The R Foundation, Vienna, Austria) was used for all statistical analyses, with statistical significance defined as P <.05.
Results
Patient Characteristics
The cohort included 323 patients (180 males, 143 females), with an average age of 62.9 ± 9.1 years at the time of surgery (Table 1). The most common ASA classification was class II (n = 186; 57.6%), followed by class III (n = 127; 39.3%) and class I (n = 10; 3.1%). The average BMI for all patients within this study was 29.6 ± 5.5 kg/m2. Mean follow-up was 7.8 ± 2.3 years. There were 27 patients (8.4%) with a history of diabetes. In terms of smoking history, most patients (n = 184; 57.0%) had no history of smoking whereas 130 patients (40.2%) had a history of smoking, and 9 patients (2.8%) were current smokers. The most common preoperative diagnosis resulting in the primary TAA was posttraumatic (n = 198; 61.3%), followed by osteoarthritis (n = 98; 30.3%). The most common primary implant used for TAA was the STAR (n = 98; 30.3%), followed closely by Salto-Talaris (n = 82; 25.4%). The average total tourniquet time across the cohort was 2.3 ± 0.6 hours.
Patient Demographics and Characteristics.

Abbreviations: ASA, American Society of Anesthesiologists; BMI, body mass index; TAA, total ankle arthroplasty.
Statistically significant (P < .05).
Revision Total Ankle Arthroplasty
The revision surgery rate was 4.3% (14 of 323 patients). There were no significant demographic differences between the revision and nonrevision subgroups, including age, gender, BMI, ASA classification, smoking status, primary diagnosis, prosthesis type, and total tourniquet time. Patients requiring revision had a greater preoperative tibial tissue (3.54 vs 2.48 cm; P = .02) and talus tissue (2.79 vs 2.42 cm; P = .02) thickness compared to those patients not requiring revision.
Logistic Regressions
The multivariable logistic regression analysis, controlling for age, gender, BMI, ASA classification, diabetes and smoking status, preoperative diagnosis, and implant type, revealed that both tibial tissue and talus tissue thickness were significant predictors of revision TAA (Table 2). Tibial tissue thickness emerged as a stronger predictor of revision TAA (odds ratio: 1.16 [1.12-1.20]; P < .01; Nagelkerke R2 = 0.218) compared with talus tissue thickness (Table 3). However, talus tissue thickness remained a significant predictor of revision TAA (odds ratio: 1.10 [1.05-1.15]; P < .01; Nagelkerke R2 = 0.115) (Table 3). Both soft tissue measurements improved the predictive ability of the model, as indicated by the Nagelkerke R2 value, compared with the base model without those measurements (Table 4). Notably, BMI was not a significant predictor of revision TAA following primary TAA in all models. Additionally, in the model with tibial tissue as a predictor, follow-up time (P = .02) was an additional predictor of revision surgery. In both the talus tissue and BMI models, male gender and the primary diagnosis type (osteoarthritis, posttraumatic, and rheumatoid) were found to have a significant association with revision surgery.
Logistic Regression Model Predicting Revision Total Ankle Arthroplasty Using Tibial Tissue Thickness.

Abbreviation: ASA, American Society of Anesthesiologists; BMI, body mass index; CI, confidence Interval.
Logistic Regression Model Predicting Revision Total Ankle Arthroplasty Using Talus Tissue Thickness.

Abbreviations: ASA, American Society of Anesthesiologists; BMI, body mass index.
Logistic Regression Model Predicting Revision Total Ankle Arthroplasty Without Soft Tissue Thickness.
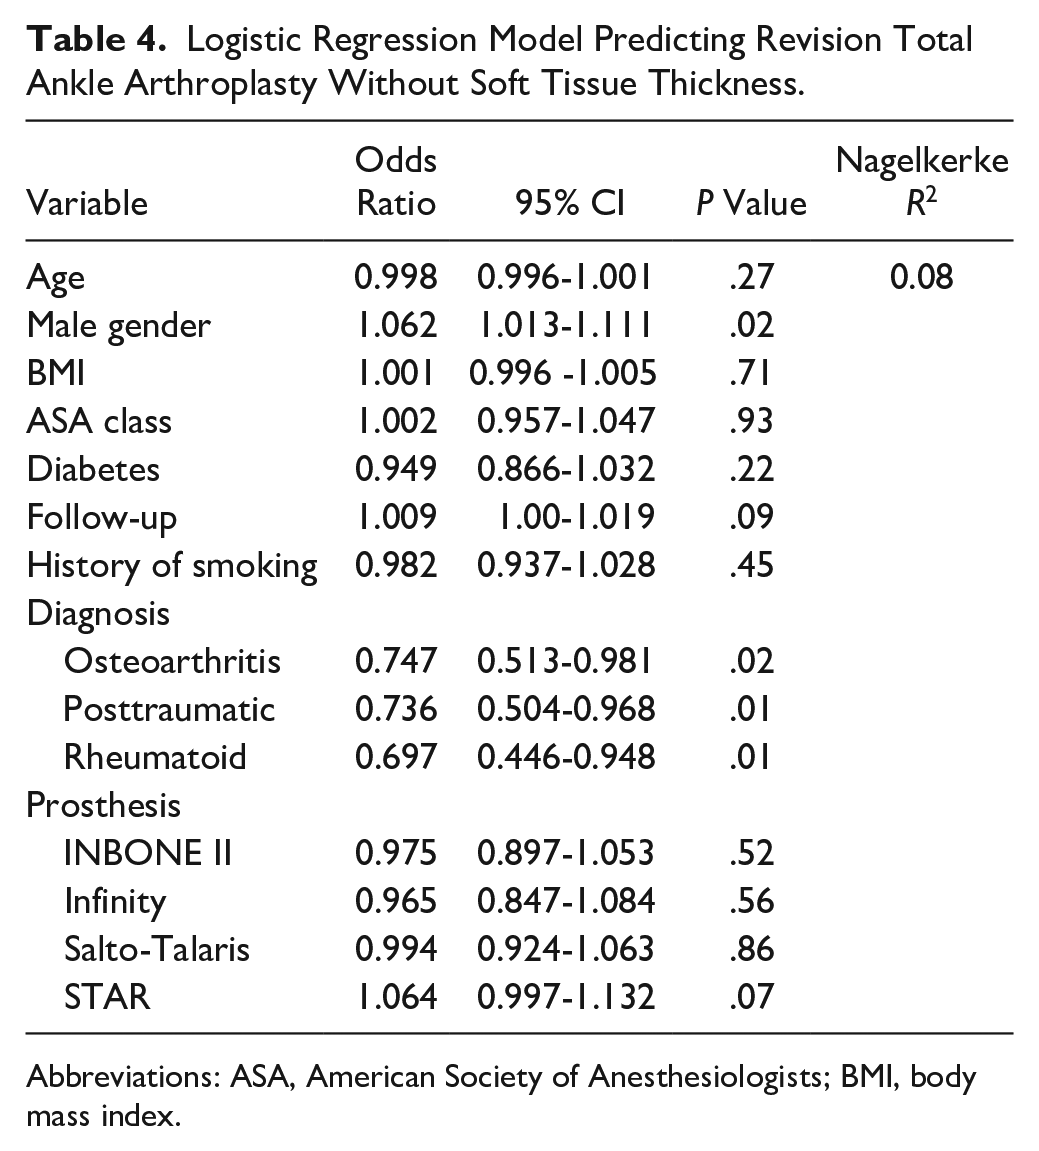
Abbreviations: ASA, American Society of Anesthesiologists; BMI, body mass index.
Interobserver Reliability
The tibial tissue measurement exhibited an ICC of 0.982 (95% CI 0.949-0.995), indicating excellent reliability among the masked raters. Similarly, the talus tissue measurement demonstrated an ICC of 0.935 (95% CI 0.824-0.982), suggesting good to excellent reliability among the three masked raters.
Discussion
Our study found that greater radiographic soft tissue thickness at the tibial and talus regions prior to primary TAA was associated with the need for revision surgery and proved to be a more effective predictor of subsequent revision TAA when compared to BMI. The two measurements demonstrated excellent interobserver reliability. The findings of this study contribute to the growing body of literature exploring risk factors for TAA failure and revision surgery. These results align with findings in the broader orthopaedic literature, indicating that radiographic soft tissue thickness is a predictor of complications following arthroplasty.26,28,31,34-36,38,41
The association between revision surgery and soft tissue thickness may be explained by implant alignment. The literature has demonstrated the importance of alignment in influencing outcomes following primary TAA. 7 Malalignment can result in elevated edge loading, polyethylene wear, bearing subluxation, and premature failure of primary TAA.7-9,13 Further, any malalignment can exacerbate the uneven distribution of force in the bone. 10 Richter et al 27 conducted a study involving 1074 cases of TAA with a three-component ankle implant. They found that patients with significant preoperative deformities were more likely to require implant revision, highlighting the importance of correcting alignment for successful outcomes. Clough et al 5 conducted a review of 200 STAR implants and identified coronal plane malalignment (25%) as one of the most frequent reasons for revision TAA. The presence of increased soft tissue at the surgical site can pose a challenge and may contribute to malalignment. Patients with greater soft tissue thickness may face a higher risk of malalignment owing to the complexities involved in properly positioning the implant within the ankle joint and the precision of soft tissue balancing. Moreover, the increase in soft tissue at the surgical site could potentially obscure the surgical field, making it more challenging for surgeons to achieve optimal implant alignment. Additionally, greater soft tissue thickness can elevate the risk of complications due to substantial shear forces required for increased tissue retraction. 34 Patients who are identified as having increased soft tissue may benefit from strategies aimed at mitigating the impact of soft tissue thickness on implant alignment, such as preoperative planning and intraoperative techniques. 12 Further, surgical site thickness has been shown to be a risk factor for infection, wound complications, and early failure following total knee and hip arthroplasty.14,25,31
In a retrospective review of 1110 patients undergoing a total hip arthroplasty, Sprowls et al 35 found that the surgical site thickness was predictive of infection and associated with revision surgery (odds ratio: 1.022 [1.004-1.041]; P = .02). They suggest that a radiographic measure accurately captures surgical site adipose compared with BMI and was potentially a modifiable risk factor. Dietary and activity adjustments could represent an initial strategy for managing these high-risk patients. Watts et al 38 reported an elevated risk of reoperation and wound complications with greater radiographic soft tissue thickness in 1689 primary total knee arthroplasties performed on morbidly obese patients. Similarly, Shearer et al 32 in a multicenter study of 4745 total knee arthroplasties, observed increased complications and surgical time correlated with greater soft tissue thickness. These findings were replicated in several studies.4,26,31,34 Likewise, Wu et al 41 found an increase in complications and surgical time in patients with greater soft tissue thickness following 211 reverse shoulder arthroplasties. Like Watt et al, they concluded that greater thickness resulted in more complicated dissection and tissue trauma, leading to complications. These studies suggest that radiographic soft tissue thickness is a potentially modifiable risk factor in orthopaedic surgeries. Similarly, our study demonstrates an association between radiographic soft tissue thickness with high interrater reliability and revision TAA.
BMI was not found to be a significant predictor of revision TAA. Although previous literature has implied that obesity, as evidenced by higher BMI, could contribute to TAA failure, our study aligns with other research indicating that BMI has limited predictive value for outcomes following TAA.6,17,19,29,39 The discrepancy in findings may be attributed to the limitations of BMI as a measure of body composition, as it does not account for specific adipose tissue distribution or body fat percentage that may impact the implant. 24 Patients with substantial muscle mass may have an elevated BMI despite having decreased adipose tissue at the surgical site. 24 Therefore, BMI may not be the most suitable tool for assessing the risk of adverse outcomes following arthroplasty.17,21,22,30,37 These soft tissue measurements derived from preoperative weight-bearing radiographs would offer a more accurate and localized assessment of adipose tissue around the foot and ankle than BMI alone. Furthermore, the potential for future integration of artificial intelligence to automatically generate these measurements could streamline risk stratification without disrupting a surgeon’s workflow. 23 As such, these metrics hold significant promise as a valuable tool for preoperative planning and risk assessment in foot and ankle surgery. Additionally, it remains possible that TAA studies are simply underpowered to detect substantial differences in outcomes across varying BMI cohorts.
Despite the widespread research on radiographic soft tissue thickness in other areas of research, there has been limited research on soft tissue thickness in the foot and ankle literature.28,36,41 Radiographic measurements of site-specific fat distribution have been established in other arthroplasties, with reported correlations to complications.26,28,31,34-36,38,41 However, our study is, to our knowledge, the first to demonstrate such an association in the context of TAA. In an abstract, Kalma et al 15 conducted a retrospective analysis on 197 patients and found there to be higher rates of wound healing and complications in patients with lower soft tissue at the surgical site, although it did not reach statistical significance. However, our study did not explore wound healing outcomes following TAA. Further research is warranted to fully elucidate the impact of soft tissue thickness on wound healing and other outcomes in TAA as sufficient soft tissue coverage of the prosthesis has been demonstrated to be important in managing wound healing complication. 11 Future studies should include an analysis of wound healing to better understand the impact of soft tissue on various postoperative outcomes.
The study has several important limitations that should be acknowledged. Although the data were prospectively collected, the study is retrospective in nature, which limits the conclusions that can be drawn. Additionally, our study did not include three-dimensional radiographic modalities such as magnetic resonance imaging or computed tomography. Nevertheless, it is important to note that standard care for patients undergoing TAA typically includes obtaining plain radiographs, which could improve the reproducibility of our study findings. The low rate of revision surgeries in our cohort (14 patients) may potentially limit the generalizability of our findings. With a small number of events, there is a risk of overfitting the logistic regression model, leading to inflated estimates of the predictive value of soft tissue thickness. Additionally, the small number of events may reduce the statistical power of the analysis, making it challenging to detect smaller but clinically significant effects. Therefore, caution should be exercised when interpreting the results, and further validation in larger cohorts is warranted to confirm the robustness of our findings.
Additionally, the study did not assess other potential risk factors for TAA failure, such as patient activity level or implant positioning. Our study encompassed a diverse array of primary prostheses, potentially introducing an additional variable influencing the necessity for revision TAA. The varied implants encompassed different designs, and some may have been in use longer than others. For instance, the STAR prosthesis was frequently observed in the revision TAA cohort, but this could merely reflect its status as an older implant compared with others in the cohort. Although we attempted to mitigate this by accounting for implant type and follow-up duration in our multivariable analysis, it is crucial to acknowledge this as a limitation. Further research incorporating these factors could provide a more comprehensive understanding of the predictors of revision TAA. Our measurements in this study were developed with an anterior approach in mind. Surgical techniques using a lateral approach to TAA would require additional radiographic measurements to be developed to help accurately assess the surgical site soft tissue thickness. Furthermore, ankles with edema may artificially increase soft tissue thickness. However, edema may pose similar challenges to a greater soft tissue thickness by disrupting normal architecture and making it difficult to align the implant. Cases with anterior osteophytes and obscured visualization of the lateral talus process present challenges in measuring the radiographic soft tissue thickness. Nevertheless, we present methods to address these challenges. Despite the potential difficulty in accurate measurement, interrater reliability statistics were excellent for both radiographic metrics.
Conclusion
We describe two novel radiographic markers of soft tissue thickness, easily obtained from routine preoperative lateral weight-bearing radiographs with excellent interrater reliability, that allow for a straightforward estimation of adipose tissue at the surgical site. We successfully demonstrated an association between these measurements, tibial tissue and talus tissue thickness, and revision TAA. These radiographic markers show promise as a valuable tool for evaluating the risk of the need for revision TAA in obese patients following primary TAA.
Supplemental Material
sj-pdf-1-fao-10.1177_24730114241255351 – Supplemental material for Association of Radiographic Soft Tissue Thickness With Revision Total Ankle Arthroplasty Following Primary Total Ankle Arthroplasty: A Minimum of 5-year Follow-up
Supplemental material, sj-pdf-1-fao-10.1177_24730114241255351 for Association of Radiographic Soft Tissue Thickness With Revision Total Ankle Arthroplasty Following Primary Total Ankle Arthroplasty: A Minimum of 5-year Follow-up by Kevin A. Wu, Albert T. Anastasio, Alexandra N. Krez, Katherine M. Kutzer, James K. DeOrio, Mark E. Easley, James A. Nunley and Samuel B. Adams in Foot & Ankle Orthopaedics
Footnotes
Ethical Approval
Ethical approval for this study was obtained after International Review Board approval (IRB Pro00111414).
Declaration of Conflicting Interests
The author(s) declared the following potential conflicts of interest with respect to the research, authorship, and/or publication of this article: James K. DeOrio, MD, reports consulting fees from Exactech. Mark E. Easley, MD, reports payment or honoraria for lectures, presentations, speakers’ bureaus, manuscript writing, or educational events and stock or stock options from Exactech, Inc. James A. Nunley, MD, reports consulting fees from Exactech, Inc. Disclosure forms for all authors are available online.
Funding
The author(s) received no financial support for the research, authorship, and/or publication of this article.
References
Supplementary Material
Please find the following supplemental material available below.
For Open Access articles published under a Creative Commons License, all supplemental material carries the same license as the article it is associated with.
For non-Open Access articles published, all supplemental material carries a non-exclusive license, and permission requests for re-use of supplemental material or any part of supplemental material shall be sent directly to the copyright owner as specified in the copyright notice associated with the article.