
Abstract
Background:
Diagnosis and management of neuropathic pain (NP) in foot and ankle patients remain challenging. We investigated the plausibility of using Patient-Reported Outcomes Measurement Information System (PROMIS) Neuropathic Pain Quality (PQ-Neuro) as an initial screening tool to detect NP and track the treatment effects.
Methods:
Patients with heel pain were prospectively recruited and grouped to no-NP, mild-NP, and severe-NP based on the initial PROMIS PQ-Neuro t scores. Pain Interference (PI), Physical Function (PF), and Self-Efficacy (SE) scores were evaluated at baseline, 30-day, and 90-day follow-up. Other factors such as age, smoking, body mass index (BMI), low back/neck pain, anxiety/depression, and medications were analyzed. Linear mixed modeling was used to assess the main effects of time and NP on PROMIS t scores, comparing minimal clinically important difference (MCID).
Results:
Forty-eight patients with mean age of 52.4 years were recruited. Using the PROMIS PQ-Neuro as the assessment tool, 33 patients (69%) were detected to have NP at baseline—23 (48%) mild and 10 (21%) severe. BMI was the only independent factor associated with NP (P = .011). Higher baseline PQ-Neuro t score was significantly associated with higher follow-up PQ-Neuro (P < .001), PI (P = .005), and lower SE (P = .04) across time points. Patients with NP showed lower PF at baseline with significantly less improvement in PF (3 vs 9.9, P = .035) and did not meet MCID.
Conclusion:
Baseline PROMIS PQ-Neuro ≥46 was significantly associated with worse PI and SE across all time points, with less clinically significant improvements in PF. Prevalence of NP in heel pain patients was high. The PROMIS PQ-Neuro may serve as a valuable tool for detection of NP and guiding clinical treatment decision pathways for heel pain patients.
Level of Evidence:
Level III, prospective cohort study.
Introduction
The prevalence of heel pain has been reported up to 42% in the general adult population and >1 million outpatient visits reported annually.4,20 Although most etiologies of heel pain are nociceptive in nature arising from mechanical injury, localized inflammation, degeneration of surrounding structures, and neuropathic etiologies of pain have been shown to portend worse prognoses and resistance to traditional treatment methods.6,7,18,25 Therefore, preoperative identification of neuropathic component of heel pain is important for surgeons when counseling patients or contemplating surgical intervention.
Prevalence of neuropathic pain (NP) has been reported to be 12.4% in patients undergoing foot and ankle surgery, and 23% in patients following open reduction internal fixation of ankle fractures.18,25 Several studies have suggested association of chronic NP with high body mass index (BMI), low back pain, neck pain, smoking, anxiety, depression, and history of pain or fibromyalgia.5,10,18,25 Accurately elucidating and classifying pain mechanisms responsible for neuropathic symptoms can be challenging. This challenge arises as diagnosis of neuropathic pain is predominantly subjective, and frequently based on variable clinical presentation of allodynia along the nervous distributions.
Several clinical tools have been developed to help identify NP, such as painDETECT and ID-Pain tools, or to evaluate response to treatment, such as the Neuropathic Pain Scale and Pain Quality Assessment Scale.9,12,13,17 However, currently there is no consensus on optimal tool for diagnosing and assessing NP. The Patient-Reported Outcome Measurement Information System (PROMIS) developed a short Neuropathic Pain Quality scale (PQ-Neuro) that accurately discriminates between individuals with NP vs non-NP conditions as well as among levels of NP severity. 2 This validated patient-reported questionnaire may represent a clinically feasible tool to both accurately screen for NP in patients, and reliably assess response to treatment over time. Because NP may play an important part in indicating surgery or counseling heel pain patients, we investigated the plausibility of using PROMIS PQ-Neuro as an initial screening tool to diagnose and monitor the clinical effects of treatment. Secondary outcomes were prevalence of neuropathic pain and associated risk factors.
Methods
This was a prospective cohort study investigating the patient-reported outcomes over time in patients presenting with heel pain to an outpatient orthopaedic foot and ankle clinic of a tertiary academic institution. The appropriate Institutional Review Board (IRB) approved the study for prospective collection and evaluation of PROMIS data.
All patients presenting with their first encounter of heel pain were prospectively enrolled between July 2019 and December 2020. Patients with any prior visit for heel pain, prior invasive procedures for heel pain, pediatric patients aged <18 years, those with previous foot surgery, and those who did not complete the enrollment questionnaire at the index visit were excluded. At the initial enrollment visit, patient demographic and clinical information were collected, including age, sex, BMI, smoking history, history of low back or neck pain, prior spine surgeries, diagnosis of anxiety or depression, and medications history. Mechanical stress factors were investigated. Clinical diagnosis of neuritis was made when hypersensitivity to touch was present with report of neuropathic pain symptoms, such as throbbing and burning pain. There were 9 patients who were diagnosed with plantar fasciitis alone, 7 patients diagnosed with neuritis alone, and 32 patients diagnosed with a combination of plantar fasciitis and neuritis. The PQ-Neuro score was used to determine NP status in this population with primarily clinical neuropathic pain.
Initial treatments generally included generic arch support, nonsteroidal anti-inflammatory drugs, activity modification, plantar fascia–specific stretching exercises (in those diagnosed with plantar fasciitis), over-the-counter transcutaneous electrical nerve stimulation (TENS) unit, and neuromodulators (gabapentin, topiramate, amitriptyline) as indicated. For patients who presented with symptoms and signs of neuritis, a low-dose gabapentin (100-300 mg/d) was initially tried and allowed to increase up to 900 mg/d as needed. If the patient had a history of side effects to gabapentin, we tried topiramate or amitriptyline as alternatives. Although some patients had tried initial noninvasive treatments prior to the visit, patients were counseled that conservative modalities remained first-line, and transition to more invasive modalities were reevaluated at each follow-up visit.
Patients were followed up at 30 and 90 days in clinic or via phone survey. Patients were administered PROMIS PQ-Neuro, Pain Interference (PI), Physical Function (PF), and Self-Efficacy (SE) questionnaires at the initial visit, 30-day, and 90-day follow-up time points using computer adaptive testing (CAT) via a custom platform application by trained research staff. 15 The PROMIS PQ-Neuro measure assesses the presence and severity of NP, the PI measure assesses the extent to which pain impacts daily life, the PF measure assesses function and capabilities in activities of daily living, and the SE measure assesses confidence in one’s ability to successfully perform specific tasks or behaviors.1,2,16,22,24 Lower t scores in the PQ-Neuro and PI measures meant better outcomes, and higher t scores in the PF and SE measures meant better outcomes. The baseline PROMIS PQ-Neuro t score was used to identify those with and without baseline NP. A t score of ≥46 was used to identify NP based on preliminary distribution analysis of our patient sample and analysis reported in the initial PROMIS PQ-Neuro validation study. 2 Although the study design was deemed not adequately powered to further stratify those with NP to “mild” and “severe” NP groups, post hoc descriptive analysis was performed on those with PQ-Neuro t scores of 46 to 55 (mild-NP) and >55 (severe-NP) based on t-score distributions reported in the initial validation study. 2
Statistical Analysis
Data were analyzed with SPSS statistical software (IBM SPSS Statistics for Windows, version 27.0; IBM Corp, Armonk, NY). The analysis combines independent samples t tests for independent comparisons of continuous outcomes data, chi-squared analysis for comparisons between categorical variables, and a linear mixed model analysis for assessing repeated measures clinical data with varied follow-up points.
A fixed model with maximum likelihood estimation was used to determine differences between each time interval’s associated PROMIS PQ-Neuro, PI, PF, and SE t scores at baseline, 30-day, and 90-day follow-up. The factors included in the linear mixed model were time interval and whether the patient had or did not have NP at baseline. To assess the fit of the linear mixed model the Akaike and Schwarz’s Bayesian information criteria were used to select the covariance structure. The autoregressive heterogenous covariance structure was chosen for analysis. The main effect for NP indicates differences across all time points.
To establish appropriate improvement in the PROMIS t scores over time, the minimal clinically important difference (MCID) was calculated. The distributive method of estimating the MCID was used as previously described.11,19,26 Although multiple other methods of determining MCID exist, there is a paucity of studies determining MCID in the foot and ankle population for PROMIS PQ-Neuro and SE metrics. Therefore, the universal ½-SD method was used.
Results
Demographics and Comorbidities
A total of 48 patients completed all baseline surveys and were enrolled. Table 1 summarizes the demographic characteristics and select comorbidities of the study population. The overall mean age was 52.4 years, with 35 (73%) female patients. There were 15 (31%) patients with baseline PROMIS PQ-Neuro t scores <46, who were assigned into the “no-NP” cohort. The prevalence of those with NP (PQ-Neuro t scores ≥ 46) was 33 (69%): 23 (48%) in the “mild-NP” and 10 (21%) in the “severe-NP” subgroups. Although BMI comparison between no-NP group (mean 29.7) and NP group (mean 31.9) was not statistically significant (P = .304), when subcategorized into no-NP, mild-NP, and severe-NP groups, higher baseline NP was significantly associated with greater BMI (29.7, 29.9, and 37, respectively, P = .011). Other factors were not significantly different between those with and without NP (Table 1).
Patient Demographics and Baseline Characteristics. a

Abbreviation: BMI, body mass index.
Unless otherwise noted, values are n (%). Boldface indicates statistical significance at P < .05.
Patient-Reported Outcomes
All the initially enrolled patients were either contacted via the telephone or seen in clinic at the 30- and 90-day study follow-up. Of the 48 initially enrolled, 30 patients completed all PROMIS questionnaires at the 30-day follow-up, and 18 patients completed all PROMIS questionnaires at the 90-day follow-up.
The linear mixed model was used to account for the attrition rate by determination of patterns and effects. Overall, there were significant moderate effects of time on PI (P = .001), PF (P < .001), and SE (P = .011) (Table 2). Patients with heel pain in the study had significant improvements in PI, PF, and SE mean t scores over the 3 follow-up time points and tended to have mild improvement in PQ-Neuro over time that were not statistically significant.
Patient-Reported Outcomes Measures at Baseline, 30-Day, and 90-Day Follow-up Between Those With and Without Neuropathic Pain. a
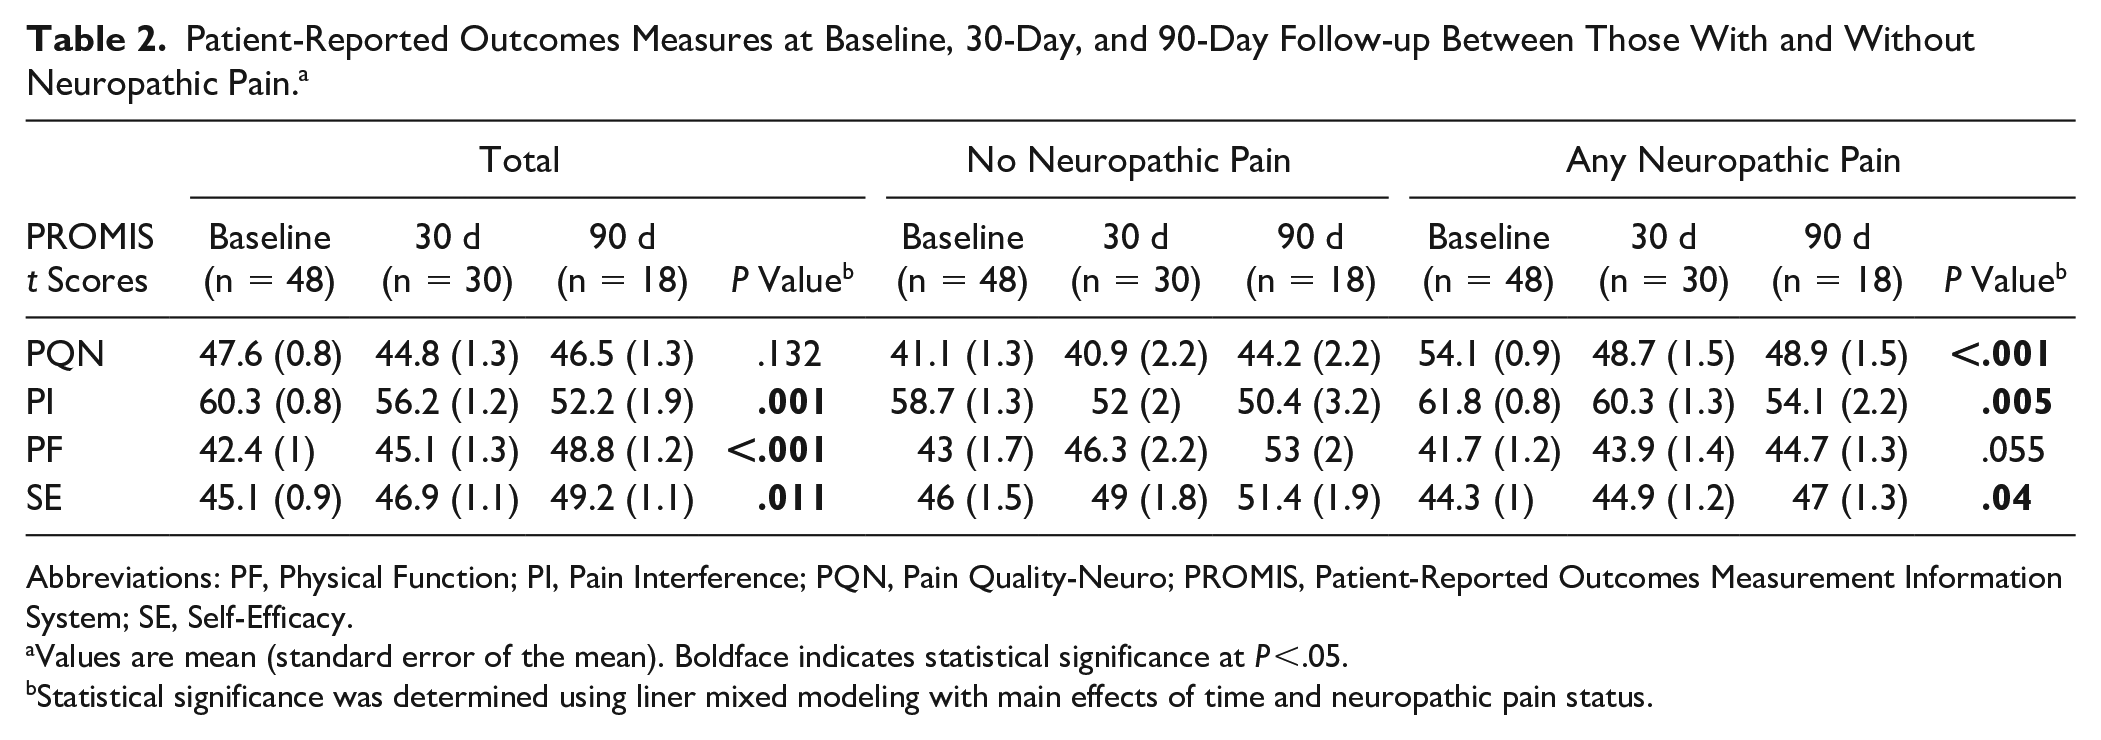
Abbreviations: PF, Physical Function; PI, Pain Interference; PQN, Pain Quality-Neuro; PROMIS, Patient-Reported Outcomes Measurement Information System; SE, Self-Efficacy.
Values are mean (standard error of the mean). Boldface indicates statistical significance at P <.05.
Statistical significance was determined using liner mixed modeling with main effects of time and neuropathic pain status.
In comparing PROMIS t scores of those with and without baseline NP, there was a significant main effect of baseline NP status over time noted for PROMIS PQ-Neuro, PI, and SE t scores. This meant that across the follow-up time points, a significant difference in the pattern of improvement was noted between those with and those without baseline NP.
The PQ-Neuro t score was included to track changes in neuropathic pain symptoms over time between those <46 and those ≥46 at baseline. There was an overall main effect of baseline NP status noted for PQ-Neuro t scores over time (P < .001) (Figure 1A). Interestingly, those with baseline NP (PQ-Neuro ≥ 46) improved in PQ-Neuro by 30 days (54.1-48.7) with sustained t score at 90 days (48.9), a total change of 5.2, which was significantly different from those without baseline NP (PQ-Neuro < 46) that started out with very low PQ-Neuro t scores (41.1) and had worsening of the mean t score by 90 days (44.2), a total change of 3.1 (P = .024) (Table 3). The MCID of PQ-Neuro was determined to be 3.6. Based on the mean difference, those with baseline NP with a mean t score change of 5.2 met MCID, whereas those without baseline NP with a mean t score change of 3.1 did not meet MCID.

All PROMIS domain t scores at baseline, 30-day, and 90-day follow-up periods for those with and without baseline neuropathic pain. (A) PROMIS PQ-Neuro trend over time. (B) PROMIS PI trend over time. (C) PROMIS PF trend over time. (D) PROMIS SE trend over time.
Comparison of Changes in PROMIS Scores Over 90 Days Between the Neuropathic Pain Groups. a

Abbreviations: NP, neuropathic pain; PF, Physical Function; PI, Pain Interference; PQN, Pain Quality-Neuro; PROMIS, Patient-Reported Outcomes Measurement Information System; SE, Self-Efficacy.
Boldface indicates statistical significance at P < .05.
PROMIS PI t-score patterns over time were significantly different between those with and without NP (P = .005) (Figure 1B). Those with baseline NP (PQ-Neuro ≥ 46) started out with higher baseline PI t scores that progressively improved by 30 and 90 days (61.8, 60.3, and 54.1, respectively), with an overall change of 7.8. Those without baseline NP (PQ-Neuro < 46) started out with lower baseline PI t scores that progressively improved by 30 and 90 days (58.7, 52, and 50.4, respectively), with an overall change of 8.3. Although the NP group had significantly higher pain scores throughout, both groups had similar changes in PI t score (P = .916). The MCID of PI was determined to be 4.4. Based on the mean difference, both those with and without baseline NP met MCID for PI.
PROMIS PF t-score patterns over time between the cohorts were not significantly different (P = .055) (Figure 1C). However, the level of improvement in PF t scores within each group differed significantly. Those with baseline NP (PQ-Neuro ≥ 46) started out with lower baseline PF t scores that improved less than the no-NP group by 30 and 90 days (41.7, 43.9, and 44.7, respectively), with an overall change of 3. Those without baseline NP (PQ-Neuro < 46) started out with higher baseline PF t scores that progressively improved by 30 and 90 days (43, 46.3, and 53, respectively), with an overall change of 10 (P = .035). The MCID of PF was determined to be 3.4. Based on the mean difference, those with baseline NP with a mean t-score change of 3 did not meet MCID, whereas those without baseline NP with a mean t-score change of 10 exceeded MCID.
PROMIS SE t-score patterns over time between the cohorts were significantly different (P = .04) (Figure 1D). Those with baseline NP started out with lower SE t scores that tended to improve less than those without NP by 30 and 90 days (44.3, 44.9, and 47, respectively), with an overall change of 2.7. Those without baseline NP started out with higher baseline SE t scores that progressively improved by 30 and 90 days (46, 49, and 51.4, respectively), with an overall change of 5.4 (P = .727). The MCID of SE was determined to be 2.5. Based on the mean difference, both those with and without baseline NP with mean t-score changes of 2.7 and 5.4 met MCID.
Discussion
To our knowledge, this is the first investigation to use the PROMIS PQ-Neuro tool to determine prevalence of neuropathic pain in foot and ankle patients, and the first to track changes in PROMIS PQ-Neuro, PF, PI, and SE t scores over time in those with and without neuropathic heel pain. We solely used the PROMIS PQ-Neuro for grouping NP vs no-NP patients. As NP is increasingly recognized as one of the main contributors of chronic foot and ankle pain, early detection and effective monitoring of NP is important in the treatment.
The PROMIS PQ-Neuro score is a simple and clinically feasible tool that has been shown to accurately screen for NP and reliably track outcomes over time. 2 The present study used the PROMIS PQ-Neuro t-score cutoffs of 46 and 55 after preliminarily finding natural breakpoints in the t-score distribution that resembled a trimodal curve. The cutoff of 46 was also determined as the cutoff for analysis based on the findings from previously published work. In the validation study by Askew et al, 2 the authors determined that the scale reliably differentiated those with and without NP, with mean t scores in those without NP reported at a mean t score of 45.64. The t-score distribution with a natural break at 46 in our study corroborated the results from the previous study, further supporting the utility of the PROMIS PQ-Neuro scale as a screening tool.
When assessed by the PROMIS PQ-Neuro, the prevalence of NP in the present study was 69%, whereas the prevalence of neuritis diagnosed in the study population was 81%; both of which were considerably higher than previously reported.8,10,18,23,25,28 Because the PROMIS PQ-Neuro tool was used to determine prevalence at a t score of >46, there remains a tradeoff between the higher sensitivity of capturing cases (>0.8) and the lower specificity (<0.7) based on the validation study. 2
The magnetic resonance imaging (MRI) study highlights the possibility of a high prevalence of underdiagnosed neuropathies of the lateral plantar nerve and respective branches. 21 In their study, 78% of female patients with chronic heel pain had evidence of lateral plantar nerve neuropathy, with plantar fasciitis as a strong determinant of nerve entrapment in up to 37.8%. In those presenting with heel pain, perhaps the prevalence of neuropathic pain is greater than previously thought. Additionally, as a tertiary care academic practice, we tend to see more patients who have been referred for heel pain treatment from outside institutions. This may have contributed to seeing a higher proportion of patients presenting with NP.
Previous studies have reported on the risk factors for neuropathic pain. Age, BMI, smoking, diabetes, low back pain, anxiety, depression, and prior foot surgeries were found to be associated with NP in the literature.3,14,18,25,27 In the present study, BMI was found to be associated with more severe NP, but the other risk factors were not statistically significant. Although the study may have been underpowered to detect a significant difference for the risk factors, those with NP had a relatively high prevalence of diabetes, smoking, anxiety, low back pain, and depression.
Patient-reported outcomes showed a trend toward improvement for all metrics when the patients were analyzed as a whole. Although those without baseline NP showed slight worsening of the PROMIS PQ-Neuro t scores over time, the scores remained below 46, indicating that they did not develop NP over time. Even so, those with NP consistently had worse mean PROMIS t scores in all metrics at all time points irrespective of the degree of improvement over time. The measure of general pain (PI) tended to improve at a similar rate in both groups by 90 days, though the patients with NP started out with much higher baseline PI t scores. Sidon et al 25 found that higher subjective pain levels were also associated with presence of NP symptoms. These results are in line with this finding, suggesting that the PROMIS PQ-Neuro and PI t scores may have correlations to painDETECT and visual analog scales. PF on the other hand showed that those with baseline NP did not improve in function as much as those without baseline NP. This is clinically relevant, as differentiating those with and without NP may inform functional prognosis, management decisions, and setting patients’ expectations.
There are several limitations of this study. First, this study was underpowered to subclassify those with NP into those with mild and severe NP due to high attrition rate by 90 days. However, the classification into no-NP and any NP showed significant differences that were clinically meaningful. Regarding the high attrition rate over the 90-day follow-up time frame, many patients did not answer the phone over the 3 attempts allowed by the IRB protocol. Although roughly equal percentages of patients in each group were lost to follow-up, there remains potential for introduction of bias because of the high attrition rates in both groups. To include as many data points as possible, the linear mixed model was used, as this statistical method identifies clinical patterns in the data to consider any missing data, because of random or nonrandom occurrence. Lastly, clinical diagnosis of NP is subjective, and the use of the PROMIS PQ-Neuro score to diagnose NP has not been clinically validated. However, the authors used the PQ-Neuro score as a proxy based on the original validation study because this was a readily available objective measurement for these patients and there are currently no standard diagnostic methods or consensus for diagnosis of NP in general. Future studies on larger patient populations and with comparisons between various outcomes tools to quantify NP and compare diagnostic strength of the tools would be of interest. Based on previous reports and present studies, we support that PROMIS PQ-Neuro ≥46 likely indicates presence of some component of NP.
Conclusion
The initial PROMIS PQ-Neuro t score may detect NP and serve to predict clinical improvement in PI, PF, and SE in heel pain patients. A high prevalence of baseline NP of 69% was found in patients presenting with an initial encounter of heel pain at a tertiary academic practice. Greater BMI was associated with higher PROMIS PQ-Neuro score. Although all patients had improvements in PROMIS PI, PF, and SE domains, those with baseline PQ-Neuro ≥46 were significantly associated with worse PI and SE across all follow-up time points, and less clinically significant improvements in PF. This study shows that the PROMIS PQ-Neuro score may be a simple and effective comprehensive tool to screen for NP and monitor outcomes over time for managing patients with potentially complex neuropathic heel pain.
Supplemental Material
sj-pdf-1-fao-10.1177_24730114231213620 – Supplemental material for Utilization of PROMIS Neuropathic Pain Quality for Detection and Monitoring Neuropathic Pain in Heel Pain Patients
Supplemental material, sj-pdf-1-fao-10.1177_24730114231213620 for Utilization of PROMIS Neuropathic Pain Quality for Detection and Monitoring Neuropathic Pain in Heel Pain Patients by Peter Y. Joo, Wonyong Lee, Samantha Hoffman, Judith Baumhauer and Irvin Oh in Foot & Ankle Orthopaedics
Footnotes
Ethical Approval
The appropriate institutional review board approved the study for prospective collection and evaluation of PROMIS data.
Declaration of Conflicting Interests
The author(s) declared no potential conflicts of interest with respect to the research, authorship, and/or publication of this article. ICMJE forms for all authors are available online.
Funding
The author(s) received no financial support for the research, authorship, and/or publication of this article.
References
Supplementary Material
Please find the following supplemental material available below.
For Open Access articles published under a Creative Commons License, all supplemental material carries the same license as the article it is associated with.
For non-Open Access articles published, all supplemental material carries a non-exclusive license, and permission requests for re-use of supplemental material or any part of supplemental material shall be sent directly to the copyright owner as specified in the copyright notice associated with the article.