
Abstract
Background:
Transitioning to a forefoot strike pattern can be used to manage running-related knee injuries. However, adopting a nonrearfoot strike induces a higher load on foot and ankle structures than rearfoot strike. Sufficient foot muscle strength is also necessary to prevent excessive longitudinal arch (LA) deformation when running with nonrearfoot strike. The aim of this study was to investigate the potential differences in foot-ankle muscle strength between RF and NRF runners.
Methods:
A cross-sectional study including 40 RF and 40 NRF runners was conducted. The foot posture and the maximal voluntary isometric strength (MVIS) of 6 foot-ankle muscles were measured. The footstrike pattern was determined using a 2-D camera during a self-paced run on a treadmill.
Results:
NRF had higher MVIS for ankle plantar flexor (+12.5%, P = .015), ankle dorsiflexor (+17.7%, P = .01), hallux flexor (+11%, P = .04), and lesser toe flexor (+20.8%, P = .0031). We found a small positive correlation between MVIS of ankle plantar flexor with MVIS of hallux flexor (r = 0.26; P = .01) and lesser toe flexor (r = 0.28; P = .01).
Conclusion:
In this cross-sectional study, we found that NRF runners on average have a higher MVIS of hallux and lesser toe flexor compared with RF runners. NRF runners also have a higher MVIS of ankle plantar flexor and dorsiflexor than RF runners. We found only a small correlation between ankle plantar flexor and foot muscle strength.
Level of Evidence:
Level III, case-control study.
Keywords
Introduction
The footstrike pattern is an important component of the running biomechanics. Footstrike pattern can be made with the heel first (rearfoot strike), the heel and the forefoot simultaneously (midfoot strike), or the forefoot first (forefoot strike). 27 As there are few runners with a midfoot and a forefoot strike, it is common to combine these two categories together as “nonrearfoot strike.” 22 It has been suggested that a nonrearfoot strike can reduce the vertical average loading rate (−49.7%), the vertical instantaneous loading rate (−41.7%), and the patellofemoral joint force (−12%).11,18 Consequently, transitioning to a forefoot strike pattern can be used as a component of a gait retraining intervention to manage running-related knee injuries. 2
However, transitioning to a forefoot strike pattern changes the loading location on the lower limb. 3 Nonrearfoot strike appears to increase the load on the ankle and the Achilles tendon, and increases the gastrocnemius activation. 3 In response to these biomechanical changes, there is an increase in the plantar flexor strength and the Achilles tendon cross-sectional area. 9 Similar to the ankle structures, there is also a greater loading and energy absorbed by the midfoot when running with a nonrearfoot strike comparatively to rearfoot strike. 24 This greater loading is associated with a higher foot arch deformation, plantar fascia loading, and an increase in the intrinsic foot muscles activation.7,24 It appears that activating the intrinsic muscles of the foot could prevent excessive deformation of the medial longitudinal arch and the associated increase in the plantar aponeurosis strain.24,25
Insufficient intrinsic foot muscle strength could therefore influence loading on the plantar aponeurosis in rearfoot runners undergoing a gait retraining intervention to adopt a nonrearfoot strike. 24 Based on the physiopathology of running-related injuries, abnormal plantar aponeurosis loading could expose runners to a greater risk of sustaining an injury. 30
The first aim of this study was to investigate whether there is a difference in the intrinsic and extrinsic foot-ankle muscle strength between rearfoot (RF) and nonrearfoot (NRF) runners. We hypothesize that NRF runners develop higher maximal voluntary isometric strength (MVIS) with their ankle plantar flexor, hallux flexor, and lesser toe flexor.6,17 The secondary objectives are to investigate whether foot posture is different between RF and NRF runners, and then to investigate the relationship between foot-ankle muscle strength and endurance running performance. Given the existence of a possible relationship between foot posture and foot muscle strength, we hypothesize that NRF runners possess a stiffer passive plantar arch than RF runners. 20 Finally, we also hypothesize that there is no relationship between foot and ankle muscle strength and endurance running performance. 39
Materials and Methods
Participants
The effect size required was estimated using the G*power software (version 3.1.9.2, Germany), with data from a preliminary investigation of ankle plantar flexor strength in RF (n = 10) and NRF (n = 10). A population size of 34 participants for each group was estimated to achieve statistical significance, for an expected effect size of 0.70 and power of 0.80 with an alpha level of 0.05. Data were collected from 40 RF runners (age = 25.5 ± 4.8 years; mass = 71.4 ± 10.1 kg; height = 1.76 ± 0.08 m) and 40 NRF runners (age = 25.2 ± 4.6 years; mass = 69.2 ± 7.6 kg; height = 1.75 ± 0.06) between the year 2021 and 2023. Eligibility criteria included age between 18 and 35 years, distance ran at least 20 km per week for at least 6 months, no running-related injuries in the 3 months prior to testing. Participants were also asked to report that they had not changed their footstrike pattern in the last 6 months. This study was approved by the local ethics committee of the Hospital Faculty (27/07/2021; protocol no. 2021/197).
Experimental Protocol
Participants filled out a questionnaire on their running level and training habits (age, running experience, training volume, running-related-injuries history, the personal best in a race of 10.000 m carried out in the last 6 months). Then, the examiner conducted a footwear assessment, a foot screening, a foot-ankle muscle strength assessment and a footstrike determination during a running protocol on a treadmill. Footstrike determination was done last to allow the examiner to perform the ankle-foot strength assessment and foot screening in a single-blind way.
Footwear Assessment
Minimalist footwear can improve foot-ankle muscle strength.6,17 Thus, the minimalist index of the running footwear has to be controlled for assessing the relationship between the footstrike pattern and foot-ankle muscle strength. The minimalist index of the 2 most frequently worn running footwear in the last 6 months of the participants were assessed. Minimalist index, based on a previous publication, was collected on the running clinic website (https://therunningclinic.com/shoes/). 12 If footwear was not referenced on the website, examiners assessed it according to the “minimalist index scale” including weight, stack height, drop, stability, motion control technologies, and longitudinal/torsional flexibility. Minimalist index ranges from 0% to 100%. Higher values indicated a more minimalist design (e.g., more flexible, lower weight, lower stack height, less stability/motion control technology, and/or smaller heel-toe drop). The highest value of the minimalist index was considered for each participant.
Foot Posture
The dominant leg was defined as the leg used to kick a ball. 38 The examiner conducted a foot screening of the dominant lower limb, including the “Foot Posture Index-6” (FPI-6) and a “Navicular Drop Test” (ND). Previous studies showed that there is a relationship between these tests and intrinsic foot muscle strength.21,31
The FPI-6 quantifies the posture of each foot via a total of 6 items. Thus, a total score between −12 and +12 is obtained (a greater positive score indicates a more pronated foot, and a greater negative score indicates a more supinated foot). 32
For the ND, the inferior border of the prominent tuberosity of the navicular bone was marked with a pen, and the distance to the ground was measured using a digital calliper (accuracy of 0.01 mm) with the participant seated and standing. The difference between the 2 measurements (sitting vs standing) was considered as the navicular drop. The examiner repeated the measure 3 times, and the average value was recorded. 37
Foot-Ankle Muscle Strength Assessment
A strength assessment of the ankle plantar flexor, ankle dorsiflexor, ankle invertor, ankle evertor, hallux flexor, and lesser toe flexor was performed on the dominant lower limb with a digital hand-held dynamometer (MicroFET2, Hoggan Health Industries, West Jordan, UT). These measurements were based on a previous study and done according to the “make test” method (Figure 1).16,35 Intraclass correlation coefficients of these strength measures are considered as excellent (0.76-0.88). 16 To limit the interference caused by the examiner, the hand-held dynamometer was fixed to a bar, adjustable in height. A belt was used to maintain the lower limb or the pelvis (in the hallux and lesser toe flexor assessments) on the table and to minimize compensations during the test. The lever arm was measured for ankle plantar flexor and ankle dorsiflexor between the lateral malleolus and the contact point of the hand-held dynamometer with the foot. The foot-ankle muscle strength assessment was performed in a randomized order.

Positions used to assess maximal voluntary isometric contraction with a fixed digital hand-held dynamometer: (A) ankle plantar flexor, (B) ankle dorsiflexor, (C) hallux flexor, (D) lesser toe flexor, (E) ankle invertor, and (F) ankle evertor.
Participants performed 2 familiarization trials for each muscle assessed. For each trial, they were instructed to gradually increase the strength developed on the dynamometer. They were verbally encouraged by the examiner during each muscle contraction and instructed to continue the contraction until the examiner saw a maximum value, which was typically after 3-5 seconds. Each trial was separated by 30 seconds of recovery to limit the effect of fatigue. The highest value of the 3 trials was recorded for each muscle assessed and reported in newton meters for ankle plantar flexor and ankle dorsiflexor. Considering the difficulty to accurately estimate the lever arm of hallux flexor, lesser toe flexor, ankle evertor and ankle invertor, their highest value was expressed in newtons. Each final strength value was normalized to body mass.
Running Protocol and Footstrike Determination
Finally, a running warmup of 8 minutes on a motorized treadmill (HP Cosmos Pulsar, Nussdorf-Traunstein, Germany) at participants’ own pace was performed. After the warmup, a video recording of 30 seconds with a high-speed camera sampling at 240 Hz was taken with participants running at a comfortable pace (based on the personal record in a 10 000-m run). A comfortable pace was chosen to properly represent the natural footstrike pattern of each runner. Frame-by-frame analysis with Dartfish (version Prosuite 10.0; Dartfish, Alpharetta, GA) allowed for the visual identification of each runner’s dominant leg’s footstrike pattern (landing on the ground with forefoot/midfoot or rearfoot) (Figure 2). The footstrike pattern assessment from a 2D video analysis has shown a very high level of reliability (ICC = 0.88). 29
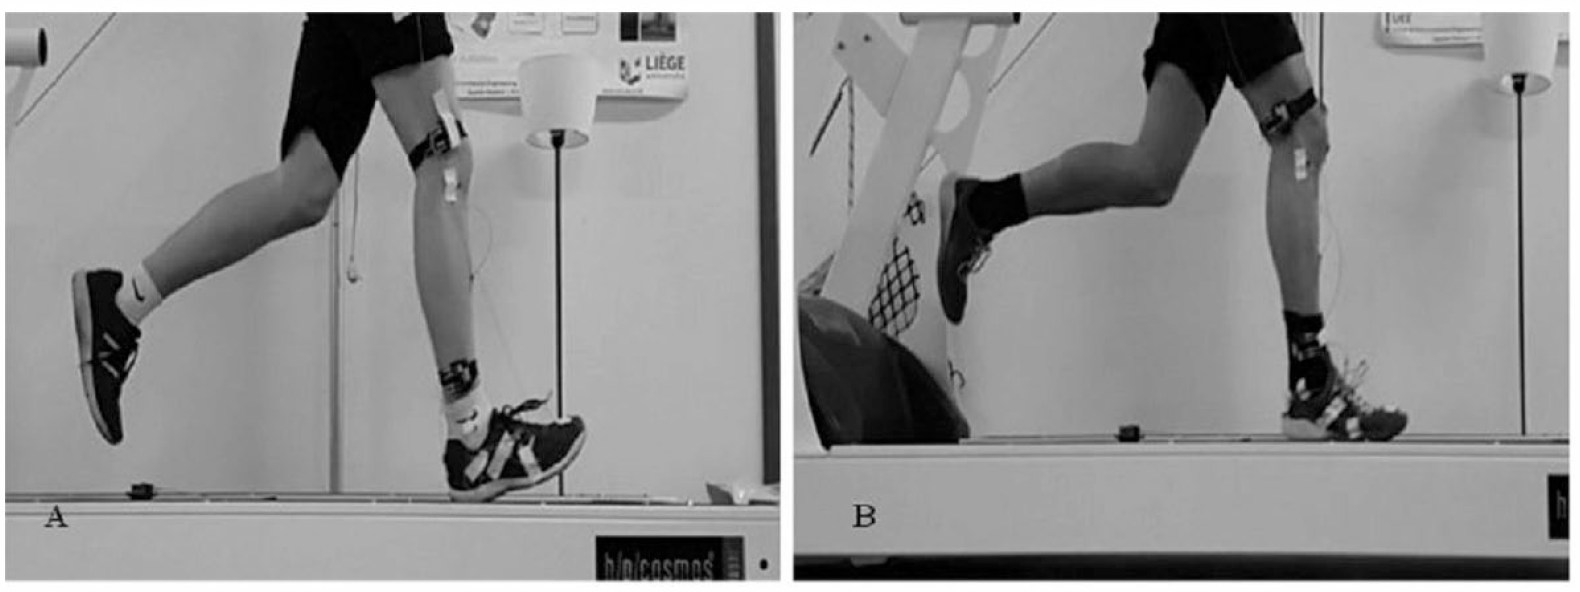
Footstrike pattern determination in using 2D video analyses: (A) an example of a rearfoot strike; (B) an example of a nonrearfoot strike.
Statistical Analysis
Normality conditions were verified using the Shapiro-Wilk test for quantitative variables such as individual characteristics (age, experience in running (years), training volume (hours), weekly mileage, personal best in 10 000 m [minutes]), a maximal voluntary isometric strength (MVIS) of each muscle group, FPI-6, ND, and the footwear’s minimalist index. Qualitative variables were categorized (such as the gender [0 = male; 1 = female], footstrike pattern [0 = RF; 1 = NRF]). A descriptive analysis of the sample was done (means and SD or median and percentile for quantitative variables according to the normality condition, number and frequency for qualitative variables).
An outlier detection was performed using the generalized extreme Studentized deviate test for the MVIS of each muscle. 33 Outliers detected were excluded from the statistical analysis. Student t test or Mann-Whitney test (according to the normality of each variable) were used to compare, respectively, the individual characteristics and the footwear’s minimalist index between RF and NRF, the maximal isometric strength of the ankle-foot muscles between RF and NRF, and the FPI-6 and ND between RF and NRF. The intraclass correlation coefficients (ICCs) were calculated for all the maximal isometric strength of the ankle-foot muscles and ND. ICC values less than 0.5 are indicative of poor reliability, values between 0.5 and 0.75 indicate moderate reliability, values between 0.75 and 0.9 indicate good reliability, and values greater than 0.90 indicate excellent reliability. 26
Effect sizes are presented as standardized mean differences (Cohen d), with ≤0.70 representing a small effect, >0.60 and <1.2 representing a moderate effect, and ≥1.2 representing a large effect. 23 The correlations of the MVIS between each muscles group were analyzed using a Pearson correlation. Likewise, the correlations between MVIS and the values of each foot screening tests (FPI-6 and ND) and between MVIS and personal best were also analyzed using a Pearson correlation. Correlations were classified as follows: small (0.1-0.3), moderate (0.3-0.5), large (0.5-0.7), very large (0.7-0.9), and extremely large (0.9-1.0). 23 Statistical analyses were performed using R (version 4.1.1; R Core Team). 15 An alpha level of 0.05 was used for all inferential statistics. However, a Benjamini and Hochberg 4 corrected significance level was calculated to limit the risk of type I group error in comparison tests. The corrected significance level for the Student t test or Mann-Whitney test was set to .031.
Results
Table 1 highlights an absence of differences in the individual characteristics relative to running level and training habits between RF and NRF runners. There was no difference in footwear minimalist index between the 2 groups.
Baseline Characteristics of the Participants.

Abbreviations: NRF, nonrearfoot strikers; RF, rearfoot strikers.
Mann-Whitney test.
Student’s t test.
The generalized extreme Studentized deviate test did not detect outliers for the MVIS of each muscle. Table 2 shows that NRF runners significantly achieved higher MVIS for ankle plantar flexor (+12.5%, P = .015; d = 0.53), ankle dorsiflexor (+17.7%, P ≤ .01; d = 0.61), hallux flexor (+11%, P = .013; d = 0.56), and lesser toe flexor (+20.8%, P ≤ .001; d = 0.88). NRF runners had a significantly less pronated feet (P = .02; d = 0.49) but a similar navicular drop (P = .04; d = 0.44) than RF runners. ICCs indicate that reliability of ankle plantar flexor (0.831), ankle dorsiflexor (0.766), hallux flexor (0.894), lesser toe flexor (0.883) strength, and ND (0.899) are good, whereas reliability of ankle evertor (0.686) and ankle invertor (0.634) are moderate.
Comparison of Foot-Ankle Muscle Strength, Navicular Drop, and Foot Posture Index Between Rearfoot Strikers and Nonrearfoot Strikers.

Abbreviations: ICC, intraclass coefficient correlation; N/A, not applicable; NRF, nonrearfoot strikers; RF, rearfoot strikers.
Student t test: P > .05, not significant.
P value for post hoc test inferior to .05.
There is a moderate positive correlation between MVIS of ankle plantar flexor with MVIS of ankle dorsiflexor (r = 0.42; P < .001) and a small positive correlation with MVIS of ankle invertor (r = 0.22; P = .04), hallux flexor (r = 0.26; P = .01), and lesser toe flexor (r = 0.28; P = .01). Likewise, there is a large positive correlation between MVIS of hallux flexor with MVIS of lesser toe flexor (r = 0.66; P < .001), a small positive correlation with MVIS of ankle evertor (r = 0.26; P = .01), and ankle invertor (r = 0.22; P = .04)
Pearson correlation showed that smaller ND was associated with higher MVIS of ankle evertors (r = −0.27; P = .01), ankle invertors (r = −0.29; P = .008), and lesser toe flexor (r = −0.35; P ≤ .001). In contrast, no association was found between FPI-6 and MVIS of foot-ankle muscles. Pearson correlation showed that personal best in 10 000 m (in minutes) was associated with higher MVIS of ankle plantar flexor (r = −0.31; P = .004), ankle dorsiflexor (r = −0.26; P = .01), and ankle invertors (r = −0.24; P = .02). No correlation was found between personal best in 10 000 m and hallux flexor (r = −0.13; P > .05) or lesser toe flexor (r = −0.21; P > .05).
Discussion
The primary aim of this study was to test for group differences in foot and ankle muscle strength between RF and NRF runners. The main finding of this research is somewhat greater MVIS of ankle plantar flexor, ankle dorsiflexor, hallux, and lesser toe flexor in nonrearfoot runners compared to rearfoot runners.
Our study highlights that NRF runners have stronger ankle-foot isometric muscle strength (except for evertors and invertors) than RF runners. Previous studies have also found stronger plantar flexor in NRF runners compared to RF runners. 28 Our results confirm these findings by assessing a high number of NRF runners (n = 40), while considering the runner’s level of performance and the minimalist index of each individual’s running footwear. Taking these 2 confounding variables into account appears relevant. Indeed, the personal best in 10 000 m appears to be correlated (r = −0.31) with maximal isometric ankle plantar flexor strength. Previous studies have also shown that minimalist footwear can increase ankle plantar flexor strength. 17
This is the first study to explore hallux and lesser toe flexor isometric strength in RF and NRF runners. Our study highlights that NRF runners appear to have stronger foot flexor muscles than RF runners. It may be true that the runner’s body adapts to the nonrearfoot strike, including an increase of the foot and ankle muscle strength. However, we found in our sample a relative heterogeneity in foot muscle strength in the NRF runners group: 35% of the runners had hallux flexor strength inferior to 2.5 N/kg and 27.5% had lesser toe flexor strength inferior to 2.0 N/kg (average values found for RF).
Gait retraining intervention involving a transition to a forefoot strike pattern is often used to reduce patellofemoral pain.1,10 In theory, this method allows to shift a part of the load imposed by running from the knee joint to the foot and ankle joint.10,24 Thus, adopting a nonrearfoot strike may require greater foot and ankle muscular capacity to support the higher plantar fascia loading and foot arch deformation. 7 According to the small correlation between ankle and foot muscle strength, it seems potentially relevant for clinicians to assess the foot and ankle muscles strength separately before a gait retraining intervention involving a transition to a forefoot strike pattern and consider implementing an individual strengthening program based on each runner’s specific muscle weakness of the foot and/or the ankle. Methods to improve the strength of the foot have been described including specific exercises (short foot, toe spread out, etc), running drills, neuromuscular electrical stimulation of the intrinsic foot muscles, or walking with minimalist footwear.1,37
In our cross-sectional study, higher isometric ankle plantar flexor, ankle dorsiflexor, and ankle invertor strength were associated with better performance in a race of 10 000 m. This result is not in agreement with a previous study that showed ankle plantar flexor strength is not associated with running performance. 39 However, a previous study highlighted the importance of the interaction between ankle plantar flexor and the function of the medial longitudinal arch to maintain the propulsive capacity during running. 14 Ankle invertors seem to play an important role in supporting the medial longitudinal arch. 34 Thus, it seems advantageous for a runner to be able to develop a high level of strength with ankle plantar flexor and ankle invertors to maintain propulsion and perform in running. Hallux and lesser toe flexor strength in our current work were found to have no correlation with personal best in the 10 000 m. This is in accordance with previous results showing that strengthening the foot muscles does not increase running economy. 8 However, these muscles are also important for propulsion, and some evidence of their role in running performance exists but only for shorter distances.13,20
Navicular drop showed a small to moderate correlation with lesser toe flexor, ankle invertor, and ankle evertor strength but no correlation with hallux flexor strength. In addition, no correlation was found between the foot-ankle muscle strength and the FPI-6. These findings are in accordance with those of a previous study that showed no relationship between FPI-6 and intrinsic foot muscle size. 36 Clinicians should be aware that the ND and FPI-6 might not provide a good insight into the runner’s foot muscle strength.
Our study has limitations that should be considered before generalizing the results. First, this is a cross-sectional study. We did not follow runners longitudinally before and after change in footstrike pattern and cannot specifically comment on what muscle activity and strengthening is required for a successful transition in footstrike pattern. Second, assessing position of maximal voluntary isometric contraction of hallux flexor and lesser toe flexor tries to reduce the participation of the extrinsic foot muscles, the intrinsic foot muscles are not completely isolated. 19 Moreover, we used a handheld dynamometer to assess foot muscle strength, but other methods such as the toe grip, the “doming,” or the paper grip test may yield different results.5,37 Isometric strength may not translate to activities of interest. Finally, footstrike pattern was not determined by the strike index method. which is the gold standard because our treadmill was not equipped with force plates. 22 However, determination of the footstrike pattern with a high-speed camera has already shown a high level of accuracy in comparison with the strike index method. 22
Conclusion
The main finding of this study is the higher average value of maximal voluntary isometric strength of hallux and lesser toe flexor in NRF runners compared with RF runners. NRF runners also have a higher MVIS of ankle plantar flexor and dorsiflexor than RF runners. There is only a small correlation between ankle plantar flexor and foot muscle strength.
Supplemental Material
sj-pdf-1-fao-10.1177_24730114231205305 – Supplemental material for Foot and Ankle Muscle Isometric Strength in Nonrearfoot Compared With Rearfoot Endurance Runners
Supplemental material, sj-pdf-1-fao-10.1177_24730114231205305 for Foot and Ankle Muscle Isometric Strength in Nonrearfoot Compared With Rearfoot Endurance Runners by Guillaume Abran, Cédric Schwartz, François Delvaux, Aude Aguilaniu, Stephen Bornheim and Jean-Louis Croisier in Foot & Ankle Orthopaedics
Footnotes
Acknowledgements
The authors would like to thank the Wallonia-Brussels Federation for its support.
Ethical Approval
Ethical approval for this study was obtained from the local ethics committee of Liege Hospital Faculty (27/07/2021; protocol No. 2021/197).
Declaration of Conflicting Interests
The author(s) declared no potential conflicts of interest with respect to the research, authorship, and/or publication of this article. ICMJE forms for all authors are available online.
Funding
The author(s) received no financial support for the research, authorship, and/or publication of this article.
References
Supplementary Material
Please find the following supplemental material available below.
For Open Access articles published under a Creative Commons License, all supplemental material carries the same license as the article it is associated with.
For non-Open Access articles published, all supplemental material carries a non-exclusive license, and permission requests for re-use of supplemental material or any part of supplemental material shall be sent directly to the copyright owner as specified in the copyright notice associated with the article.