
Abstract
Background:
With the increase in life expectancy, the prevalence of ankle osteoarthritis (OA) is also expected to increase in the future. Functional disability and diminished quality of life associated with end-stage ankle OA are comparable to those associated with end-stage hip or knee OA. However, there are few reports on the natural history and progression of patients with ankle OA. Hence, this study aimed to evaluate the risk factors for progression in patients with varus ankle OA.
Methods:
We evaluated 68 ankles from 58 patients diagnosed with varus ankle OA using radiography performed at intervals over at least 60 months. The mean follow-up period was 99 ± 40 months. Narrowing of the joint space and increasing osteophyte formation were defined as ankle OA progression. Multivariate analysis was performed using logistic regression to predict the odds of progression; the model included 2 clinical variables and 7 radiographic variables.
Results:
Of the 68 ankles, 39 (57%) progressed. In multivariable logistic regression analyses, patient’s age (odds ratio [OR] 0.92, 95% CI 0.85-0.99, P < .03), and the talar tilt (TT; OR 2.2, 95% CI 1.39-3.42, P = .001) were found to be independent factors for progression. The area under the curve (AUC) of the receiver operating characteristic curve for TT was 0.844, and the cutoff value was 2.0 degrees.
Conclusion:
TT was found to be a primary factor associated with varus ankle OA progression. The risk appeared higher in patients with a TT more than 2.0 degrees.
Level of Evidence:
Level III, retrospective case control study.
Introduction
Osteoarthritis (OA) is a degenerative joint disease that causes dysfunction, especially in the elderly, and affects more than 250 million people worldwide. 12 OA causes a decline in the quality of life, and increased health care costs impact economic productivity. With the recent increase in life expectancy, the prevalence of OA is also expected to increase and become a social problem.
Owing to the large number of patients, knee or hip OA has received considerable attention. In contrast, the prevalence of ankle OA is lower, affecting approximately 1% of the population. 1 Therefore, ankle OA has been neglected. However, mental and physical disability and diminished quality of life associated with end-stage ankle OA are reportedly comparable to those associated with end-stage hip. 3
The main etiology of ankle OA is intra-articular fracture, and its progression depends on the severity of injury.7,15 The other risk factors, including primary and secondary, were reported to be smoking, comorbidity of other joint disease, and high body mass index (BMI). 7 Varus ankle OA without prior trauma or a general disorder is rare. Chronic lateral instability of the ankle is thought to be one of the major causes of ankle OA, particularly on the medial side.4,6 Radiologic features of varus ankle OA include a characteristic varus deformity combined with the anterior opening of the tibiotalar joint and often hypoplasia of the medial malleolus.13,14
The decision regarding the surgical procedure is based on a comprehensive assessment of patient age, activity, and degree of deformity. Furthermore, in the advanced stage, joint-preserving surgery such as supramalleolar osteotomy is indicated.13,14 In the end stage, total ankle arthroplasty or ankle arthrodesis is indicated. Therefore, when starting treatment, it is useful to know the natural history of ankle OA and the risk factors for its progression to decide appropriate treatment. However, there are few reports on the risk factors for progression in patients with varus ankle OA. Hence, the purpose of this study was to evaluate the risk factors for progression of varus ankle OA.
Material and Methods
From April 1999 to December 2022, 68 ankles (8 male, 60 female) from 58 patients diagnosed with varus ankle OA who could be evaluated with radiography performed at intervals of at least 5 years were investigated in this study. Because ankle pain and other symptoms were not severe, the patients received conservative treatment using nonsteroidal antiinflammatory drugs only when needed. Diagnosis was made using conventional weightbearing ankle radiography for all patients, who were then graded using the Takakura-Tanaka classification. 14 Ankle OA with an angle of more than 0 degrees between the articular surfaces of the tibial plafond and talar dome on anteroposterior views (talar tilt [TT]) was defined as varus ankle OA. Patients with valgus ankle OA, traumatic ankle arthritis, and general disorders such as rheumatoid arthritis or Charcot neuroarthropathy were excluded from the study. Patients with a history of foot surgery, such as hallux valgus or flat feet, and patients with a history of surgery or conservative treatment for trauma of the ankle were also excluded. Data was collected from patient records.
The patients in groups stage 2, stage 3a, stage 3b, and stage 4 included 21, 32, 11, and 4 ankles, respectively.
Narrowing of the tibiotalar joint space and increasing osteophyte formation, including progressing the OA stage, were defined as ankle OA progression. As the clinical variables, patient’s age and BMI were evaluated. As the radiographic variables, the angles between the tibial shaft and articular surface of the tibial plafond on anteroposterior and lateral views (TAS and TLS), tibial shaft and medial malleolus (TMM), and TT were measured using weightbearing ankle radiographs (Figure 1A, B). The tibiofibular clear space at a level 1 cm proximal to the tibial plafond was evaluated using the anterolateral view (tibiofibular clear space [TCS]) (Figure 1C). Subluxation of the talus was confirmed in the lateral view (Figure 1D). All measurements in this study were evaluated by one of the authors (an orthopaedic foot surgeon with more than 10 years of training) at the first outpatient visit and final follow-up.

(A) The angles between the tibial shaft and the articular surface of the tibial plafond on anteroposterior view (TAS), and the articular surfaces of the tibial plafond and talar dome (TT) were measured from weightbearing anteroposterior ankle radiography. (B) The angles between the tibial shaft and the medial malleolus (TMM) were measured from weightbearing anteroposterior ankle radiography. (C) The angle between the tibial shaft and articular surface of the tibial plafond on lateral view (TLS) was measured using weightbearing lateral ankle radiography. (D) Syndesmosis condition at a level 1 cm proximal to the lateral side of the tibial plafond was evaluated on the anterolateral view (TCS). (C) Anterior subluxation of the talus was evaluated on the weightbearing lateral ankle radiography.
Statistical Analysis
Sample size was determined after power calculation. The minimum sample size was 70. Multivariate analysis was performed using logistic regression to predict the odds of progression of ankle OA. The model included patient age, BMI, Takakura-Tanaka classification, TAS, TT, TCS, TMM, TLS, and anterior subluxation of the talus. We reported odds ratios (ORs) with 95% CIs. A P value of less than .05 was considered statistically significant across all statistical analyses. The sensitivity and specificity of the receiver operating characteristic (ROC) curve and area under the curve (AUC) were calculated for significant variables using multivariable logistic regression. The cutoff value was calculated based on sensitivity and specificity. All analyses were performed using IBM SPSS, version 26.0 (IBM Corp, Armonk, NY).
The TAS, TT, TCS, TMM, and TLS were compared between the first outpatient visit and final follow-up. First, the normal distribution of data was evaluated using an F test. After the data were confirmed to be normally distributed, the Student t test was used to compare the data. A P value <.05 was considered to be statistically significant.
Results
The average patient age, BMI, and follow-up period were 64 ± 11 years, 25 ± 4.4, and 99 ± 40 months, respectively. Of the 68 ankles, 39 (57%) progressed to OA during the follow-up period. Takakura-Tanaka classification and the radiographic parameters of the patients during the study period are described in Tables 1 to 3. No statistically significant differences were observed during the study period.
Seven Radiographic Variables.
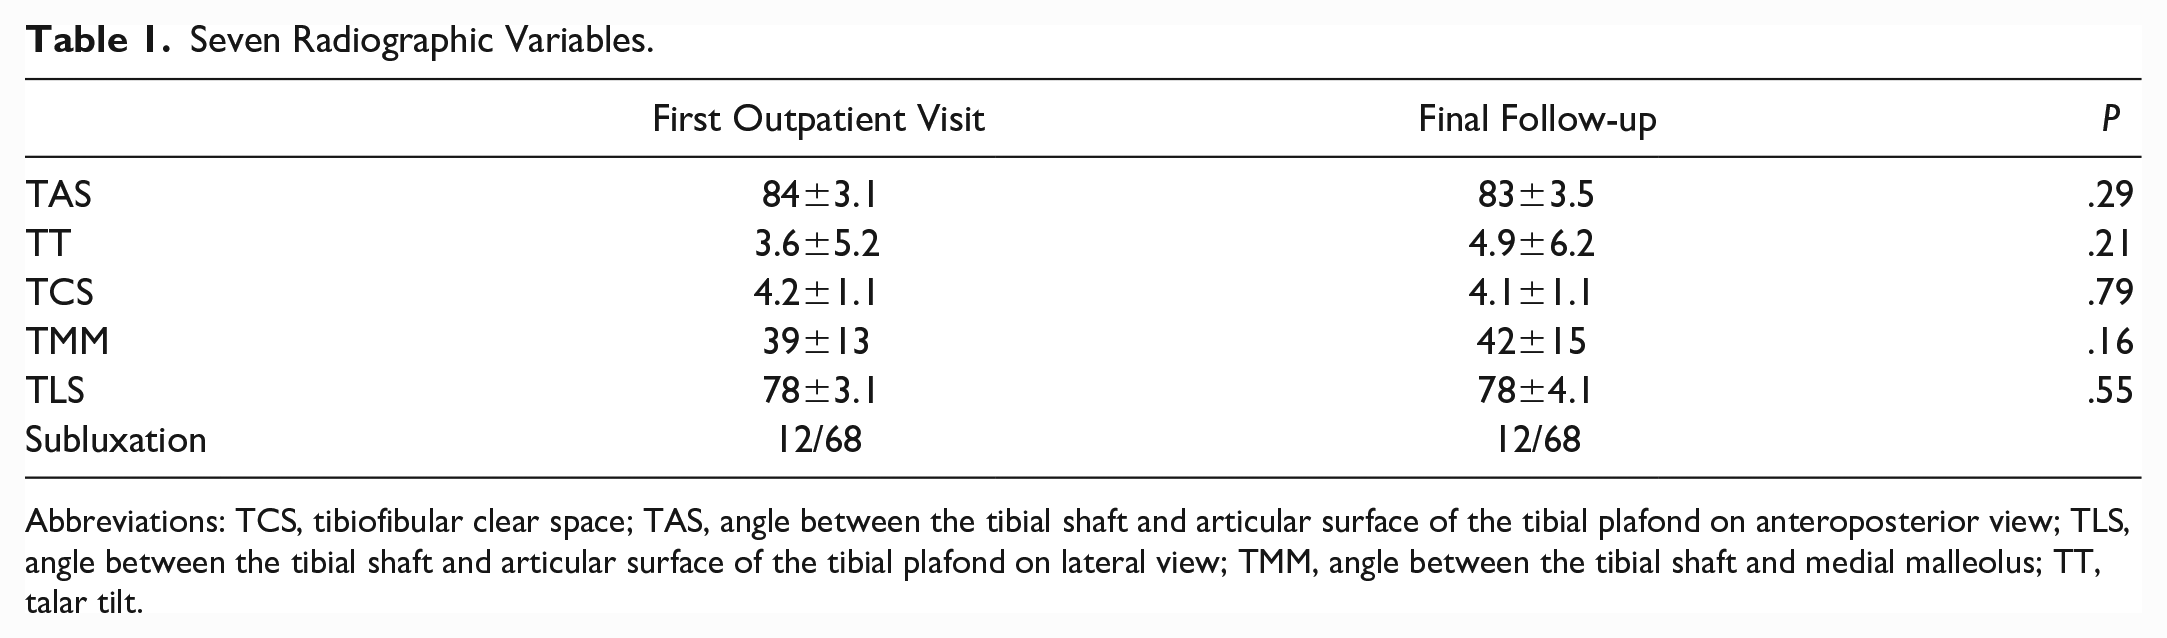
Abbreviations: TCS, tibiofibular clear space; TAS, angle between the tibial shaft and articular surface of the tibial plafond on anteroposterior view; TLS, angle between the tibial shaft and articular surface of the tibial plafond on lateral view; TMM, angle between the tibial shaft and medial malleolus; TT, talar tilt.
Characteristics of the 2 Groups According to the Progression of Ankle OA.
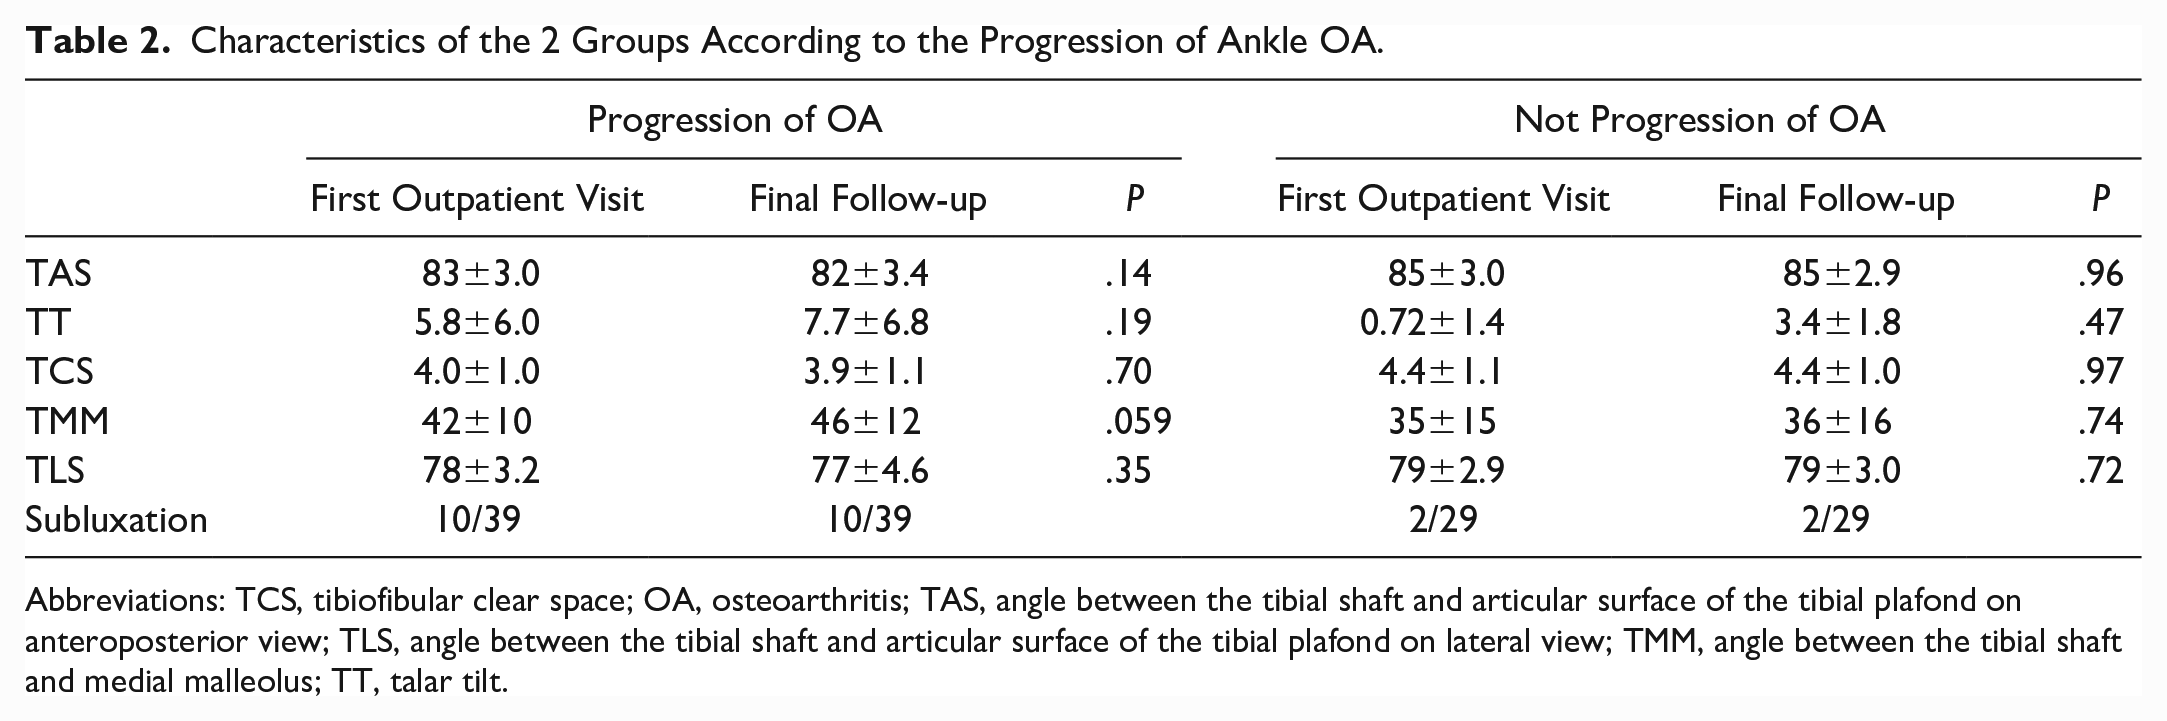
Abbreviations: TCS, tibiofibular clear space; OA, osteoarthritis; TAS, angle between the tibial shaft and articular surface of the tibial plafond on anteroposterior view; TLS, angle between the tibial shaft and articular surface of the tibial plafond on lateral view; TMM, angle between the tibial shaft and medial malleolus; TT, talar tilt.
Takakura-Tanaka Classification.

Patient age and TT were found to be factors affecting the progression of varus ankle OA (Tables 4 and 5). Patient age was an independent protective factor for the progression of ankle OA. In contrast, TT was a risk factor according to the multivariate logistic regression analysis. The ROC curve was made about the patient age and TT. The AUC for patient age was 0.649 (95% CI 0.516-0.783), and the cutoff value was 67 years, with a sensitivity of 0.769 and a specificity of 0.552. From this result, the patient age may not be useful in determining the cutoff values for the progression of ankle OA. However, the AUC for TT was 0.844 (95% CI 0.754-0.933), and the cutoff value was 2.0 degrees with a sensitivity of 0.769 and a specificity of 0.828 (Figure 2).
Patient Age and TT as Factors Affecting the Progression of Ankle OA.

Abbreviations: OA, osteoarthritis; OR, odds ratio; TT, talar tilt.
Results of the Other Variables.
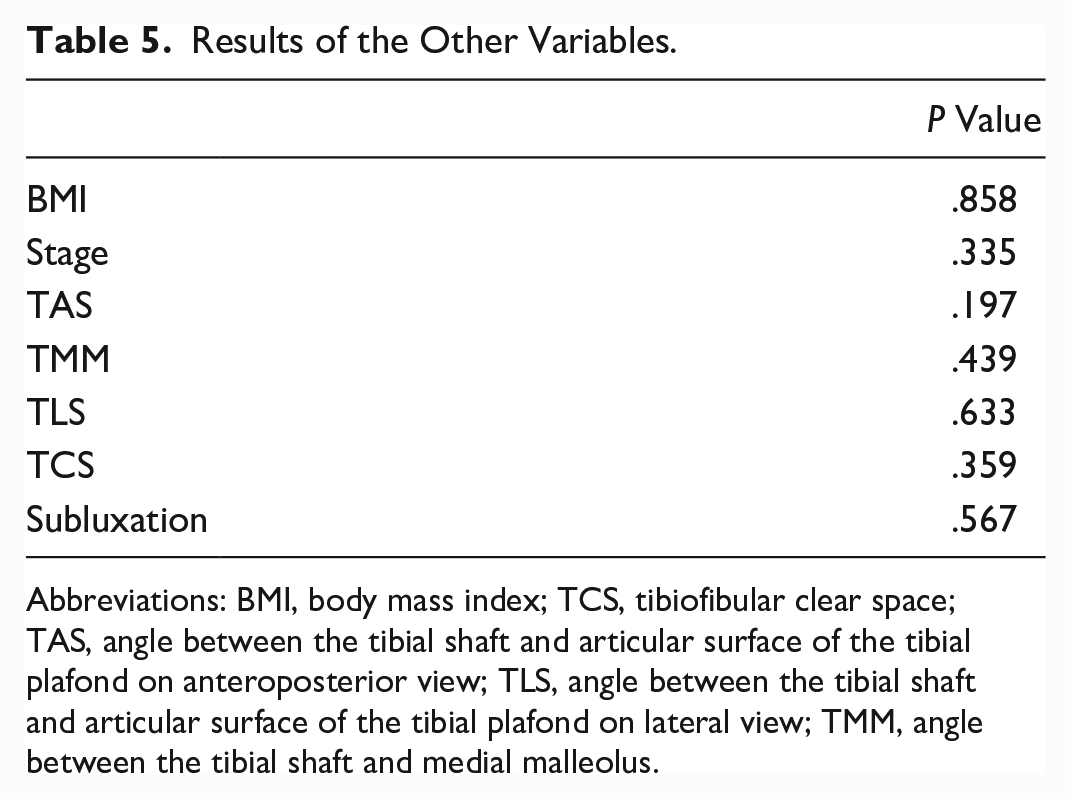
Abbreviations: BMI, body mass index; TCS, tibiofibular clear space; TAS, angle between the tibial shaft and articular surface of the tibial plafond on anteroposterior view; TLS, angle between the tibial shaft and articular surface of the tibial plafond on lateral view; TMM, angle between the tibial shaft and medial malleolus.

The area under the receiver operating characteristic curve for talar tilt was 0.844 (95% CI 0.754-0.933), and the cutoff value was 2.0 degrees with a sensitivity of 0.769 and a specificity of 0.828.
Discussion
In this study, we evaluated the risk factors in the natural history of varus ankle OA, which has rarely been reported previously. We found that patient age and ankle malalignment affect the progression of varus ankle OA.
With regard to the knee joint, the same weightbearing joint as the ankle joint, the risk factor of progression was reported to be patient age. 8 In patients with medial meniscus posterior root tear of the knee, who were treated conservatively, the risk of progression decreased over 64 years of age (P = .028; OR 0.87, 95% CI 0.77-0.98). The AUC for patient age was 0.72 (95% CI 0.754-0.933) with a sensitivity of 0.680 and a specificity of 0.706. 8 Similarly, Li et al 11 reported on the relationships between the femorotibial angle and knee OA. They found that a more than 4.5-degree varus or a more than 3.6-degree valgus in the femorotibial angle at the first outpatient visit were risk factors for knee OA progression at the 8-year follow-up.
The risk factors for the progression of ankle OA, including primary and secondary, were reported to be smoking, ankle trauma, comorbidity of other joint disease, and high BMI at the 2- to 5-year follow-up. 7 In 4% of patients, the Kellgren Lawrence grade worsened by more than 1 grade on the radiograph, and in 1.2% of patients it worsened symptomatically. 7 The risk factors for progression of secondary ankle OA are naturally dependent on the original disease. For example, traumatic ankle OA is influenced by severity of trauma, whereas ankle arthritis due to rheumatoid arthritis is influenced by disease activity. Risk factors change according to the original pathology. In this study, only patients with primary varus ankle OA without the past history of trauma were included, and one of the risk factors for the progression was TT, that is, malalignment of the ankle. The cutoff point for TT was 2.0 degrees. Ankle OA did not progress in patients whose alignment was maintained.
Therefore, it is necessary to consider why the TT was higher in some patients because if we can prevent TT from increasing, we may be able to prevent the progression of ankle OA. In a previous study on the relationship between TT and syndesmotic condition in patients with varus ankle OA, 10 the syndesmotic condition affected the varus deformity represented by TT. OA at the syndesmosis prevents anatomical motion and may cause varus deformity of the ankle, especially in Takakura-Tanaka stages 3a and 3b. Lateral ligament instability and varus inclination of the tibial plafond were the triggers for ankle OA, 10 and syndesmotic OA may cause progression of the varus deformity with higher TT. 10 There may be a possibility to improve TT by treating syndesmosis correctly; however, there is no research to support this.
In another study, the compensatory function of the subtalar joint in patients with varus ankle OA was mentioned.5,9 The talus had a varus deformity with adduction. Compensatory function in the coronal plane was sustained even in advanced stages. As the varus deformity of the ankle joint progresses, the simultaneous compensatory function (valgus inclination) of the subtalar joint prevents concentrating weightbearing stress on the medial side of the ankle.5,9 However, the breakdown of this compensatory function leads to varus inclination of the subtalar joint. The medial stress concentration in the ankle increases, and varus ankle OA progresses to the end stage. These reports suggest that proper evaluation of the syndesmosis and subtalar joint is important to prevent the progression of varus ankle OA. As this study does not include 3-dimensional syndesmosis evaluation or a subtalar joint evaluation, further study was needed to compare and discuss the results of previous studies.
This study had several limitations. First, TT more than 2.0 degrees was found to be a risk factor for ankle OA progression; however, the trigger for a higher TT was not known. Further studies are required to clarify this. Second, although radiographic evaluation was performed using radiographs, the accuracy and reproducibility of radiographs are lower than those of the 3D imaging modalities. 2 One surgeon measured the angle once, there was no further analysis of the interobserver or intraobserver reliability. Third, only ankle alignment was evaluated, and the conditions of the forefoot, subtalar joint, knee, and hip were not taken into account in this study. Fourth, patients treated surgically during the follow-up period within 5 years were excluded from this study, and none of these patients were evaluated. The sample size was small for the logistic regression analysis.
Surgical indications, such as supramalleolar osteotomy, ankle arthrodesis, or total ankle arthroplasty, are determined based on the patient age and degree of deformity. If the progression of ankle OA can be predicted, it is easier to select treatment that meets the patient’s needs. For examples, if ankle OA will not progress to the end stage, conservative treatment may be desired, or if progression will be predicted, early surgery may be desired. Therefore, the ability to predict ankle OA progression is of great clinical significance. To our knowledge, this is the first clinically meaningful study to report the risk factors for the progression of varus ankle OA.
In conclusion, we found that TT was a primary factor associated with progression of varus ankle OA. The risk of progression appeared higher in patients with more than 2.0 degrees of TT.
Footnotes
Ethical Approval
This study was approved by the institutional review boards of our affiliated institutions. An opt-out statement regarding the application of medical data was published on our institute’s website. This study was performed in accordance with the principles of the World Medical Association Declarations of Helsinki.
Declaration of Conflicting Interests
The author(s) declared no potential conflicts of interest with respect to the research, authorship, and/or publication of this article. ICMJE forms for all authors are available online.
Funding
The author(s) received no financial support for the research, authorship, and/or publication of this article.