
Abstract
Background:
Ankle arthroplasty has emerged as a viable alternative to ankle arthrodesis due in large part to recent advancements in both surgical technique and implant design. This study seeks to document trends of arthroplasty and arthrodesis for ankle osteoarthritis in New York State from 2009-2018 in order to determine if patient demographics play a role in procedure selection and to ascertain the utilization of each procedure and rates of complications.
Methods:
Patients 40 years and older from 2009-2018 were identified using International Classification of Diseases, Ninth and Tenth Revisions (ICD-9 and ICD-10), Clinical Modification (CM) diagnosis and procedure codes for ankle osteoarthritis, ankle arthrodesis, and ankle arthroplasty in the New York statewide planning and research cooperative system database. A trend analysis for both inpatient and outpatient procedures was performed to evaluate the changing trends in utilization of ankle arthrodesis and ankle arthroplasty over time. A multivariable logistic regression was used to assess the odds of receiving ankle arthrodesis relative to ankle arthroplasty. Complications were compared between inpatient ankle arthrodesis and arthroplasty using multivariable Cox proportional hazards regression.
Results:
A total of 3735 cases were included. Ankle arthrodesis increased by 25%, whereas arthroplasty increased by 757%. African American race, federal insurance, workers compensation, presence of comorbidities, and higher social deprivation were associated with increased odds of having an ankle arthrodesis vs an ankle arthroplasty. Compared with ankle arthroplasty, ankle arthrodesis was associated with increased rates of readmission, surgical site infection, acute renal failure, cellulitis, urinary tract infection, and deep vein thrombosis.
Conclusion:
Ankle arthroplasty volume has grown substantially without a decrease in ankle arthrodesis volume, suggesting that ankle arthroplasty may be selectively used for a different population of patients than ankle arthrodesis patients. Despite the increased growth of ankle arthroplasty, certain patient demographics including patients from minority populations, federal insurance, and from areas of high social deprivation have higher odds of receiving arthrodesis.
Level of Evidence:
Level III, retrospective cohort.
Introduction
Ankle osteoarthritis is a debilitating condition, with breakdown of tibiotalar joint cartilage and underlying bone leading to pain, stiffness, difficulty walking, and diminished quality of life. The physical disability caused by ankle arthritis has been compared to end-stage renal disease and congestive heart failure. 21 End-stage ankle osteoarthritis can be treated surgically with ankle fusion or ankle replacement. Ankle arthrodesis, or fusion, has long been the gold standard for management of advanced ankle osteoarthritis with reliable symptom improvement. 14 Ankle arthroplasty, or replacement, has emerged as a viable alternative to treating ankle osteoarthritis due in large part to recent advancements in both surgical technique and implant design. 9 Improved implant survivorship as well as broader interest in the orthopaedic community has increased the prevalence of arthroplasty, with the ultimate goal of providing patients with improved physiologic joint function and equivalent pain reduction compared with arthrodesis. 11
Ankle arthrodesis is more commonly performed for end-stage ankle arthritis throughout the United States, whereas ankle arthroplasty is a more specialized procedure often performed at higher-volume academic centers. 4 The appropriateness of total ankle arthroplasty vs arthrodesis remain controversial because of the lack of available literature on the long-term outcomes of current-generation prostheses and debate regarding the risk-benefit analysis of each procedure. 13 The decision regarding arthroplasty vs arthrodesis is often based on individual patient characteristics and functional demands.
Considering the lingering questions regarding ankle fusion vs arthroplasty, there is a clear need to study both the utilization of each procedure and their associated complications. Using data from the New York Statewide Planning and Research Cooperative System (SPARCS) database, this study aimed to document rates of arthroplasty and arthrodesis for ankle osteoarthritis in New York State from 2009 to 2018 in order to determine if patient demographics play a role in procedure selection and to ascertain the utilization of each procedure and rates of complications.
Methods
Patients were identified in the New York Statewide Planning and Research Cooperative System (SPARCS) database from 2009 to 2018. SPARCS is a comprehensive all-payer database collecting outpatient (emergency department, ambulatory surgery, and hospital-based clinic visits) and all inpatient claims in New York State. This includes International Classification of Diseases (ICD) diagnosis codes and ICD / Current Procedural Terminology (CPT) procedure codes associated with all visits. Inpatient claims were first identified using the ICD-9-Clinical Modification (CM) and ICD-10-CM ankle osteoarthritis diagnosis codes (see Supplemental Table S1; this includes primary osteoarthritis, posttraumatic osteoarthritis, secondary osteoarthritis, and osteoarthrosis). Claims were then filtered by ICD-9-CM and ICD-10 Procedural Coding Systems (PCS) procedure codes to isolate patients who went on to receive an ankle arthrodesis or ankle arthroplasty (see Supplemental Table S2 for codes used). Only a patient’s first operation was considered eligible for follow-up.
A trend analysis for both inpatient and outpatient procedures was performed to determine if there was a shift toward either ankle arthrodesis or ankle arthroplasty over time. After removing patients with incomplete data, patient demographics were reviewed on a univariate and multivariate level to determine the relative use of ankle arthrodesis and arthroplasty among different populations. For analysis of complications, inpatient cases were isolated to ensure a more homogeneous patient population and postoperative care. Patients who were residents of New York were followed up to a maximum of 1 year postoperatively. The 1-month, 3-month, and 12-month risks of interest were as follows: readmission, urinary tract infection, acute renal failure, cardiorespiratory arrest, pneumonia, acute stroke, surgical site infection, deep vein thrombosis, acute respiratory failure, pulmonary embolism, cellulitis, wound complications, in-facility mortality, and revision surgery (see Supplemental Table S3 for codes used). SPARCS claim dates are listed as the first day of the month in which the service occurred due to SPARCS deidentification policy. Therefore, if a complication occurred within the same month as the primary procedure, the time to complication was defined as 0.5 months. Using the same inpatient cohort, a length of stay analysis was performed to determine which populations were at risk of increased inpatient length of stay.
Statistical Analyses
For the trend analysis, the proportion of ankle arthrodesis and ankle arthroplasty was calculated for each year, 2009-2018. A univariate linear regression model was used to determine if there was a shift in proportions over time, with the difference in proportion as the dependent variable and year as the independent variable.
Patient demographics were compared using χ2 analysis. t tests were used for comparing sample means and Mann-Whitney U tests were used when appropriate when continuous data were found to be not normally distributed. A multivariable analysis was performed using logistic regression to predict the odds of receiving ankle arthrodesis relative to ankle arthroplasty. The model included patient age, sex, race, ethnicity, Charlson Comorbidity Index (CCI), primary insurance type, and social deprivation index (SDI).
For the complication analysis, multivariable Cox proportional hazards regression was used for the analysis of risk likelihood across the ankle procedure type. Each complication was modeled separately while controlling for ankle procedure type, patient age, sex, race, ethnicity, CCI, primary insurance type, and SDI. “Other” race excludes White, Asian, and African American but does include multiracial. Federal insurance includes Medicare, Medicaid, Veterans Affairs, and “other federal programs.” SPARCS began collecting outpatient hospital-based clinic visits in 2011; therefore, 2009 and 2010 were omitted from the complication analysis. To allow for a 1-year follow-up through 2018, only New York residents from 2011 to 2017 were modeled. The length of stay analysis was performed using a multivariable linear regression and included the same independent variables as the complication analysis.
The CCI was calculated using the method described by Deyo et al. 6 CCI was dichotomized to a score of 0 vs a score of ≥1. SDI as described by Butler et al 2 was linked to each patient based on zip code and is therefore a reflection of their geographic deprivation rather than individual deprivation. SDI was designed to identify areas in the greatest need of additional health care resources and provides a robust measure of social determinants of health not traditionally captured by health care administrative databases by converting the following categories to an index from 1 to 100: percentage living in poverty, percentage with less than 12 years of education, percentage single-parent household, percentage living in rented housing unit, percentage living in overcrowded housing unit, percentage of households without a car, and percentage nonemployed adults <65 years of age. A higher SDI score equates to greater social deprivation. SDI data in this study were based on 2015 statistics. 2
A P value <.05 was considered significant across all statistical analyses. All analyses were performed using SAS, version 9.4 (SAS Inc, Cary, NC).
Results
A total of 3735 cases were included in the trend analysis in years 2009-2018. The range per year for ankle arthrodesis over the study period was 184-274 for ankle arthrodesis and 42-360 for ankle arthroplasty (Figure 1). In 2009, 84% of procedures were ankle arthrodesis and 16% were ankle arthroplasty. By 2018, 43.2% were ankle arthrodesis and 56.8% were ankle arthroplasty (P < .0001). Over the study period, ankle arthrodesis increased by 25% whereas arthroplasty increased by 757% (Figure 1). The same trend was noted when isolating inpatient cases (Figure 2). Both arthrodesis and arthroplasty have increased steadily in the outpatient setting from 2009 to 2018 (Figure 3).
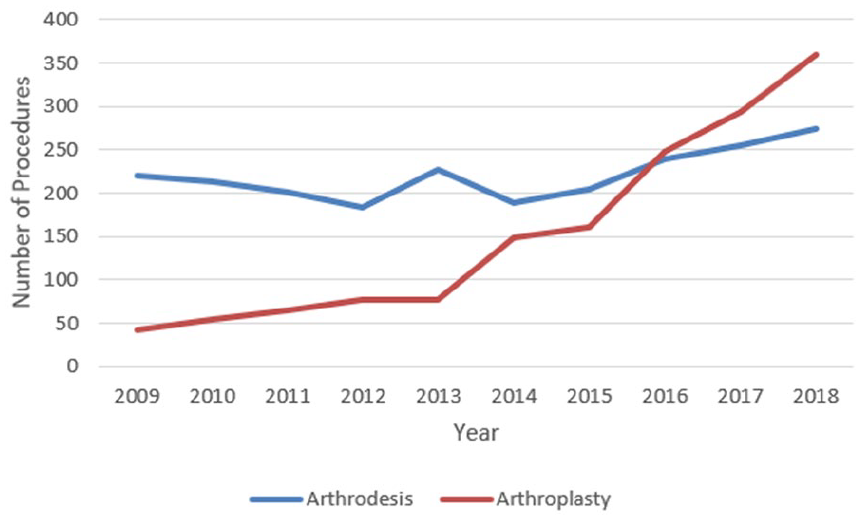
The total (combined inpatient and outpatient) number of ankle arthrodesis and arthroplasty cases in New York, 2009-2018.

The number of inpatient ankle arthrodesis and arthroplasty cases in New York, 2009-2018.

The number of outpatient ankle arthrodesis and arthroplasty cases in New York, 2009-2018.
A total of 2148 cases were included in a univariate demographics analysis. Patients undergoing ankle arthrodesis had a lower mean age and tended to be located in areas of greater social deprivation. Furthermore, patients undergoing ankle arthrodesis were more likely to be male or African American and to have 1 or more Charlson comorbidities. Patients undergoing ankle arthroplasty were more likely to be White (Table 1).
Patient Demographics and Characteristics, by Procedure.

Abbreviations: CCI, Charlson Comorbidity Index; SDI, social deprivation index.
Bold P Values are <.05.
The multivariable logistic regression analysis included the same 2148 cases and showed that older-age patients had decreased odds of receiving ankle arthrodesis. Male sex and African American patients had increased odds of ankle arthrodesis compared with female sex and White patients, respectively. Having federal insurance or workers compensation was associated with increased odds of ankle arthrodesis compared with private insurance. CCI score higher or equal to 1 was associated with increased odds of ankle arthrodesis. Lastly, being from an area of greater social deprivation was associated with increased odds of ankle arthrodesis (Table 2).
Multivariable Logistic Regression for the Odds of Receiving Ankle Arthrodesis.

Abbreviations: CCI, Charlson comorbidity index; CI, confidence interval; SDI, social deprivation index.
Compared to males.
Compared to White race.
Compared to non-Hispanic ethnicity.
Compared to private insurance.
Compared to CCI = 0.
Bold P Values are <.05.
The left side of Figure 4 illustrates how the SDI varied across New York zip codes, with darker areas representing greater social deprivation. The right side of Figure 4 illustrates the rate of ankle arthrodesis by zip code. As an example, western Long Island, which encompasses New York City and surrounding boroughs, represents higher SDI scores and higher rates of ankle arthrodesis.

Left: SDI by New York zip code. Gray zip codes had no ankle arthrodesis or arthroplasty cases during the study period. Right: Rate of ankle arthrodesis surgery by zip code. Gray zip codes had no ankle arthrodesis or arthroplasty cases during the study period. zip codes with a 0% ankle arthrodesis rate had a 100% ankle arthroplasty rate.
A total of 1462 patients were included in the inpatient complication analysis comparing ankle arthrodesis relative to ankle arthroplasty. Compared with ankle arthroplasty, ankle arthrodesis had increased 1-, 3-, and 12-month rates of readmission, acute renal failure, and cellulitis; increased 1-month rates of urinary tract infection; and increased 12-month rates of surgical site infection and deep vein thrombosis (Table 3).
Risk of Complication After Ankle Arthrodesis Vs Arthroplasty.

Abbreviation: NA, not analyzable.
Hazard ratios are adjusted for physician volume, age, sex, race, ethnicity, primary insurance type, Charlson comorbidity index and social deprivation index.
Bold P Values are <.05.
Using the same 1462 patients, a multivariable linear regression for length of stay showed those with federal insurance have an approximately 1-day longer stay compared to privately insured patients. Having a CCI score ≥1 was associated with an approximately 1-day longer stay than those without comorbidities. Those undergoing ankle fusion had an approximately 0.8-day longer length of stay compared to those undergoing arthroplasty (Table 4).
Multivariate Linear Regression for Length of Stay.

Abbreviation: CCI, Charlson comorbidity index.
Compared to White race.
Compared to private insurance.
Bold P Values are <.05.
Discussion
This study documents a slight increase in ankle arthrodesis in conjunction with a rapid increase in rates of ankle arthroplasty from 2009 to 2018 for ankle osteoarthritis. During this time period, proportion of ankle arthrodesis procedures fell from >80% to just 43.2% of all procedures while the proportion of arthroplasty rose from <20% to comprise >56.8% in 2018. Most of these relative changes were due to the significant arthroplasty increase, as ankle arthrodesis increased by 25% whereas arthroplasty increased by 757%. Ankle arthroplasty volume has grown substantially without a decrease in ankle arthrodesis volume, suggesting that ankle arthroplasty is drawing from a different population of patients than ankle arthrodesis patients. A net increase in the total volume of procedures for ankle osteoarthritis demonstrates an increasing trend toward surgical management, with arthroplasty emerging as the more common operative modality in the studied patient population. Seaworth et al, 23 a 2016 study also utilizing the SPARCS database, found that ankle arthroplasty in New York State had a better survival rate than national registries, potentially contributing to this shift, but that those survival rates were not yet on par with those of hip and knee replacement surgeries. Nationally, recent studies looking at data as recent as 2018 have tended to indicate that ankle arthrodesis rates remain considerably higher than those of arthroplasty, noting that the Northwest of the United States lags behind in arthroplasty rates considerably.4,18 Another study drawing from the SPARCS database as of 2014 found—as expected—higher rates of arthrodesis from 2005, but also noted that arthroplasty was practiced much more heavily in high-volume academic centers, whereas lower-volume facilities tended to favor arthrodesis. 3
The present study is demonstrative of the increasing utilization of total ankle arthroplasty. Improvements in implant design and operative technique have been supported in the literature, with foot and ankle surgeons growing more comfortable both promoting and performing the operation. These improvements led to the per capita usage of ankle arthroplasty increasing over 6-fold between 1998 and 2010, with a continued rise in prominence since that time. 17 Likewise, patients who are wary of the motion limitation of fusion and would previously have gravitated toward nonoperative management are now finding a commonly performed, motion-sparing alternative in arthroplasty. Though recent national data indicate that ankle arthrodesis remains more widely used across the United States, the present study demonstrates the effects that a growing interest in arthroplasty is having on both total operations and relative rates of the 2 procedures. 4 One potential explanation is that arthroplasty design and instrumentation have significantly improved in recent years and that arthroplasty provides improved functionality and mobility.20,22,25
Previous studies have argued that despite the increased cost of arthroplasty, it becomes more cost effective than arthrodesis and provides more quality-adjusted life years (QALYs) when indirect costs such as missed productive days at work are considered.5,15 Courville et al’s 5 2011 study found that although ankle arthroplasty was $20200 more expensive, it provided 1.7 additional QALYs as compared to arthrodesis. The cost differential between the procedures is corroborated by Jiang et al, which estimated the difference to be $24431. 12 This comes out to $11800 per QALY, which is well below the established benchmark of $100000 per QALY as a measure of cost-effectiveness. 5 Other studies have reinforced the validity of Courville et al’s 5 results—Nwachukwu et al 15 also found ankle arthroplasty to cost $14500 per QALY, and both studies argued that arthroplasty would be more cost-effective in younger patients. Although cost-effectiveness supports the rise in arthroplasty observed in New York State, it is less likely to be a motivating factor for physicians and patients when compared to the impact of improved implant design and surgical technique.
In terms of complications, patients with ankle arthrodesis had increased rates of readmission, acute renal failure, cellulitis, urinary tract infection, surgical site infection, and deep vein thrombosis. In contrast, SooHoo et al 24 found that arthroplasty was associated with increased rates of device-related infection and need for revision surgery, though their complications were assessed at 5 years postprocedure, whereas this study only documented up to 1 year from surgery. Other studies have agreed with SooHoo et al in finding increased rates of revision for ankle arthroplasty compared to arthrodesis years after the procedure,19,26 but that short- and intermediate-term complication rates are similar between the 2 procedures.12,16,26 However, higher rates of complications in patients undergoing fusion is not particularly surprising given higher comorbidity patients are more likely to be considered for arthrodesis, a trend that was observed in the present study. This also likely explains the relative increased length of stay following ankle fusion, as patients with greater comorbidities may stay longer for medical management as well as skilled nursing care placement.
Patients from zip codes with greater social deprivation index (SDI) scores were noted to have higher rates of ankle arthrodesis as compared to ankle arthroplasty, despite the significant increase in arthroplasty rates over time. These results were substantiated when evaluating insurance status as well, with those receiving federal insurance also being more likely to receive an ankle arthrodesis procedure. These results are consistent with those noted by Heckmann et al, the authors reported that patients with Medicaid tended to receive arthrodesis. 10 The socioeconomic factors contributing to these disparities are particularly complicated and difficult to elucidate. The cost of arthroplasty is one variable, which in one study was noted to be $20200 more than ankle arthrodesis as of 2011, though the effect that has on either patient or physician decision making may not be substantial. 5 Patients of lower socioeconomic backgrounds are more likely to be performing manual labor occupations, which makes them more ideal candidates for ankle fusion compared with ankle arthroplasty. This is compounded by a preference for arthrodesis in sicker and higher-comorbidity patients, both of which are well correlated to socioeconomic status. 7 The impact of racial and socioeconomic disparities on access to quality health care cannot be understated, as primary care physicians managing primarily African American patients have demonstrably greater difficulty referring patients to specialized surgeons. 1 Hospitals that serve higher proportions of non-White patients have fewer hip arthroplasty surgeons than those with lower concentrations. 8 It is reasonable to extrapolate that lower socioeconomic areas likely have more limited surgical options than those of more affluent populations. As with hip and knee arthroplasty, disparities in ankle arthroplasty utilization require ongoing study to better understand and address this area of health care inequality.
This study exhibits several limitations. Large-database studies are prone to biases that come with retrospective analysis of incomplete data sets. The use of a large database inherently requires accurate coding. Because this study evaluated outcomes for the same procedure across the database, any differences in reporting should be global and the large sample size should help minimize substantial changes to the observed outcomes. Moreover, there are several significant demographic differences between the cohorts included in this study such as patients undergoing arthrodesis having a lower mean age, higher likelihood of African American race, more comorbidities, and more likely to be from areas of higher social deprivation (Tables 1 and 2). However, we did attempt to control for these during our statistical analysis. Our study involved patients within the confined geographic zone of New York State via the SPARCS database. Therefore, national and global trends cannot be directly considered, possibly limiting appropriate extrapolation to other areas. However, New York is a large state composed of a highly variable population of patients, hospitals, and surgeons with a great degree of demographic variability and therefore may be generalizable to larger populations. 27 Another limitation of this study is that we limited the population to ankle osteoarthritis to gather a more homogenous patient population for analysis; however, there remain other indications for these surgeries such as inflammatory arthritis.
Conclusion
The trend toward ankle arthroplasty for the treatment of end-stage ankle osteoarthritis is relevant for both patients and providers. The present study demonstrates a substantial rise in ankle arthroplasty volume, with a relatively smaller increase in ankle arthrodesis volume. This and the deeper analysis performed herein suggests that distinct New York State patient populations are undergoing these procedures. Although we found that ankle arthrodesis was associated with increased rates of readmission, surgical site infection, deep vein thrombosis, and various other medical complications, ankle arthrodesis patients were more likely to have major medical comorbidities and racial or socioeconomic disparities.
Footnotes
Appendix
Diagnosis and Procedure Codes for Ankle Arthrodesis and Arthroplasty Complications.

| Complication | ICD-9-CM | ICD-10-CM / PCS | CPT |
|---|---|---|---|
| Revision | 81.11 81.56 | 0SGF04Z, 0SGF05Z, 0SGF07Z, 0SGF0JZ, 0SGF0KZ, 0SGF0ZZ, 0SGF34Z, 0SGF35Z, 0SGF37Z, 0SGF3JZ, 0SGF3KZ, 0SGF3ZZ, 0SGF44Z, 0SGF45Z, 0SGF47Z, 0SGF4JZ, 0SGF4KZ, 0SGF4ZZ, 0SGG04Z, 0SGG05Z, 0SGG07Z, 0SGG0JZ, 0SGG0KZ, 0SGG0ZZ, 0SGG34Z, 0SGG35Z, 0SGG37Z, 0SGG3JZ, 0SGG3KZ, 0SGG3ZZ, 0SGG44Z, 0SGG45Z, 0SGG47Z, 0SGG4JZ, 0SGG4KZ, 0SGG4ZZ, 0SRF07Z, 0SRF0J9, 0SRF0JA, 0SRF0JZ, 0SRF0KZ, 0SRG07Z, 0SRG0J9, 0SRG0JA, 0SRG0JZ, 0SRG0KZ | 27703, 27704, 27870 |
| Pulmonary embolism | 415.0, 415.12, 415.13, 415.19, 415.11 | I26.09, I26.90, I26.92, I26.99, I26.90, I26.99, T80.0XXA, T81.718A, T81.72XA, T82.817A, T82.818A | - |
| Cardiorespiratory arrest | 427.5, 996.0 | I46.9 | - |
| Deep vein thrombosis | 451.0, 451.11, 451.19, 451.2, 451.81, 451.82, 451.83, 451.84, 451.89, 451.9, 453.40, 453.41, 453.42 | I80.0, I80.1, I80.20, I80.3, I80.21, I80.8, I80.9, I82.409, I82.439, I82.4Y9, I82.449, I82.499, I82.4Z9 | - |
| Pneumonia | 481, 482.0, 482.1, 482.2, 482.30, 482.31, 482.32, 482.39, 482.40, 482.41, 482.42, 482.49, 482.81, 482.82, 482.83, 482.84, 482.89, 482.9, 486, 997.32 | J13, J15.0, J15.1, J14, J15.4, J15.3, J15.20, J15.211, J15.212, J15.29, J15.8, J15.5, J15.6, A48.1, J15.9, J18.9, J95.89 | - |
| Acute renal failure | 584.5, 584.6, 584.7, 584.8, 584.9 | N17.0, N17.1, N17.2, N17.8, N17.9 | - |
| Urinary tract infection | 996.64, 599.0 | T83.51XA, N39.0 | - |
| Acute stroke | 431, 433.00, 433.01, 433.10, 433.20, 433.30, 433.31, 433.80, 433.81, 433.90, 433.91, 434.01, 434.11, 434.90, 434.91, 433.11, 433.21, 434.00, 434.10 | I61.9, I65.1, I63.22, I65.29, I65.09, I65.8, I63.59, I65.8, I63.59, I65.9, I63.20, I63.30, I63.40, I66.9, I63.50, I63.139, I63.239, I63.019, I63.119, I63.219, I66.09, I66.19, I66.29, I66.09, I66.19, I66.29, I66.9 | - |
| Acute respiratory failure | 518.2, 518.82, 518.84, 518.51, 518.52, 518.53 | J98.3, J80, J96.20, J95.821, J96.00, J95.2, J95.3, J95.822, J96.20 | |
| Cellulitis | 682.6, 682.7 | L03.115, L03.116 | |
| Surgical site infection | 998.51, 998.59, 996.67 | T81.4XXA, K68.11, T81.4XXA, T84.60XA, T84.7XXA, T84.50XA, T84.59XA | |
| Wound complications | 998.13, 998.32, 998.83, 998.11, 998.12 | T88.8XXA, T81.31XA, T81.89XA, D78.02, D78.22, E36.02, G97.32, G97.52, H59.121, H59.122, H59.123, H59.129, H59.321, H59.322, H59.323, H59.329, H95.22, H95.42, I97.42, I97.62, J95.62, J95.831, K91.62, K91.841, L76.02, L76.22, M96.810, M96.811, M96.830, M96.831, N99.62, N99.821 |
Ethical Approval
Ethical approval was not sought for the present study because approval from the ethics committee is not required for database studies.
Declaration of Conflicting Interests
The author(s) declared no potential conflicts of interest with respect to the research, authorship, and/or publication of this article. ICMJE forms for all authors are available online.
Funding
The author(s) received no financial support for the research, authorship, and/or publication of this article.