
Abstract
Background:
Intra-articular calcaneal fractures are complex injuries, and CT imaging has become the standard imaging in the preoperative assessment. Most classifications of these fractures are CT-based but have been associated with limited interobserver agreement. Three-dimensional imaging has become widely available and may give a better perspective but often with 1 image only. There is not much evidence of the added value of this imaging, compared with the CT imaging.
Methods:
Eight experienced trauma surgeons assessed 28 different intra-articular calcaneal fractures, on conventional radiology (CR), CT, and 3-D imaging. All had extensive experience in the diagnosis and treatment of this difficult injury. The main questions concerned Sanders classification, the severity of the injury and the difficulty of the operative procedure, choice of approach, and choice of procedure.
Results:
The classical 2-D CT imaging of the fractures were associated with a higher Sanders classification ranking, compared with the 3-D imaging scores. However, the interobserver agreement, as measured by the Fleiss kappa, was low for all 3 imaging modalities. We found more frequent Sanders III and IV classifications with CT scan imaging compared with 3-D imaging or CR. The scores obtained after assessing 3-D imaging were also not statistically significantly different from the scores of a consensus achieved by 2 authors and based on the 3 imaging modalities and the perioperative diagnosis.
Conclusion:
The 3-D imaging may result in a more realistic view, reducing the frequency of classifying Sanders III fractures than with the 2-D CT imaging series. 3-D imaging may be more reliable than CT in the planning of operative treatment of displaced intra-articular calcaneal fractures.
Level of Evidence:
Level III.
Introduction
There is limited evidence of the added value of 3-dimensional (3-D) imaging in the diagnosis and treatment of displaced intra-articular calcaneal fractures (DIACFs). Several authors found no clear added value of 3-D compared with the classical imaging in current use. 9,13 However, 3-D imaging and 3-D print were found to be helpful in the diagnosis and treatment of tibial pilon fracture, especially among trainees, and also improved the communication with the patient. 7 With 3-D imaging, there was a better consistency in the classification of calcaneal fractures but especially so among less experienced surgeons. 3,6 In a comparison between 2-D CT imaging and 3-D printing, there was a decrease in duration of surgery and blood loss among the 3-D group. 16
Moreover, in several studies, there was a trend to give a higher ranking in the Sanders classification when assessing DIACFs with 2-D CT imaging, compared with the 3-D reconstruction image. 1,3,5
The Sanders classification is the most used among trauma surgeons, but it is associated with moderate interobserver agreement. 4,10,15 This classification is based on 2-D CT coronal view through the talar shelf, but also an upper view of the calcaneal bone after removal of the talus. 11
This last view, close to a 3-D imaging, is not available with the classical imaging technologies: observers have to reconstruct it mentally. The purpose of this study was to show if 3-D imaging should improve surgeons’ interobserver agreement and be helpful in the diagnosis of this difficult to treat injury.
Material and Methods
Ethics and Patient Recruitment
Approval from the internal ethics committee board was obtained (S35711) at an academic level 1 trauma center. The patients were chosen from the surgeon’s normal practice through emergency admissions or referrals by other hospitals. Patients gave informed consent for access to their imaging studies.
Imaging
Radiologic imaging of 28 intra-articular calcaneal fractures was obtained from the radiology records of the emergency department. This sample size reflects the average number of fractures treated at our institution on a yearly basis. Patients were randomly selected from the list of 111 DIACFs treated between April 2015 and October 2019.
The CT images were recorded using the Aquilion One Volume CT scanner (Toshiba, Tokyo, Japan), with a table pitch of 0.641, collimation of 0.5 × 64, slice thickness of 0.5 mm, slice increment of 0.5 mm, and rotation time of 0.5 second. The images were anonymized. The patient age ranged from 26-76 (average 49) years. The male-female sex ratio was 14:1. Of the 28 DIACFs, 4 were Sanders I, 20 Sanders II, 3 Sanders III, and 1 Sanders IV, according to the consensus score, which was based on the agreement among 2 authors, who assessed together the 3 imaging and perioperative evaluation.
Three-dimensional reconstruction images were obtained using Mimics 21 software (Materialise, Leuven, Belgium), with the DICOM data of the CT imaging. Three-dimensional images were then segmented to make 3-D reconstruction imaging of the fracture calcaneal bone only, making a virtual disarticulation.
Observers
All images were anonymized and presented to 8 trauma surgeons with extensive experience in the treatment of this injury: an observer had an average of 18-year experience (range 10-32 years) and treated a median of 27 DIACFs every year (range 15-50 fractures), which is above the critical workload leading to a lower complications rate. 8
The participating surgeons were asked to assess the fractures in an online survey. Images of different patients were presented randomly. Each fracture was presented in all 3 imaging modalities but in random fashion as individual images in a mixed series of isolated sequences of all fractures (CR: anteroposterior, lateral, and axial views; CT: all slices coronal, sagittal, and axial views; 3-D: view of the fractured calcaneal bone from several points of view after electronic disarticulation), making each observation independent from others. 2-D CT were presented completely with a scroll of the coronal, sagittal, and axial views: every observer was able to pause at every moment. Three-dimensional imaging was presented in a video clip showing the fractured calcaneal bone in various orientations.
Observers were asked to complete a questionnaire where they had to classify the calcaneal fractures according to Sanders and Essex-Lopresti, to quote the severity of the fracture (0-10 points), the difficulty of the procedure (0-10 points), to choose the procedure (conservative, ORIF, subtalar arthrodesis), and to choose an implant (K-wire pinning, screws, plate and screws).
Statistical Analysis
Statistical analysis was performed with SPSS 26. Because of the categorical nature of the Sanders classification, the Fleiss kappa coefficient was chosen to assess the interobserver agreement, like other authors. 6,11
The Sanders classification is categorical but can also be considered as a scale classification of the severity of the injury: a Sanders I is less severe and has a better prognosis than a Sanders II, whereas Sanders III (or IV) has a worse prognosis and a more severe injury pattern. We used the median value of the Sanders score of each fracture to compare the 3 imaging modalities by using the nonparametric Friedman test.
The Wilcoxon signed rank test with Bonferroni correction was also used to compare CR with CT, CT with 3-D, and CR with 3-D. A level of significance of 0.05 was chosen.
The nonparametric Friedman test was also used to compare the median value of the severity scores of each imaging.
With the numerical values of the Sanders classification, it is possible to calculate an intraclass correlation coefficient, 2-way-random model with absolute agreement. 5
Results
Sanders Classification: Interobserver Agreement and Difference Between CR, CT, and 3-D
The interobserver agreement was assessed with the Fleiss kappa coefficient. We used Sanders classification with 4 subtypes (Sanders I to IV). Fleiss kappa values of the different imaging were low: 0.185 (CR), 0.351 (CT), 0.359 (3-D).
The intraclass correlation coefficient, 2-way-random model with absolute agreement values were as follows: for 3-D: 0.55 (single measures) and 0.91 (average measures); for CT: 0.59 (single measures), and 0.92 (average measures); and for CR: 0.32 (single measures) and 0.79 (average measures).
The nonparametric Friedman test was used to compare the median values of the Sanders classification of the 3 imaging, CR, CT and 3-D. The mean rank values were 2.34, 1.8, and 1.9 for CT, 3-D, and CR, respectively, there was a statistically significant difference between their mean ranking (P = .001).
Post hoc test was conducted between CT and 3-D, CT and CR, and CR and 3-D with the Wilcoxon signed ranks test. After Bonferroni correction, there was a statistically significant difference between 3-D and CT and between CT and CR, (P = .002), but no statistically significant difference between the CR and 3-D imaging (P = .9).
Sanders Classification of the Same Fractures
Two authors agreed on the consensus scores of all 28 fractures, based on the 3 imaging and the perioperative diagnosis of each fracture. There were 4 Sanders I, 19 Sanders II, 4 Sanders III, and 1 Sanders IV fractures. The Sanders scores of the 3 imaging were also compared to the Sanders scores of the consensus scores: with 3-D imaging, the medians of the scores were not significantly different from the scores of the consensus (Wilcoxon signed rank test). But with the CT imaging, there was a significant difference with the consensus scores (Wilcoxon signed rank test, P < .001).
Because of the limited number of Sanders IV, we considered the Sanders III and IV as one subtype, which makes sense: both share a less favorable prognosis and present a comminuted fracture pattern.
When scored by the observers, there were more Sanders III and IV with the CT images, compared with the 3-D reconstruction images: 10 Sanders III and IV with CT vs 5 Sanders III and IV with the 3-D, and 15 Sanders II with the CT vs 21 Sanders II with the 3-D imaging (chi-square, P = .004) (Table 1).
Number (Median Value) of Sanders Classification Types by Imaging and Number of Sanders Classification Types of the Consensus Classification.a
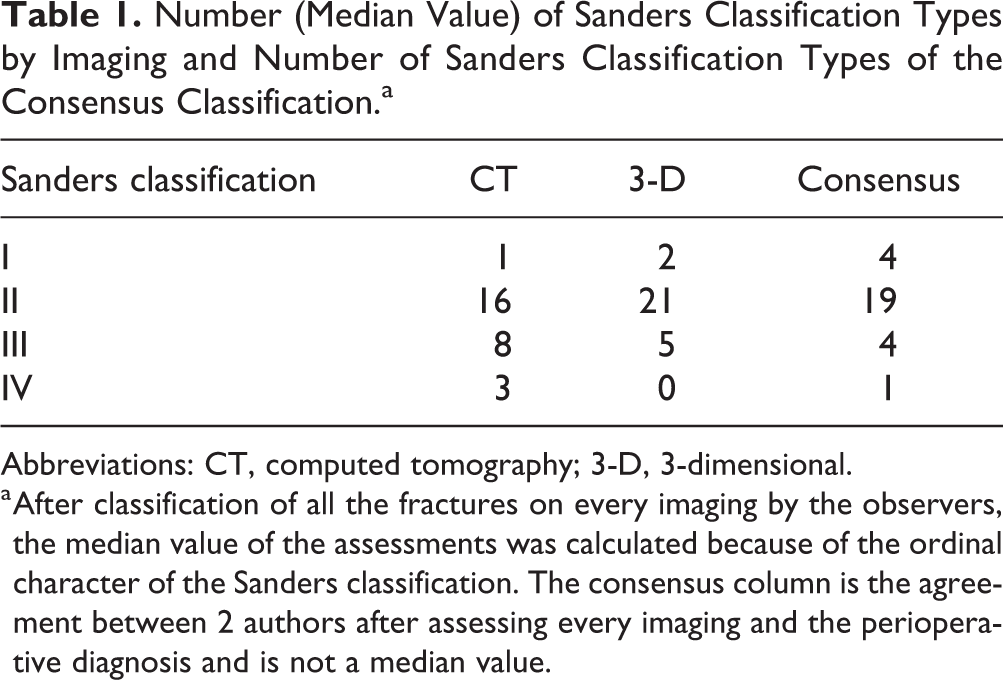
Abbreviations: CT, computed tomography; 3-D, 3-dimensional.
a After classification of all the fractures on every imaging by the observers, the median value of the assessments was calculated because of the ordinal character of the Sanders classification. The consensus column is the agreement between 2 authors after assessing every imaging and the perioperative diagnosis and is not a median value.
Severity Score and Difficulty of the Procedure
Friedman test was used to compare the mean ranking of the severity score of the injury. We calculate the mean values in each type of imaging. The mean rank values of the severity score as provided by the reviewers were 1.67, 2.63, and 1.69 for the CR, CT, and 3-D, respectively; there was a statistically significant difference among the 3 imaging (P < .001).
Post hoc test was conducted between CT and 3-D, CT and CR and CR and 3-D with the Wilcoxon Signed Ranks test. After Bonferroni correction, there was statistically significant difference between 3-D and CT, between CT and CR, but no statistically significant difference between the CR and the 3-D imaging (P = .6).
Treatment
For the choice of the operative procedure, there was no difference in the number of osteosynthesis, subtalar fusion, or conservative treatment among the 3 imaging modalities (chi-square, P = .09).
Discussion
There is a very low interobserver agreement in the use of the Sanders classification, even among experienced observers, when using CT imaging. In the current study, the 3-D imaging does not improve this low interobserver agreement, as measured by the Fleiss kappa coefficient, even after electronic disarticulation of the calcaneal fracture. This agrees with other studies. 2,8,12
This low interobserver agreement of the Sanders classification stresses the difficulty of classifying the calcaneal fractures—as it was humorously described in the past “as useful as classifying cracks in a walnut, after the nut-cracker is through with it”—or the need of another classification, maybe with less subtypes.
The Sanders classification is categorical, but may be considered as ordinal, with his ranking on a scale of one to 4. With the Intraclass Correlation Coefficient to assess the interobserver agreement, the values of this coefficient for single and average measures were high, for CT and 3-D. This way of measuring the interobserver agreement is probably more suitable than the Fleiss kappa coefficient because it considers the Sanders classification (without subtypes) as a scale of severity.
With CT imaging, there were 2 times more Sanders III and IV fractures than with 3-D (10 vs 5): observers were clearly overestimating the severity of the fracture by giving a higher Sanders classification score (Figure 1). This may influence the surgical treatment: the surgeon may choose to perform a subtalar arthrodesis in place of an osteosynthesis. There were more subtalar arthrodeses in the CT group than in the 3-D group (6 vs 3), albeit not statistically significant. This absence of significance may be explained by the low number of Sanders IV fractures.

(A) Computed tomographic axial and coronal views (selection of the whole series of 1 patient): Sanders III. (B) 3-D reconstruction views (selection of the short film of the 3-D images, same patient as panel A): Sanders II.
When assessing CT imaging, the observers gave a higher score for the severity of the injury and the difficulty of the procedure, compared with the 3-D imaging (and the CR pictures), which was already reported in 1991 by Allon. 1 Recent studies also found more Sanders III fractures with CT than 3-D imaging. 3,6 The 2-D CT imaging is made of different slices, where it is difficult to represent the rotational deformity of the fracture fragment, whereas 3-D gives a better visualization of the extent of joint depression, of the comminution, and of the degree of rotation. 1 This overestimation of the severity when assessing CT imaging may have an effect on the treatment and increase the number of subtalar arthrodesis.
In standard clinical practice, surgeons are assessing CR and CT. If the CT delivers a higher Sanders classification than the CR, the surgeon will probably rely on the CT diagnosis: the CT is considered the gold standard for imaging of DIACF and gives a picture with more detail than the CR.
Three-dimensional imaging was also found to be close to the perioperative diagnosis; we may expect better choice of the planned surgical treatment: severe injuries are more often treated by subtalar arthrodesis and less severe injuries by open reduction and internal fixation. Based on 3-D images, the trauma surgeon will be prone to plan less talocalcaneal fusion and more open reduction.
If the preoperative 3-D imaging gives a more accurate classification, closer to the perioperative diagnosis that may be considered as a true gold standard, and is a 3-D structure. Therefore, 3-D imaging may challenge the CT as the gold standard for preoperative imaging of DIACFs.
This study has several limitations: it was an online survey, and every observer had to examine no less than 84 sets of imaging, which was very time-consuming and mimicking the hospital standard condition in a limited manner. Moreover, the use of 3-D by most surgeons may be limited among experienced surgeons, and some learning curve in the use of this less common imaging modality may occur. We also used segmented calcaneal fracture images: segmentation is a virtual disarticulation of the calcaneal bone, which is not as common as the classical MPR (multiplanar rendering) CT scan, VRT (volume rendering technique), and MIP (maximal intensity projection) 3-D imaging.
Because of the random choice, there was also a limited number of Sanders III and IV fractures, and a high number of Sanders II fractures. This unequal proportion is common in clinical practice and was also found in an epidemiologic series of 957 cases. 14 The results may have been different with equal proportions of Sanders II and Sanders III-IV.
We selected 28 fractures, which is the average number of surgical procedures on an annual basis at our institution. Among other studies about interobserver agreement of the Sanders classification, one used 5 fractures, with 57 observers, and another used 100 fractures, with 2 observers. Using more fractures would have decreased the responder rate of this online survey. Post hoc analysis revealed a power of 0.8.
The software we used to generate the 3-D imaging also has a cost, but this may be considered as limited because of its use by other departments in our institution.
Conclusions
Three-dimensional imaging may be a better than 2-D CT scans to help evaluate calcaneal fractures: it gives a Sanders classification closer to the perioperative diagnosis with nearly the same number of subtypes. 3-D imaging is based on DICOM files from CT acquisition, which is the current standard preoperative imaging of this injury; thus, 3-D imaging can be made with limited cost and no extra radiation exposure.
Supplemental Material
Supplemental Material, sj-pdf-1-fao-10.1177_24730114211019729 - Three-Dimensional Imaging of Displaced Intra-articular Calcaneal Fractures Correlates With the Perioperative Diagnosis
Supplemental Material, sj-pdf-1-fao-10.1177_24730114211019729 for Three-Dimensional Imaging of Displaced Intra-articular Calcaneal Fractures Correlates With the Perioperative Diagnosis by Dominique Misselyn, Tim Schepers, Richard Buckley, Michael Swords, Giovanni Matricali and Stefaan Nijs in Foot & Ankle Orthopaedics
Footnotes
Acknowledgments
The authors acknowledge all the observers who spent a lot of time to assess all the images.
Ethical Approval
Ethical approval for this study was obtained from the Gasthuisberg University Hospital Ethics Committee (approval number S57311).
Declaration of Conflicting Interests
The author(s) declared no potential conflicts of interest with respect to the research, authorship, and/or publication of this article. ICMJE forms for all authors are available online.
Funding
The author(s) received no financial support for the research, authorship, and/or publication of this article.
References
Supplementary Material
Please find the following supplemental material available below.
For Open Access articles published under a Creative Commons License, all supplemental material carries the same license as the article it is associated with.
For non-Open Access articles published, all supplemental material carries a non-exclusive license, and permission requests for re-use of supplemental material or any part of supplemental material shall be sent directly to the copyright owner as specified in the copyright notice associated with the article.