
Abstract
Background:
Lisfranc joint injuries can be due to direct or indirect trauma and while the precise mechanisms are unknown, twisting or axial force through the foot is a suspected contributor. Cadaveric models are a useful way to evaluate injury patterns and models of fixation, but a frequent limitation is the amount of joint displacement after injury. The purpose of this study was to test a cadaveric model that includes axial load, foot plantarflexion and pronation-supination motion, which could re-create bone diastasis similar to what is seen in subtle Lisfranc injuries. Our hypothesis was that applying pronation and supination motion to a cadaveric model would produce reliable and measurable bone displacements.
Methods:
Twenty-four fresh-frozen lower leg cadaveric specimens were used. The medial (C1) and intermediate (C2) cuneiforms and the first (M1) and second (M2) metatarsal bones were marked. A complete ligament injury was performed between C1-C2 and C1-M2 in 12 specimens (group 1), and between C1-C2, C1-M2, C1-M1, and C2-M2 in 12 matched specimens (group 2). Foot pronation and supination in addition to an axial load of 400 N was applied to the specimens. A 3D digitizer was used to measure bone distances.
Results:
After ligament injury, distances changed as follows: C1-C2 increased 3 mm (23%) with supination; C1-M2 increased 4 mm (21%) with pronation (no differences between groups). As expected, distances between C1-M1 and C2-M2 only changed in group 2, increasing 3 mm (14%) and 2 mm (16%), respectively (no differences between pronation and supination). M1-M2 and C2-M1 distances did not reach significant difference for any condition.
Conclusions:
Pronation or supination in addition to axial load produced measurable bone displacements in a cadaveric model of Lisfranc injury using sectioned ligaments. Distances M1-M2 and C2-M1 were not reliable to detect injury in this model.
Clinical Relevance:
This new cadaveric Lisfranc model included foot pronation-supination in addition to axial load delivering measurable bone diastasis. It was a reliable Lisfranc cadaveric model that could be used to test different Lisfranc reconstructions.
Introduction
Lisfranc joint injuries have become increasingly common, especially those from low energy related to traumatic sports activities. 9 Lisfranc injuries can occur as a result of direct or indirect trauma, with the latter being most commonly seen in sports, where either an excessive twisting or an axial force is transmitted to the foot in plantarflexion. 5 Although there is consensus that anatomic reduction should be the ultimate objective when operatively treating these patients, there is no consensus as to how to obtain and maintain this goal, either using internal fixation, primary arthrodesis, screws, plates, or flexible constructs. 1,3,12,14,15 Cadaveric models represent a useful way to test different models of fixation, and, therefore, different settings have been used to represent as close as possible the injury patterns and biomechanics. 2,7,10,18 Most cadaveric Lisfranc models use specimens fixed in plantarflexion, 1,11 -13 although they differ in the exact amount of plantarflexion degrees, axial loads, and ligament injury configuration. The models that use limited Lisfranc ligament injury show between 0.3 and 2 mm of joint displacement, values that are too small to sufficiently evaluate the degree of damage and reconstruction effectiveness. Most of these models only apply axial loading on a plantarflexed foot for their testing. 4,11,12,17 Only Lisfranc injury models that add abduction or adduction stress tests obtain greater joint displacements (4.6 mm). 8,13 No cadaveric models described to the present date include plantarflexion and twisting forces (supination-pronation) trying to reproduce what is suspected to occur in some low- to medium-energy Lisfranc injuries (subtle lesions).
The purpose of this study was to test a novel Lisfranc injury cadaveric model (applying foot rotation and axial loading) that delivers measurable bone diastasis using the 2 previously mentioned conditions. The first hypothesis was that this model would reliably reproduce tarsometatarsal (TMTT) displacement after Lisfranc ligament injury, achieving measurable displacements. Our second hypothesis was that pronation would produce bigger tarsometatarsal joint displacements compared to supination.
Materials and Methods
Twenty-four fresh-frozen lower leg cadaveric specimens were used. All specimens were from individuals younger than 65 years without previous surgeries or visible pathology of the foot. They were thawed at room temperature for 16 hours before testing. All the manipulation, storage, and disposal of the specimens was performed according to approved protocols. Two 4.5-mm screws were used to fix the tibiotalar joint in 30 degrees of plantarflexion. The subtalar joint was left intact to permit normal adaptation of the midtarsal joints. The skin and the fat layer of the dorsal midfoot were removed, exposing the extensor tendons and the region of the cuneiform and metatarsal bones (medial Lisfranc joint). The samples were hydrated with saline solution to prevent desiccation and preserve tissue resiliency.
Considering the conventional screws positioning for Lisfranc joint fixation (ie, Lisfranc screw, intercuneiform, and cuneiform-metatarsal screws), we studied a set of 24 weight-bearing AP radiographs of patient feet (12 men and 12 women) in order to find out the best place for placing bone markers without jeopardizing the midfoot joints. We identified a trapezoidal working area on the dorsum of the midfoot where we could place the bone marking screws without interfering with standard screw fixation of the Lisfranc joint complex. A plastic trapezoid guide with 4 holes was constructed to be as objective and standardized as possible (Figure 1). These holes corresponded with the lateral border of the medial cuneiform, the medial border of the intermediate cuneiform, the medial border of the base of the second metatarsal, and the lateral border of the base of the first metatarsal. The same guide was used on both the right and left feet by reversing its positioning.

Schematic drawing of the plastic guide used for the positioning of the bone markers: a = 10 mm; b = 15 mm; c = 18 mm. When used on the opposite side, it served for the left foot. The 2 marker locations that are together were used depending on the tarsometatarsal shape. In very concave joints, the appropriate hole was chosen that would avoid joint violation.
Under visual and radioscopic inspection and with the help of the plastic guide, 4 points near the joints of the first cuneiform (C1), second cuneiform (C2), first metatarsal (M1), and second metatarsal (M2) were localized and marked with a 2-mm K-wire. From dorsal to plantar, four 2.3-mm partially threaded 13-mm-long Phillips flat-head wood screws were inserted at the previously mentioned points (Figure 2A and 2B). These screw heads were placed flush with the dorsal surface of their respective bones and were clearly visible to be used as reference marks for 3D digitizer measurements (Immersion Microscribe, model #G2X; Immersion Corp, San Jose, CA). Relative positions of the screws were analyzed using Solid Works 2017 software (Dassault Systems SolidWorks Corp, Waltham, MA) The specimens were fixed to the Instron Testing Machine (E10000 Instron Electropuls Materials Testing Machine with a combination 10-kN loadcell and 100-Nm torque cell; Instron Corp, Norwood, MA), taking care to keep the forefoot firmly stabilized to the ground (Figure 3). This was achieved with an axial load applied to the specimen of 400 N with sandpaper under the forefoot, and a constraint on internal/external rotation through a metal bar across the dorsal toes. The mounting was secured so that it allowed free axial rotation of the specimen, keeping the forefoot stabilized to the ground.
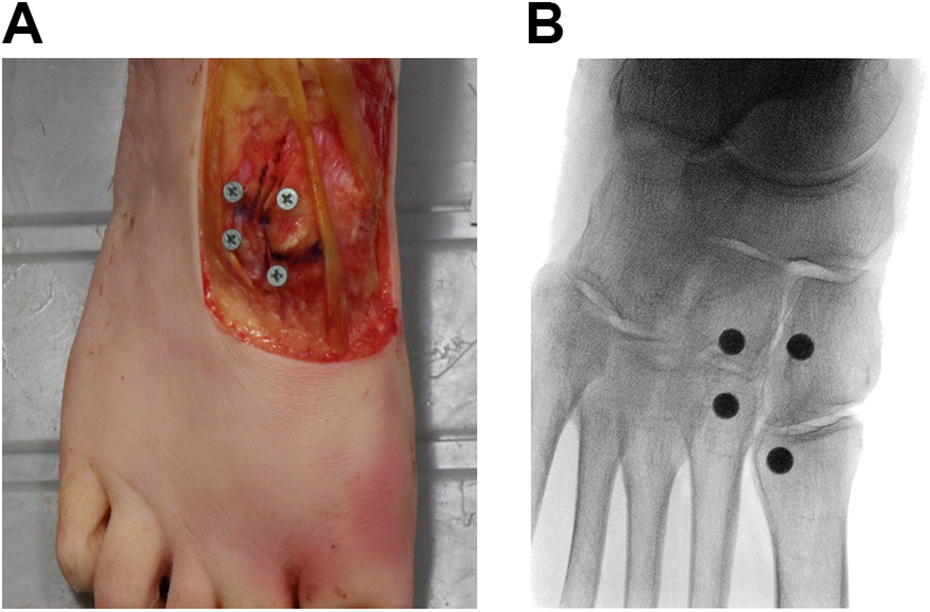
(A) Dorsal aspect of the specimen after the dissection of the region of interest and the positioning of the bone markers (screw heads) on the first and second metatarsal, medial and intermediate cuneiform. (B) Anteroposterior radiograph of the same specimen shown in panel A, showing the bone markers (screw heads) on C1, C2, M1, and M2.
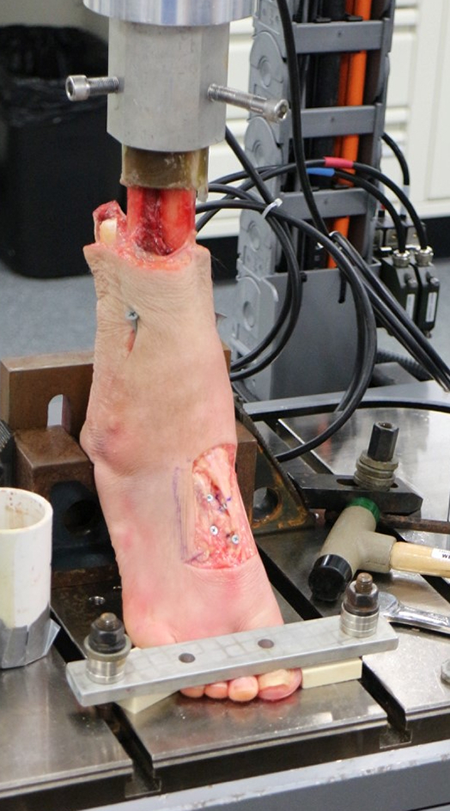
Specimen fixed to the MTS testing machine firmly stabilized to start the mechanical tests.
To be able to achieve foot rotation, that is, pronation and supination, while applying axial weight to the specimen, tibial rotation was used. In vivo, the foot pronates and supinates with every step, as part of a coupled motion. The complete foot coupled motion connects midfoot pronation-supination with subtalar eversion-inversion and tibial internal-external rotation. In this study, with the forefoot and ankle fixed, all internal and external tibial rotation took place in the midfoot, re-creating foot pronation and supination, respectively. Given that the subtalar joint was not fixed, the physiologic tibia-foot coupled motion could be re-created, consisting of tibial internal rotation-subtalar eversion and midfoot pronation and tibial external rotation-subtalar inversion and midfoot supination. 6,16
A preconditioning cycle (PCC) was performed on every intact specimen, under an axial load of 400 N. It consisted in 10 consecutive rotational movements of the tibia, allowing 30 degrees of internal tibial rotation (ie, foot pronation) and 30 degrees of external tibial rotation (ie, foot supination). After calibrating the 3D digitizer arm, measurements were taken between the bone markers (screw heads) (Figure 4). The digitizer arm used a fine tip that matched the screw head hole, thereby minimizing the variability between measurements. The following distances were obtained in millimeters: Medial to intermediate cuneiform: C1-C2 First to second metatarsal: M1-M2 Medial cuneiform to first metatarsal: C1-M1 Intermediate cuneiform to second metatarsal: C2-M2 Medial cuneiform to second metatarsal: C1-M2 Intermediate cuneiform to first metatarsal: C2-M1

Making measurements with the 3D digitizer arm on the bone markers (screw heads).
The 24 specimens were divided in 2 matched groups, 12 left foot specimens and 12 right foot specimens. Group 1 consisted in 12 left foot specimens in which, after the measurements in the intact condition, the ligaments between C1-C2 and C1-M2 (Lisfranc ligament) were sectioned with the help of a 4-mm curved “banana blade” (Arthrex, Naples, FL). Group 2 consisted in 12 right foot specimens in which the ligaments between C1-C2, C1-M2, C1-M1, and C2-M2 were sectioned with the help of a 4-mm curved “banana blade” (Arthrex). The preparation of the specimens was performed by one of the surgeons involved in the study, taking care to achieve a complete division of the involved ligaments. The specimens were taken back to the Instron machine, and a second PCC was performed (same cycle as previously performed). After this cycle, the same set of measurements described in the previous paragraph were obtained for both groups.
The distances measured were compared between the intact condition and the injured condition in both groups. The torque needed to produce 30 degrees of internal, and external tibial rotation was measured and compared between the intact condition and the injured condition.
Statistical analysis was performed using the percentage change of the distances compared to the intact condition so as to compensate for size differences between the specimens. Raw data analysis was also performed to deliver a total measurement information to guide the analysis. Statistical software (SigmaPlot v14.0, Systat Software, Inc, San Jose, CA) was used, using the analysis of variance for nested data estimates by mixed models. A P value of <.05 was established as the limit for rejection of the null hypothesis. Sample size calculation could not be performed given that this model has not been published before. A post hoc power analysis was performed. A power of 93.4% was obtained.
Results
The displacements found in the testing procedures are summarized in Tables 1 and 2. For group 1, only distances C1-C2 and C1-M2 increased after ligament injury. For group 2, C1-M1 and C2-M2 distances also increased. The biggest distance change with supination was between C1-C2, which increased 3 mm after ligament transection (23% increase). The biggest distance change with pronation was between C1-M2, which increased 4 mm after ligament transection (21% increase). Distances between C1-M1 and C2-M2 only changed in group 2 (as expected), increasing 3 mm (14%) and 2 mm (16%), respectively (no difference between supination and pronation). Distances between M1-M2 and C2-M1 did not change between the intact and injured condition. No difference was seen between groups in the distances C1-C2 and C1-M2 for any condition (P > .05). The torque needed to achieve the predetermined rotation decreased 4 Nm (±2.2) after injury (P = .001) from 19.6 to 15.5 Nm, independent of the movement direction and studied group. No failures in the cadaveric models were identified during the tests.
Summary of Findings for Condition: Foot Pronation.a
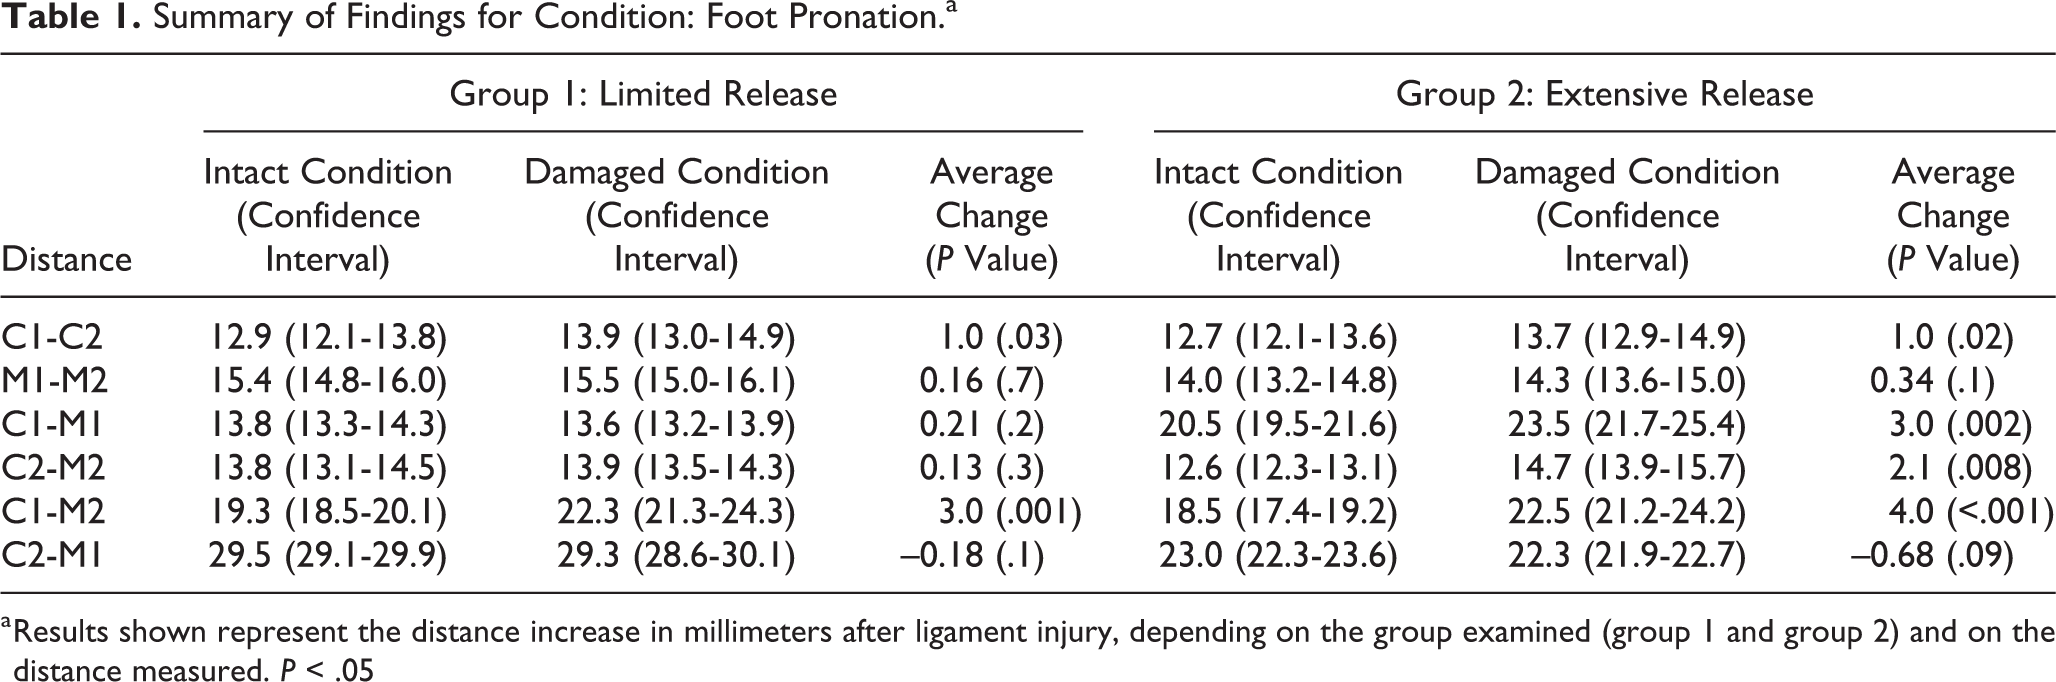
a Results shown represent the distance increase in millimeters after ligament injury, depending on the group examined (group 1 and group 2) and on the distance measured. P < .05
Summary of Findings for Condition: Foot Supination.a

a Results shown represent the distance increase in millimeters after ligament injury, depending on the group examined (group 1 and group 2) and on the distance measured. P < .05.
Discussion
Lisfranc injuries are uncommon injuries, but they can result in persistent pain, arthritis, and disability. The ideal treatment method for this pathology remains under debate 14 and therefore increased interest in testing different repair and reconstruction methods have emerged. Many previous cadaveric studies, using foot and ankle specimens loaded in an axial physiologic fashion, have not been able to show joint displacements in a reliable way, rendering their conclusions difficult to evaluate and/or compare with this study. Some Lisfranc models that have divided all TMTT ligaments 1 have achieved consistent joint displacements, but it can be argued that they have not reproduced a real-life scenario. In order to have a model that mimics real-life injury, most recent studies considered partial damage of the TMTT ligaments. The limitation of the new models trying to replicate more limited joint damage, that is, sectioning C1-C2 and M1-M2 ligaments, 11,12,17 has been the inability to achieve evident joint displacements to measure, obtaining between 0.7 and 1.3 mm of joint displacement, distances that are under the classic limits for operative indication. 8 Relative to the angular setting of the different models tested, most of them hold the specimens in different degrees of plantarflexion, most commonly at 30 degrees, hoping in this way to increase pressure at the TMTT joints. 1,12,13,17
Our model is the first one, to our knowledge, that uses pronation and supination in addition to axial force in a subtle Lisfranc injury cadaveric testing. The joint displacements measured in our study were easy to observe and measure, as we obtained 4 mm (±1.4) of displacement in distance C1-M2, one of the distances most commonly measured. Changes in distances C1-M1 and C2-M2 were also evident, measuring 3 (±0.9) and 2 mm (±0.8), respectively, which allows us to say that this model could reproduce reliable and measurable changes in distances between tarsal bones after ligament injury, which confirms our first hypothesis. The statistically significant decrease in torque measured after ligament sectioning confirms the reliability of our model in reproducing a Lisfranc model. Remarkably, distances M1-M2 and C2-M1 did not change between the intact and the injured condition, even considering that our model applied more axial load than others (400 N) and 30 degrees of rotation of the hindfoot over the forefoot, which is equivalent to 14 to 25 Nm of torque. This fact could make us consider that these 2 distances are not reliable to predict ligament damage. We currently do not recommend these measurements to be used in our clinical practice, although a generalized recommendation against their use would need further basic and clinical studies.
Relative to our second hypothesis, distance C1-M2 (Lisfranc distance) did increase more with pronation, but the same was not true for distance C1-C2 (greater increase in supination). We believe that when applying a twisting motion to the foot, a divergent force occurs in C1-C2 when supination is performed, as a result of an increased load onto the second metatarsal bone, thus exhibiting more joint displacement in this scenario. The contrary happens on C1-M2 as it exhibits more displacement when pronation is performed, because of an increased load onto the first metatarsal. By applying axial force and adding pronation to the midfoot, the largest C1-M2 (Lisfranc distance) bone diastasis was achieved.
The limitations of our study include that no muscle loading was applied during testing and the probable variation between specimens, which could hinder finding relevant results, considering we did not test the bone mineral density. We tried to minimize this error using matched left and right feet for groups 1 and 2. No repeated measurements were performed with the 3D digitizer. Nevertheless, the digitizer arm tip used fit tightly in the screw hole, not allowing for misposition or measurement error. Not finding statistically significant differences for distances M1-M2 and C2-M1 between the intact and injured condition relates probably to not having injured the complete TMTT complex and to applying a rotational motion to the specimen rather than an abduction or adduction torque. Another limitation is that our bone diastasis measurements are not directly comparable to other studies’ measurements, given that the cadaveric models and the methods of measuring bone displacements are different. Additional limitations relate to possible variations when performing ligament injury, as different amounts of damage may have been applied to the specimens. We used the complete length of a 4-mm curved “banana blade” to produce every injury, and we tried to minimize variation by having only 1 investigator prepare every specimen. Finally, the bone diastasis was measured using markers and not directly measuring the bones.
In conclusion, this cadaveric Lisfranc model included pronation and supination as a condition and reliably reproduced bone diastasis seen in Lisfranc injuries. It is a model amenable to be used to test different Lisfranc reconstructions. In addition, our results may give insight as to why there are different Lisfranc lesions, that is, purely C1-M2 lesion (pronation) vs C1-C2 extension (supination), depending on the mechanism.
Supplemental Material
Supplemental Material, FAO898265-ICMJE - Biomechanical Evaluation With a Novel Cadaveric Model Using Supination and Pronation Testing of a Lisfranc Ligament Injury
Supplemental Material, FAO898265-ICMJE for Biomechanical Evaluation With a Novel Cadaveric Model Using Supination and Pronation Testing of a Lisfranc Ligament Injury by Emilio Wagner, Pablo Wagner, Tiago Baumfeld, Marcelo Pires Prado, Daniel Baumfeld and Caio Nery in Foot & Ankle Orthopaedics
Footnotes
Declaration of Conflicting Interests
The author(s) declared no potential conflicts of interest with respect to the research, authorship, and/or publication of this article. ICMJE forms for all authors are available online.
Funding
The author(s) received no financial support for the research, authorship, and/or publication of this article.
References
Supplementary Material
Please find the following supplemental material available below.
For Open Access articles published under a Creative Commons License, all supplemental material carries the same license as the article it is associated with.
For non-Open Access articles published, all supplemental material carries a non-exclusive license, and permission requests for re-use of supplemental material or any part of supplemental material shall be sent directly to the copyright owner as specified in the copyright notice associated with the article.