
Abstract
This work describes the use of electrothermal atomic absorption spectrometry in combination with a pyrolytic graphite-coated tube with a platform for trace arsenic (As) determination in titanium dioxide (TiO2) pigment. This type of matrix is challenging, as complete digestion in hydrofluoric acid-containing solution is needed. First, closed-vessel microwave digestion was performed for the full-sample decomposition. Next, a temperature program was optimized for drying, pyrolysis, and atomization temperatures. Furthermore, the use of a chemical modifier mixture was proposed that reduced the background contribution and prevented significant analyte loss and therefore improved the analytical procedure. The optimized method was validated for the detection (LOD) and quantification (LOQ) limits, the linear concentration range, accuracy, and precision. Special attention was devoted to the matrix-matching solutions in the calibration procedure. Linearity was confirmed in the 5.0 to 100.0 µg/L concentration range (R2 = 0.999). The average recovery for 16 different real TiO2 pigment samples was 92.0%, and the relative standard deviation value for six replicate measurements was ≤10.4%. Moreover, the LOD and LOQ in terms of the TiO2 pigment mass was determined to be 0.2 µg/(g TiO2) and 0.7 µg/(g TiO2), respectively. The latter complies with Commission Directive 2008/128/EC, which does not allow more than 3 µg As/(g product) as the specific criteria of purity. Finally, based on scanning electron microscopy analysis of unused and several times used pyrolytic graphite-coated tubes, usage of the tube 250 times before replacement is recommended.
Introduction
Titanium dioxide (TiO2) can be found in different materials, such as cosmetic products (shades and lipsticks), pharmaceutical products, and food industry products. Therefore, analysis of trace heavy metals in TiO2 is of paramount importance to prevent health-related problems. One of the heavy metals that may be present is arsenic (As), which has well-known carcinogenic and toxic effects.1–5 TiO2 is a relatively complex matrix with challenging analytics as TiO2 is usually dissolved in hydrofluoric acid (HF), which can be problematic when glassware equipment is employed (e.g., in inductively coupled plasma mass spectrometry, inductively coupled plasma optical emission spectrometry, electrochemical determination, biosensing, etc.).6–11 The use of hydrogen chloride in the digestion procedure for the determination of As by electrothermal atomic absorption spectrometry (ETAAS) is not recommended because of the formation of volatile metal chlorides. 12 According to Commission Directive 2008/128/EC, if TiO2 is used in the food industry as dye E171, As content up to 3 mg/kg is allowed. Thus, the goal would be to develop a method with a limit of detection (LOD) lower than 3 mg As/(kg TiO2).
ETAAS is usually employed when the amount of the target analyte is very low. However, when using this technique, a temperature program needs to be developed for the given element in the specific sample matrix, and an appropriate chemical modifier may be employed. The purpose of using chemical modifiers in ETAAS is to decrease the volatility of the analyte and simultaneously to increase the volatility of the matrix in the ashing (pyrolysis) step. The combination of these two actions prevents significant analyte loss during the ashing step, allowing higher ashing temperatures (several hundred degrees) and consequently more effective separation of the analyte and matrix, leading to more efficient analytics. The use of chemical modifiers was first mentioned in 1975 by Edinger.13,14 Potential chemical modifiers proposed previously were noble metals with high melting points, such as palladium (Pd), platinum, iridium, rhodium, tantalum, titanium, tungsten, lanthanum, arsenic, and ruthenium.9,15–22 Furthermore, elements that form carbides such as molybdenum, hafnium, niobium, tungsten, tantalum, and zirconium, as well as NH4HPO4–Mg(NO3)2, nitric acid, and silver nanoparticles have also been suggested.21,23,24 How exactly the chemical modifier works is a matter of debate. Regarding Pd as a chemical modifier, it has been proposed that it either forms a nonvolatile intermetallic compound or a solid solution with Pd 25 or it could somehow be connected with a reaction that includes graphite material and the analyte. 13 For As determination, most of the literature describes food, wine, water, sediment, nanoparticles, human hair, soil, essential oil, marine tissue, and rose samples.9,13,20,26–42
This work describes the development of the ETAAS method by means of temperature program optimization after full TiO2 sample decomposition using closed-vessel microwave-assisted digestion for the determination of trace amounts of As in a TiO2 pigment matrix. The need for an appropriate chemical modifier mixture is also discussed. The developed method was finally validated for the linear concentration range, LOD, limit of quantification (LOQ), accuracy, and precision. To the best of the authors’ knowledge, no reports regarding trace As analysis in TiO2 pigment have hitherto been published. TiO2 is very important as it is widely used worldwide.
Materials and Methods
Suprapur-grade acids (i.e., 65% nitric acid [HNO3] and 40% HF) and arsenic ICP standard solution (1000 mg/L As) were supplied by Merck KGaD (Darmstadt, Germany). Palladium chemical (matrix) modifier (10.0 g/L Pd) for graphite-furnace AAS and magnesium nitrate hexahydrate (BioUltra, 99.0%, p.a., Fluka) were supplied by Sigma-Aldrich (St. Louis, MO). All dissolutions were performed as required using ultrapure water with a resistivity of 18.2 MΩ cm obtained with an Elga Centra R200 (ELGA LabWater, Veolia Water Solutions & Technologies, Paris, France).
ETAAS measurements were performed with a Varian SpectrAA-240 Z Zeeman Atomic Absorption Spectrometer with a GTA 120 Zeeman Graphite Tube Atomizer equipped with an autosampler (Varian, Programmable Sample Dispenser PSD 120). To purge the system, argon (Ar) gas was used (purity 99.996%, supplied by Linde Plin, Celje, Slovenia). All measurements were performed using a longitudinal heated graphite atomizer with a pyrolytic graphite-coated platform. The background contribution was measured based on a Zeeman-effect background correction. The arsenic analyte absorbance (A) was measured at a wavelength of 193.7 nm using an As UltrAA hollow cathode lamp (Agilent Technologies, Santa Clara, CA) operating at 10 mA and with a spectral bandpass of 0.5R nm. The analytical signal in the ETAAS measurements was a peak area, if not stated otherwise. The volume of the injected sample (or blank solution) on the platform was 20 µL, and the volume of the chemical modifier solution was 5 µL. Both solutions were injected simultaneously.
Three solutions were prepared for ETAAS method optimization: (a) 8.0 mL 65% HNO3 (hereinafter designated as HNO3 medium), (b) 6.0 mL 65% HNO3 and 2.0 mL 40 wt% HF (hereinafter designated as HNO3/HF medium), and (c) 6.0 mL 65% HNO3 and 2.0 mL 40 wt% HF with the addition of 0.5 g ultrapure TiO2 pigment, which did not contain trace amounts of As-certified material (solution c is hereinafter designated as MM medium). Solutions a and b were employed to check the influence of HNO3 and HF acids on the analyte and the background absorption and for comparison with solution c, for which a matrix-matching methodology was employed. For the method optimization, these solutions were spiked with As(III) solution to the desired concentration. In addition, a microwave digestion procedure was performed for solution c as described below (digestion was not performed for HNO3 and HNO3/HF media as no TiO2 was present). It should be pointed out that HF is needed for TiO2 decomposition.
Microwave digestion was performed using an Ethos ONE microwave system with an SK-10 TP-FC rotor (Milestone, Brøndby, Denmark). The microwave temperature program consisted of the following steps: the medium was heated to a temperature set at 220 °C for 20 min, and the temperature was held at 220 °C for 15 min, followed by a 10 min cooling period to achieve 80 °C. Afterward, the microwave doors were opened, and the solution was left to cool until the final temperature of the solution reached 40 °C. Finally, the vessel content was quantitatively transferred and diluted to 50.0 mL using ultrapure water. The same dilution was performed for the above-mentioned HNO3 and HNO3/HF media. The solutions prepared in this manner were then employed for the ETAAS analysis.
Surface morphology studies of the cuvette platform, before and after successive uses, were performed with a field-emission scanning electron microscope (model Gemini Supra 35 VP, Carl Zeiss, Oberkochen, Germany), which was equipped with an energy dispersive X-ray spectrometer.
Results and Discussion
First, the optimal conditions for As determination after microwave digestion in HNO3, HNO3/HF, and MM media were determined. All the ETAAS analyses were performed at 193.7 nm (λAs). The aim of these tests was to study the effect of the TiO2 matrix, the chemical modifier, the drying temperature (Tdry), the ashing temperature (Tash), and the atomization temperature (Tatom) on the As absorbance and background absorbance. TiO2 is a relatively nonvolatile matrix material, whereas As is relatively volatile. Because of the latter, pyrolytic graphite-coated tubes with a platform were employed in all ETAAS analyses. The aim of this procedure is to develop and optimize a temperature program that produces the highest decomposition of the matrix with minimal analyte loss (to increase the sensitivity and LOD of the method).
Drying Temperature Procedure
The drying temperature protocol was selected based on the boiling points of the water and acid. The drying rate was optimized by observing a drop of solution on the graphite platform during the drying procedure. The selected conditions ensured gradual drying, without the formation of a film due to uncontrolled rapid evaporation and possible eruption, which could lead to partial sample loss in the analysis. Figure 1 shows the final periods during the drying steps, in which the conditions were optimized to achieve smooth and thorough liquid evaporation. The determined optimal conditions for sample drying were as follows: drying started at 85 °C with a 10.0 s ramp time and 5.0 s hold time, followed by drying at 110 °C with a 25.0 s ramp time and a 10.0 s hold time, and finally the drying temperature was set at 130 °C with a 10.0 s ramp time and a 10.0 s hold time. These drying conditions were employed in all subsequent experiments (as given in Table 1 ).
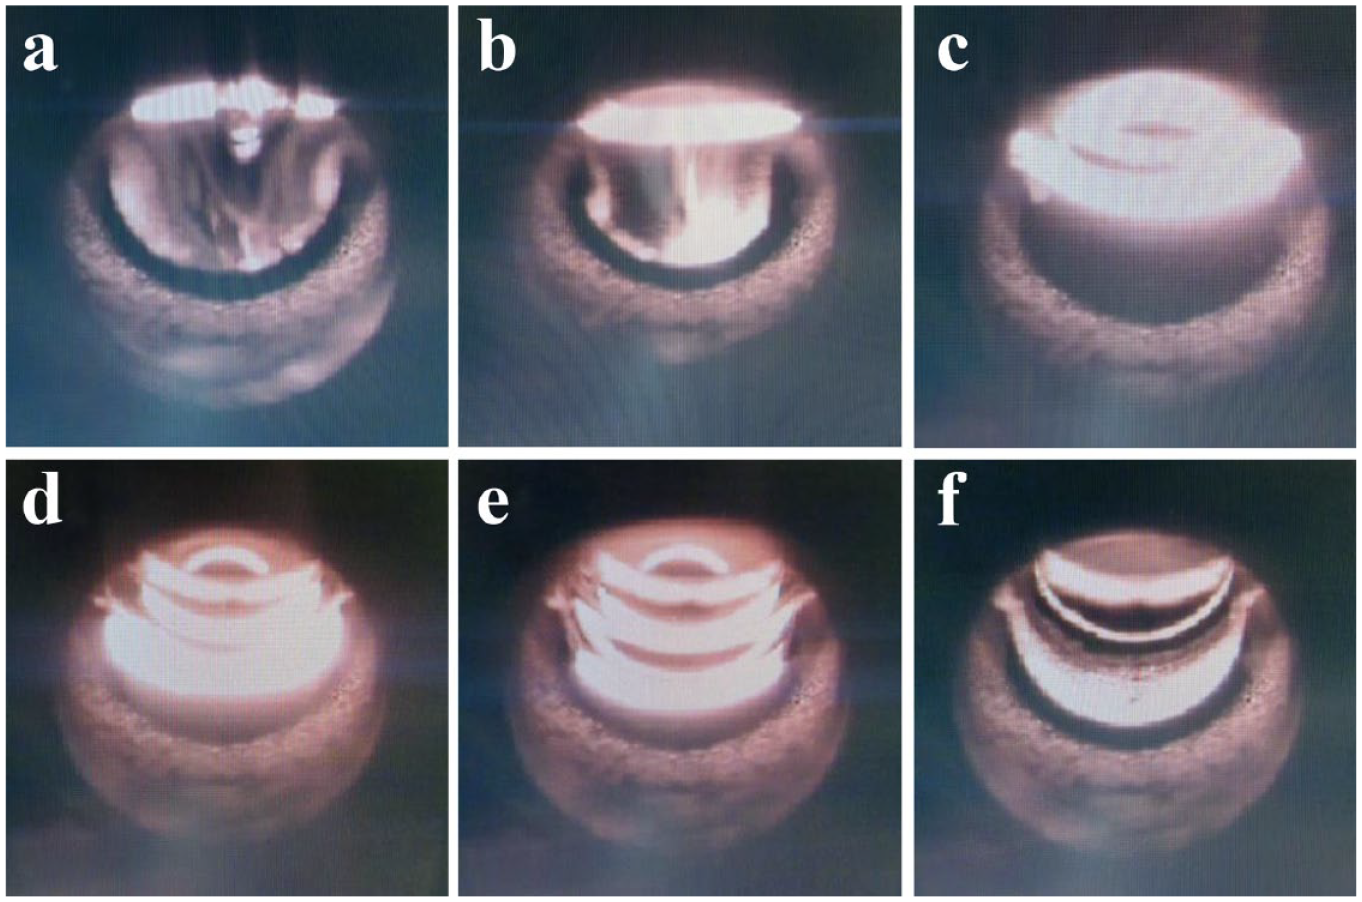
Sample drop observation during the drying procedure; photographs taken (
Final Electrothermal Atomic Absorption Spectrometry Temperature Program after Digestion-Based Methods.

Ashing and Atomization Temperature Optimization
The influence of Tash and Tatom on the As analyte absorbance was checked first. Measurements were performed at Tash of 200 °C, 600 °C, and 1000 °C and at different Tatom for the HNO3, HNO3/HF, and MM media (prepared as explained in the Materials and Methods section), which were spiked with 50.0 µg/L As(III) (final concentration in solution, γ). Figure 2 shows that the differences in the analyte absorption at λAs for the media employed were significant. The highest absorbance was measured for HNO3 medium when Tash and Tatom at 600 °C and 2200 °C were used, respectively ( Fig. 2a ). For comparison, when the same experimental conditions were employed (Tash = 600 °C and Tatom = 2200 °C) for HNO3/HF medium, the absorbance was significantly lower. The latter absorbance decrease was even more pronounced for the MM medium. Therefore, the medium strongly affected the As analyte absorbance and consequently the sensitivity of the ETASS method. On the other hand, MM produced the highest background contribution among all the media tested ( Fig. 2b ). The background contribution for the MM medium was significantly more intense when the ashing procedure was performed at 200 °C, followed by 600 °C and 1000 °C. HNO3/HF medium also produced a relatively intense background contribution when a Tash of 200 °C was employed. On the other hand, when the ashing procedure was performed at 1000 °C for all three media, the background contribution was less intense (absorbance did not exceed 0.05 for any Tatom tested; Fig. 2b ). The same was also found in the final optimized method (explained below), in which a chemical modifier was employed.
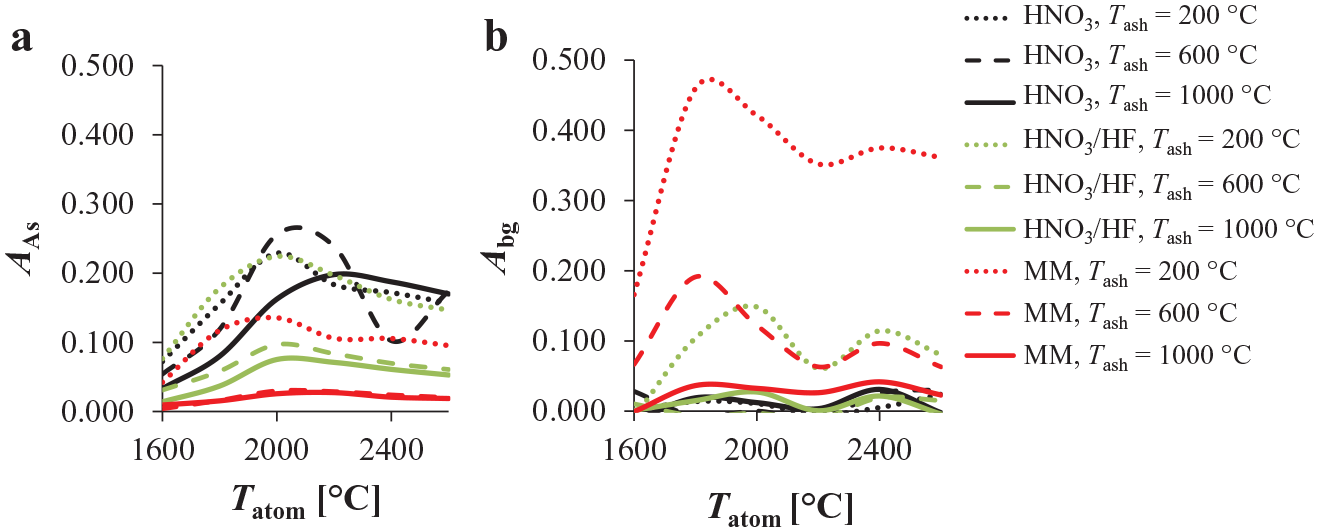
The influence of different Tash and Tatom on (
To minimize the background contribution and increase the As absorbance measured at λAs, the ETAAS methodology was further optimized by employing a Pd/Mg(NO3)2 chemical modifier mixture. It is generally known that chemical modifiers stabilize the analyte and effectively contribute to the removal of the sample matrix in the ETAAS analysis procedure, which reduces the background contribution and minimizes chemical interferences.13–20,23 Thereafter, a chemical modifier mixture was always injected simultaneously with the sample solution (20 µL sample/blank solution plus 5 µL chemical modifier solution). Figure 3 shows the influence of the presence of the chemical modifier (8.0 µg/L Pd/10.0 µg Mg[NO3]2 in 5 µL solution) on the As analyte absorbance ( Fig. 3a ) and the background contribution ( Fig. 3b ) for the HNO3, HNO3/HF, and MM media spiked with 50.0 µg/L As(III) (final concentration in solution). Compared with the same situation but without the chemical modifier added ( Fig. 2a ), the As analyte absorbance signal and the background contribution changed significantly for all three media tested. In the case in which the chemical modifier was present, the differences in As analyte absorbance for the three media were not as significant as they were for the tests without the chemical modifier present ( Fig. 3a vs. Fig. 2a ). The highest As analyte absorbance was measured at a Tatom of 2300 °C in most of the cases ( Fig. 3a ). Therefore, a Tatom of 2300 °C was employed in the subsequent measurements to determine the optimum chemical modifier concentration and the optimum Tash order to reduce the background contribution.
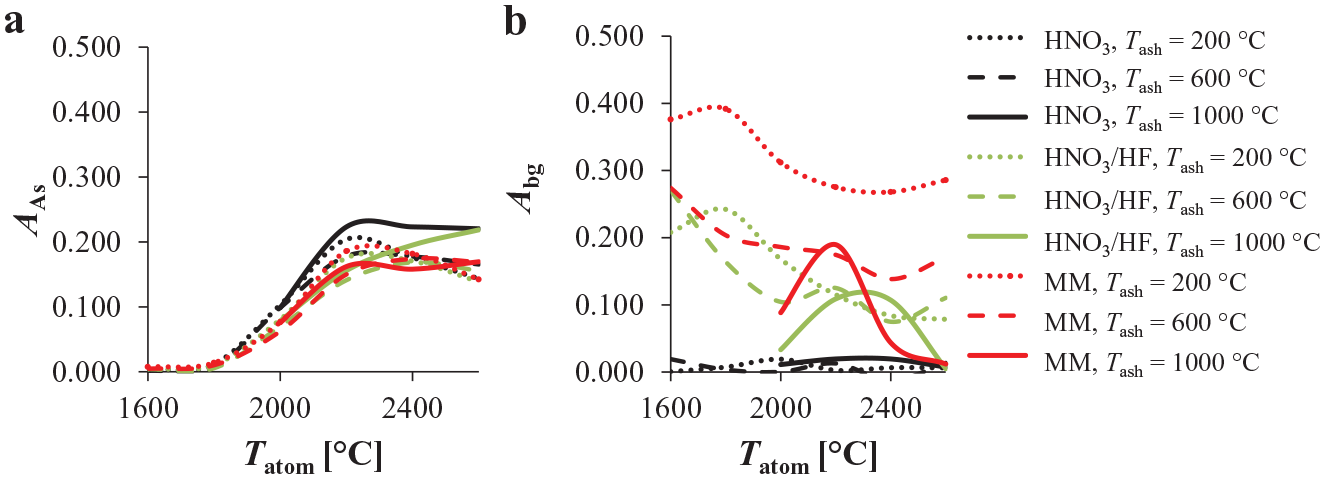
The influence of an 8.0 µg/L Pd/10.0 µg Mg(NO3)2 chemical modifier mixture and different Tash and Tatom on (
Figure 4 shows the influence of different Tash and different Pd/Mg(NO3)2 chemical modifier mixture concentrations on the As analyte absorbance signal and the background contribution at three different chemical modifier concentrations: 4.0 µg Pd/10.0 µg Mg(NO3)2 in 5 µL solution, 8.0 µg Pd/10.0 µg Mg(NO3)2 in 5 µL solution, and 16.0 µg Pd/10.0 µg Mg(NO3)2 in 5 µL solution. These experiments were performed at a Tatom of 2300 °C. The As analyte absorbance at a certain Pd/Mg(NO3)2 concentration was similar for all three media ( Fig. 4a ); however, the intensity of the analyte absorption changed when different concentrations of Pd/Mg(NO3)2 were employed (it is similar for 4.0 µg Pd/10.0 µg Mg[NO3]2 in 5 µL solution and 8.0 µg Pd/10.0 µg Mg[NO3]2 in 5 µL solution but lower for 16.0 µg Pd/10.0 µg Mg[NO3]2 in 5 µL solution). On the other hand, a relatively high background contribution was measured for all three media at Tash lower than 600 °C, being the most intense at 200 °C. However, the background contribution further decreased by increasing the Tash from 600 °C to 1000 °C ( Fig. 4b ), without a significant influence on the As analyte absorbance ( Fig. 4a ).
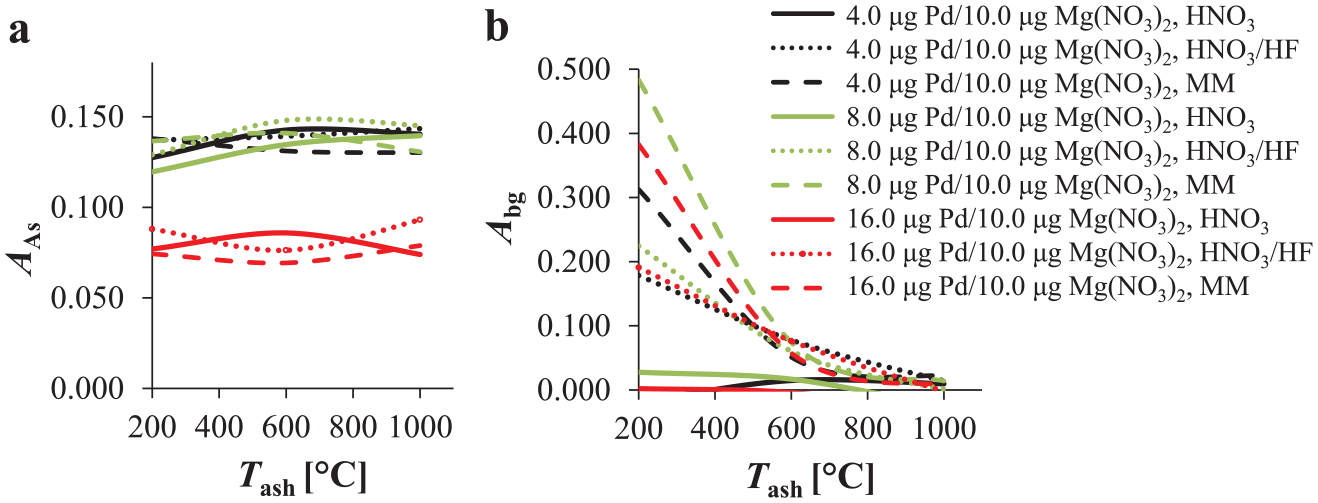
The influence of different concentrations of the Pd/Mg(NO3)2 chemical modifier mixture and different Tash on (
Based on the above results, a Tash of 1000 °C and 8.0 µg Pd/10.0 µg Mg(NO3)2 in 5 µL of chemical modifier mixture were employed in the subsequent method validation. The final optimized temperature program is reported in Table 1 . Next, the ETAAS method was validated for the linear concentration range, LOD, LOQ, precision, and accuracy.
Arsenic Determination in TiO2 Pigment
Matrix effects and linearity determination
First, analyses were performed using the absorbance peak area or absorbance peak height as an analytical signal that changes with the As concentration change. Six replicate measurements were performed at each concentration point (outliers were not detected using Dixon’s and Grubbs’s statistical test 43 ). Linearity was checked for HNO3 and MM media prepared as described in the Materials and Methods section. By fitting the linear calibration plot with the A versus γ relationship, the linear response (R2 = 0.999) was obtained in the 5.0 to 100.0 µg/L concentration range for both peak area and peak height signals using the linear least squares regression method ( Fig. 5 ). However, the signal variance (for both media and for both analytical signals) at a given concentration point constantly increased with an increase in As concentration (heteroscedasticity). The latter calls for a weighted regression analysis. On the other hand, A and γ data transformation to A0.5 and γ0.5 resulted in homogenous variances at every concentration point measured (homoscedasticity), as confirmed by Hartley’s, Cochran’s, and Bartlett’s tests on variances, 43 and because of the convenience of the latter, this transformation was employed for subsequent analyses. Using this approach, A0.5 versus γ0.5 was fitted with a linear calibration plot in the 2.2 to 10.0 (µg/L)0.5 range (5.0–100.0 µg/L As concentration) using the linear least squares regression method for both the peak absorbance area and the peak height signals.
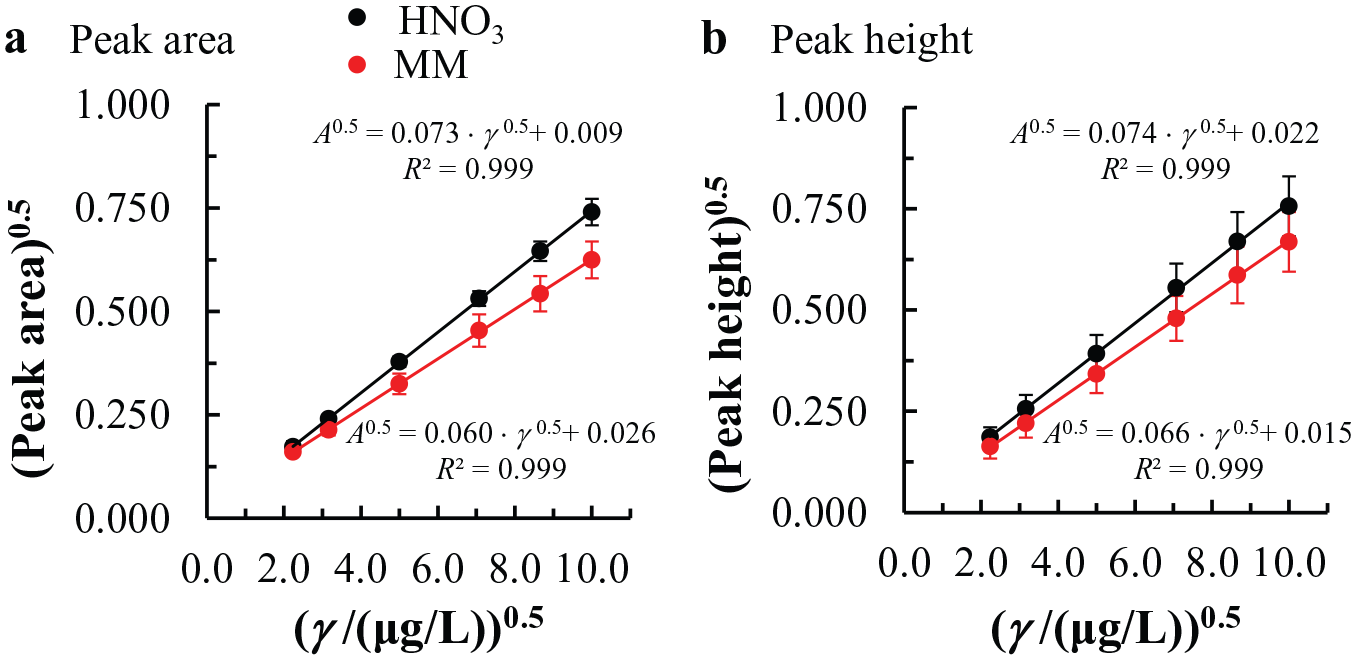
Linear concentration ranges determined in HNO3 and MM media. The analytical signal was determined using (
Next, the influence of the matrix effect on the linear calibration plot slopes was checked using the t test. The latter analysis showed that the calibration plot construction using HNO3 and MM media resulted in statistically different slopes at 95% confidence when As determination was taken into account (this was already expected, as the calibration curve slopes for MM and HNO3 media in Fig. 5 are significantly different for both of the analytical signals). Therefore, for As determination in TiO2 matrices, it is necessary to apply a matrix-matching solution to prepare a calibration plot for real sample analysis to avoid systematic error.
Final linearity determination for the absorbance peak area signal and the MM medium was performed by analyzing the distribution of residuals. They were randomly and normally distributed at different concentration points. Finally, the appropriateness of the linear model to describe the linear relationship between the A0.5 versus γ 0.5 was confirmed with an analysis of variance by employing Fisher’s test and taking into account 95% confidence. The analysis of the square of the correlation coefficient and the quality coefficient resulted in R2 > 0.999 and QC ≤ 5.0%, respectively, as required for linearity. 43 A higher limit of the linear concentration range (100.0 µg/L) was confirmed using the Horwitz test by calculating the Horrat ratio, which was lower than 1 and therefore acceptable.
LOD, LOQ, accuracy, and precision determination
To determine LOD, LOQ, accuracy, and precision, the absorbance peak area was used as an analytical signal. The LOD was determined based on (3 standard deviations)/slope analysis (10 instead of 3 for LOQ) by 10 absorbance measurements of blank MM solution and the calculation of the standard deviation of the blank, sblank. The calculated LOD and LOQ values were 1.6 µg/L and 5.3 µg/L, respectively. Moreover, the LOD and LOQ calculated based on the 500 mg of TiO2 pigment employed in the MM preparation procedure were 0.2 µg/(g TiO2) and 0.7 µg/(g TiO2), respectively.
Accuracy determination was performed by a recovery value calculation for 16 samples spiked with 5 mg/kg As. Accuracy was tested for the real TiO2 pigment samples obtained from the production processes of the company Cinkarna (Celje, Slovenia) in different time periods. These samples either contained or did not contain trace amounts of As. The average recovery value was 92.0%, and no measurements were detected outside the 80.0% to 120.0% recovery interval ( Fig. 6 ). The ETAAS measurement accuracy was confirmed with the referential inductively coupled plasma mass spectrometry method using the t test, which showed that both methods produced statistically the same results at 95% confidence.
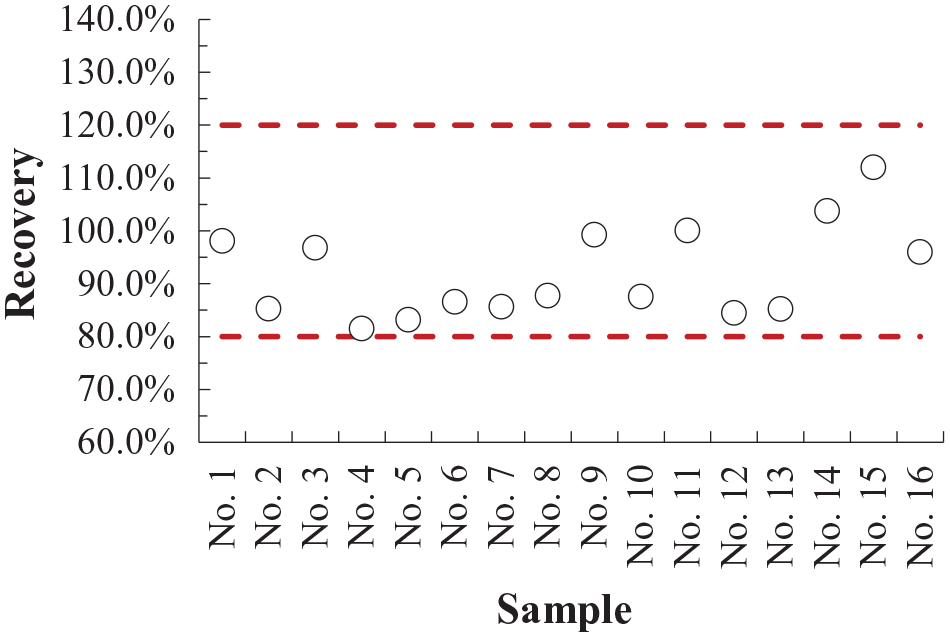
The recovery values determined for the different real TiO2 pigment samples. The horizontal dashed lines represent the acceptable 80.0% to 120.0% recovery interval.
Furthermore, precision was evaluated by replicate measurements using the absorbance peak area signal and by the relative standard deviation (RSD) calculation. For the samples reported in Figure 6 , the RSD values were always equal to or lower than 10.4%. Based on the above-mentioned results, it can be concluded that the optimized ETAAS method reports accurate (recovery values within the 80.0% to 120.0% interval) and precise (RSD ≤ 20.0%) results. 44
Morphology of the Platform/Graphite Tube
Figure 7 shows scanning electron micrographs of the cuvette’s platform before the first use and after 250 successive drying, ashing, and atomization procedures (as described above). It was noticed that after 250 uses, the shape of the drop started to become irregular because of the morphological changes to the platform. A comparison of Figure 7a and b shows a significant influence on the surface after such a number of successive uses. It has to be pointed out that the HNO3 and HF acids that were used have an influence on the graphite coating, as they penetrate inside the pores and a sudden temperature increase leads to the formation of blisters that damage the surface. Under the experimental conditions used, it was noticed that the graphite coating starts to peel off after 250 uses. The latter produces an irregular drop shape after the injection, which strongly influenced the accuracy and precision of the method. Moreover, Figure 7c shows that residues of titanium remain on the surface after such a number of successive uses (the carbon signal originates from the graphite coating), which produce a memory effect.
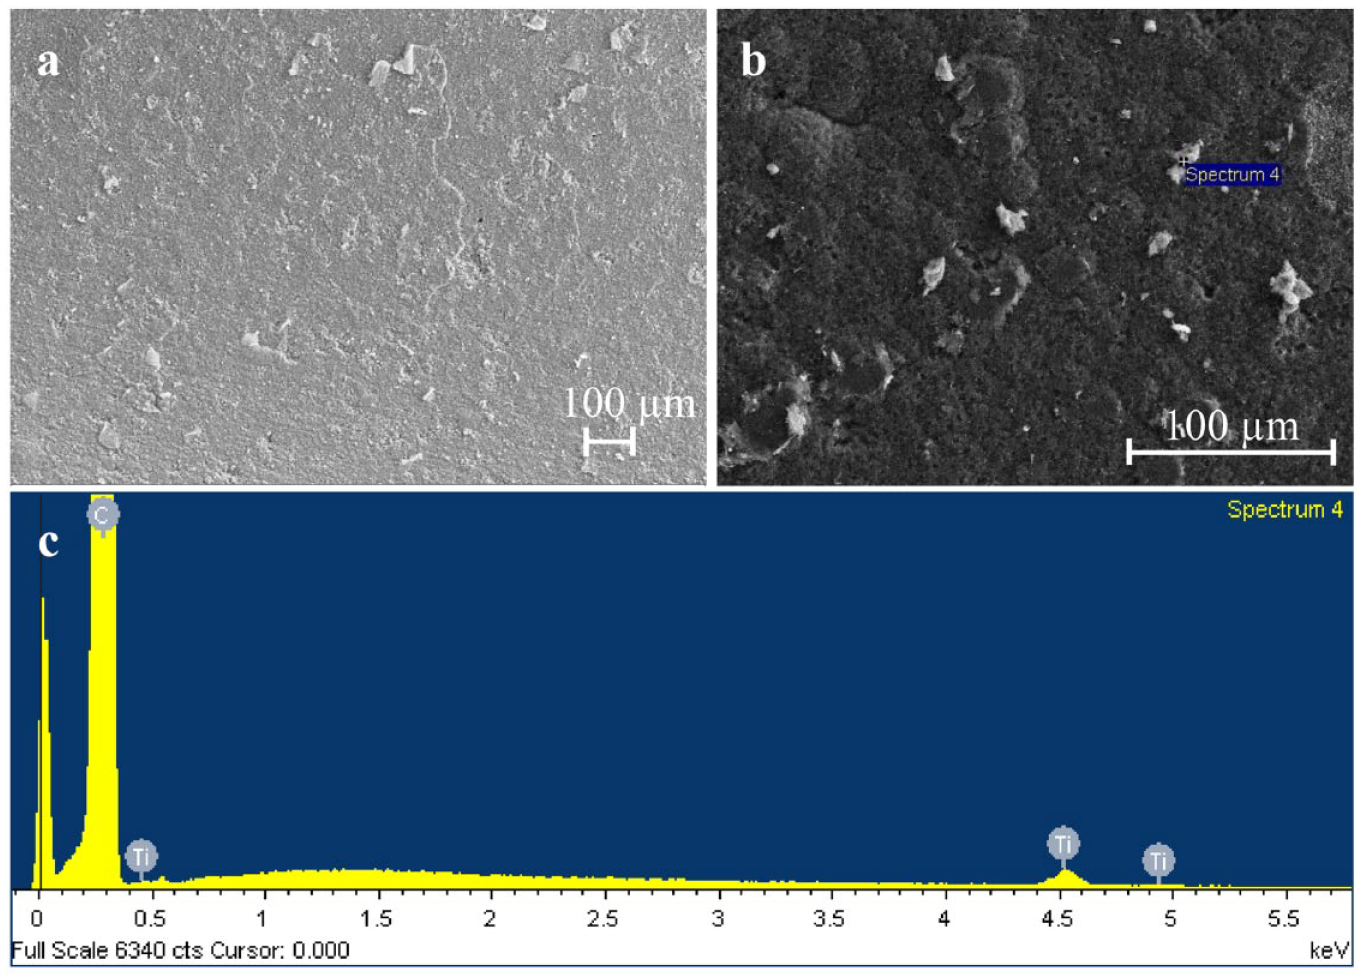
Scanning electron micrographs of the cuvette’s platform (
Conclusions
Herein, ETAAS and Zeeman-effect background correction in combination with closed-vessel microwave digestion were successfully applied to determine traces of As in TiO2 pigment.
First, the drying, ashing, and atomization temperatures were optimized. Drying was performed in 3 steps (i.e., at 85 °C, at 110 °C, and at 130 °C). The ashing (pyrolysis) and atomization temperatures were determined to be 1000 °C and 2300 °C, respectively. Next, it was shown that the background contribution could be minimized with the use of a Pd/Mg(NO3)2 chemical modifier mixture without significant loss of the As analyte. The use of a 5 µL solution containing 8.0 µg of Pd and 10.0 µg of Mg(NO3)2 that was simultaneously injected along with 20 µL of the analyte-containing solution was shown to be successful.
Data transformation to the square root of the absorbance and the square root of the concentration resulted in a homoscedastic data distribution (statistically equal variances at every given concentration calibration point) in the 5.0 to 100.0 µg/L range. Next, the need for matrix-matching calibration was presented, where it was proven by means of the statistical t test that the calibration solutions needed to contain the same matrix as the real sample analysis to avoid systematic error. The determined LOD and LOQ were 0.2 µg/(g TiO2) and 0.7 µg/(g TiO2), respectively. The latter complies with Commission Directive 2008/128/EC, which does not allow more than 3 µg As/(g product) as the specific criteria of purity. Moreover, the developed ETAAS method produces accurate and precise results (i.e., an average recovery of 92.0% and an RSD ≤10.4% were obtained). Finally, it was proposed that a pyrolytic graphite-coated tube with a platform can be used up to 250 times before it needs to be replaced with a new one in order to obtain the desired analytical results.
Footnotes
Declaration of Conflicting Interests
The authors declared no potential conflicts of interest with respect to the research, authorship, and/or publication of this article.
Funding
The authors received no financial support for the research, authorship, and/or publication of this article.