
Abstract
The recent renascence of phenotypic drug discovery (PDD) is catalyzed by its ability to identify first-in-class drugs and deliver results when the exact molecular mechanism is partially obscure. Acute respiratory distress syndrome (ARDS) is a severe, life-threatening condition with a high mortality rate that has increased in frequency due to the COVID-19 pandemic. Despite decades of laboratory and clinical study, no efficient pharmacological therapy for ARDS has been found. An increase in endothelial permeability is the primary event in ARDS onset, causing the development of pulmonary edema that leads to respiratory failure. Currently, the detailed molecular mechanisms regulating endothelial permeability are poorly understood. Therefore, the use of the PDD approach in the search for efficient ARDS treatment can be more productive than classic target-based drug discovery (TDD), but its use requires a new cell-based assay compatible with high-throughput (HTS) and high-content (HCS) screening. Here we report the development of a new plate-based image cytometry method to measure endothelial barrier function. The incorporation of image cytometry in combination with digital image analysis substantially decreases assay variability and increases the signal window. This new method simultaneously allows for rapid measurement of cell monolayer permeability and cytological analysis. The time-course of permeability increase in human pulmonary artery endothelial cells (HPAECs) in response to the thrombin and tumor necrosis factor α treatment correlates with previously published data obtained by transendothelial resistance (TER) measurements. Furthermore, the proposed image cytometry method can be easily adapted for HTS/HCS applications.
Keywords
Introduction
Acute respiratory distress syndrome (ARDS) and acute lung injury (ALI) are serious medical conditions with high mortality rates ranging from 30% to 47% depending on the severity. They are characterized by the rapid development of pulmonary edema followed by lung failure. Estimated incidents of ARDS in the United States range from 64.2 to 78.9 cases per 100,000 in the pre-COVID-19 era and are even higher during the pandemic, 1 and it globally affects more than 3 million people annually. Although the condition was first described in 1967, 2 there are currently no pharmacological therapies that have been proven effective in ARDS treatment. 1 Current ARDS management focuses on respiratory support with careful fluid management and general support measures. 3 The onset of pulmonary edema occurs early during ARDS development and contributes to major lung damage. 4 The main pathological mechanisms of pulmonary edema development are the disruption of epithelial 5 and endothelial 6 barriers. Disruption of the endothelial barrier with impaired alveolar liquid clearance plays a crucial role in the first stage of edema development, while epithelial barrier disruption is important during the later stage of edema development. Furthermore, it is important to note that ARDS is the main cause of death for COVID-19 patients.7–9
Both trans- and paracellular pathways control the passage of fluids and biomolecules through the endothelium. 10 It is believed that the pathological increase in endothelial permeability during ARDS/ALI development is mainly due to paracellular pathway malfunctions. 11 The endothelial paracellular permeability is controlled by adherens junctions and focal adhesions, which mediate cell–cell and cell–matrix connections, respectively. Both structures are tightly linked to the actin cytoskeleton.10–13 Various signaling pathways and cellular processes including Rho/Rac signaling, integrin/FAK signaling, myosin light-chain kinase, vascular endothelial growth factor, angiotensin, and Tie2 receptor-meditated signaling have been demonstrated to be involved in the regulation of endothelial paracellular permeability.11–23 Drug development thus far has been focused on inhibiting these pathways or treating inflammation and edema, yet none have been successful.24,25 Altogether, these results strongly indicate the need for additional systematic analysis of signaling pathways controlling paracellular permeability in pulmonary vasculature.
The reliable and robust in vitro secondary assay is an indispensable prerequisite of the target-based drug discovery (TDD) approach, and it becomes absolutely essential if the phenotypic drug discovery (PDD) approach is selected. 26 There are currently two widely used methods of in vitro endothelial barrier function assay. The first method is the measurement of the permeability coefficient of a molecular tracer, and the second method is the measurement of transendothelial resistance (TER). 27
In the permeability coefficient measurements, the wells of a cell culture plate are separated into two compartments (upper [acceptor] and lower [donor]) by transwell inserts characterized by their highly porous membranes (
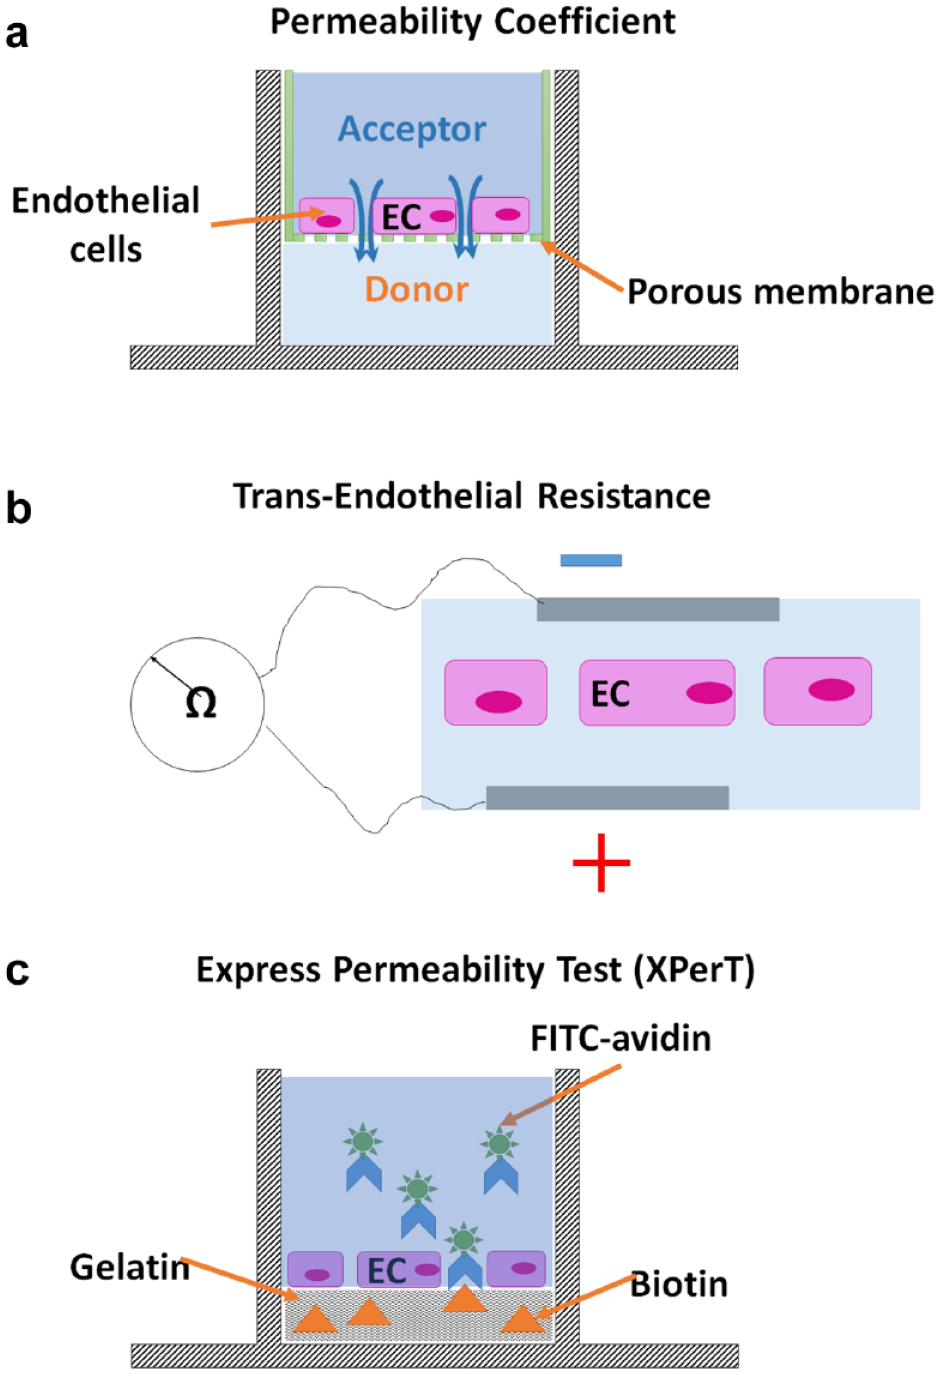
Methods for assessment of endothelial barrier function. (
Alternatively, the TER measurement requires a simple setup for determining the electrical resistance (Ω) between two electrodes placed on opposite sides of the cell monolayer
28
(
In order to improve upon these well-established methods, an alternative method called the eXpress Permeability Test (XPerT) assay has been proposed and demonstrated.
29
High-affinity fluorescently labeled avidin molecules are exposed to a fully confluent cell monolayer grown in a standard microplate coated with biotinylated gelatin on the well surface (
Image-based assays have been proposed as an alternative approach to measure cell permeability since it is possible to directly image and analyze individual cells in standard plates. 29 In this work, we demonstrate the use of the Celigo Image Cytometer (Nexcelom Bioscience, Lawrence, MA) in combination with the XPerT assay to directly measure cell permeability based on the fluorescently labeled area in a 96-well plate. We investigated the time-course and dose-dependent cell permeability effects of thrombin, 30 tumor necrosis factor α (TNF-α), 31 lipopolysaccharide (LPS), 32 and interleukin 6 (IL-6) on primary human pulmonary artery endothelial cells (HPAECs). In addition, we performed a rho kinase (ROCK) inhibition assay to assess the inhibitory effects of Fasudil on thrombin-induced permeability increase. The measured cell permeability based on fluorescent area using image cytometry showed comparable results to plate reader and ImageJ analysis, as well as previous publications.31,33,34 The employment of an image cytometry system to investigate cell permeability would provide substantial benefits, especially for drug discovery applications. These potential benefits include (1) the combination of high-content imaging with automatic digital records, (2) an improved signal-to-noise ratio due to the ability to threshold fluorescent intensity in permeable areas, and (3) the ability to exclude areas with a damaged monolayer from the measurements. Furthermore, this approach can be adapted for high-throughput screening (HTS) assays using multiwell microplate formats.
Materials and Methods
Cell Culture
Primary HPAECs were purchased from Lonza (Walkersville, MD). The cells were cultured in standard cell culture T-75 flasks coated with rat tail collagen (R&D Biosystems, Minneapolis, MN). For the cell culture flask coating, the rat tail collagen solution was diluted with sterile cell culture-grade endotoxin-free water (Hyclone, Logan, UT) to a final concentration of 150 µg/mL, which was subsequently added to the flask with sufficient volume to cover the growth surface. The rat tail collagen sorption was incubated at 37 °C and 5% CO2 for 14–18 h. After sorption, the collagen solution was aspirated and the surface was washed with an equal volume of Dulbecco’s phosphate-buffered saline (DPBS) at pH 7.4.
The original HPAECs obtained at passage 3 were cultured and cryopreserved at passage 5 in recover cell freezing media (Thermo Fisher Scientific, Waltham, MA) at a cell density of 1 × 10⁶ cells/mL. The cells were cultured in EMB-2 media supplemented with the EGM-2 single-bullet kit (Lonza). For cell detachment from the growth surface, the cell monolayer was washed with prewarmed DPBS at 37 °C without magnesium and calcium and treated with TrypLE solution for 3–4 min at 37 °C and 5% CO2. All cell-based assays were performed using cells from passage 5.
Preparation of Biomolecular Soluble Factors for XPerT Assays
Various biomolecular soluble factors were utilized for the XPerT assays. TNF-α (R&D Biosystems) was reconstituted in sterile PBS at a concentration of 0.1 mg/mL. IL-6 (Life Technologies, Carlsbad, CA) was reconstituted in 100 mM sterile acetic acid to a concentration of 0.1 mg/mL. TNF-α and IL-6 were aliquoted for single use and stored at –80 °C. LPS solution at 1 mg/mL from Escherichia coli was purchased from Enzo Life Sciences (Farmingdale, NY) and stored at 4 °C. Fasudil was purchased from LC Laboratories (Woburn, MA), reconstituted in sterile DMSO at a 20 mM concentration, and stored at –20 °C. On the day of treatment all compounds were prepared as 10× stocks in EGM-2 media.
Gelatin Biotinylation and Plate Coating
Porcine skin gelatin was purchased from Sigma-Aldrich (St. Louis, MO). The gelatin first was dissolved in 100 mM bicarbonate buffer solution (pH 8.2) to a final concentration of 10 mg/mL. The dissolved gelatin was then biotinylated with the EZ-link NHS-biotin reagent (3× molar access, Thermo Fisher Scientific) at room temperature for 1 h. Subsequently, the biotinylated gelatin was aliquoted and stored at –20 °C prior to plate coating.
For the XPerT assay plate coating, the biotinylated gelatin solution was first thawed in a 37 °C water bath and diluted with the bicarbonate buffer solution to a final concentration of 100 µg/mL. The diluted gelatin was then filtered through a 0.22 µm filter, added (50 µL) to each well in 96-well plates, and incubated on an orbital rotation mixer at 4 °C for 14–18 h. After gelatin sorption, the plates were washed twice with DPBS and used immediately for cell seeding.
XPerT Assay Protocol
In general, the XPerT assay was performed by first seeding the endothelial cells in the biotinylated gelatin-coated 96-well plates at a density of 12,000–15,000 cells/well in 100 µL. After seeding, the plate was allowed to incubate overnight to allow cell adherence. Next, the cells were treated with the selected soluble factors (thrombin, TNF-α, LPS, and IL-6) for a specific amount of treatment time. All treatments were added to cells as 10× solutions in EGM-2 media.
After the cells were treated with the soluble factors, the cell monolayer was stained with a fluorescein isothiocyanate (FITC)–avidin solution (Life Technologies). The staining solution was first diluted to a final concentration of 25 µg/mL in EGM-2 media. Next, the treatment media was removed from the wells by a quick but gentle aspiration, replaced with 50 µL of the FITC–avidin solution for 2 s, and then immediately removed by a quick aspiration. The cells were then fixed to terminate the avidin binding by replacing the FITC–avidin solution with a 3.7% formaldehyde solution in PBS and incubated for 10 min at room temperature. After removing formaldehyde solution, 100 µL of DPBS was added into the 96-well plates and stored at 4 °C prior to fluorescence plate reading or image cytometric analysis using the Celigo Image Cytometer. Figure 2 showed an example of high and low cell permeability when labeled with FITC–avidin.
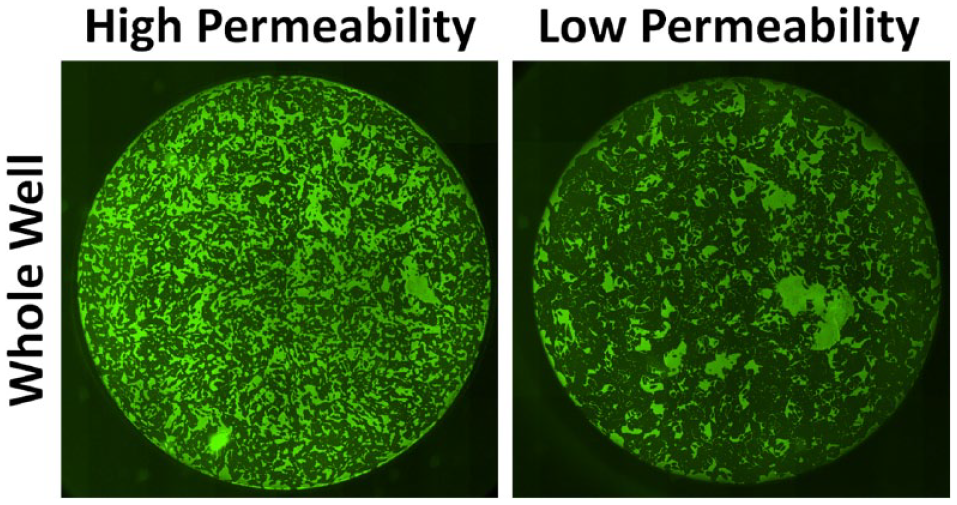
Images of FITC–avidin with cells with high-permeability HPAECs versus low-permeability HPAECs. Images were acquired with the Celigo from a 96-well plate of green fluorescent whole-well images of FITC–avidin binding to an HPAEC monolayer on a gelatin-coated surface.
Time-Course Measurement of Cell Permeability Effects of Thrombin, TNF-α, and LPS
HPAECs were seeded in the biotinylated gelatin-coated 96-well plates at a density of 15,000 cells/well and incubated overnight. After incubation, the cells were treated with 0.3 U/mL thrombin, 25 ng/mL TNF-α, and 100 ng/mL LPS at n = 3. The soluble factors were added into the wells sequentially with respect to the treatment times at 23, 6, 5, 4, 3, 2, 1, and 0.5 h prior to fixing the cells. Negative control wells with vehicle (PBS) for 23 h were also included. The image cytometer was used to acquire bright-field and fluorescent images immediately after plate fixation and staining to measure fluorescent confluence percentages for each treatment time. The measured confluence percentages were used to calculate the normalized probe-accessible area using the equation
Dose Dependence Measurement of Cell Permeability Effects of TNF-α, LPS, and IL-6
HPAECs were seeded in the biotinylated gelatin-coated 96-well plates at a density of 12,000 cells/well and incubated overnight. After incubation, the cells were treated with TNF-α (12.5, 25, 50, 100 ng/mL) and LPS (62.5, 125, 250, 500 ng/mL) at 31, 19, and 6 h prior to fixing the cells (n = 4). The cells were also treated with IL-6 (3.1, 6.3, 12.5, 25, 50, 100, 200 ng/mL) for 19 h (n = 4). The image cytometer was used to acquire bright-field and fluorescent images immediately after plate fixation and staining to measure fluorescent confluence percentages for each treatment time. The measured confluence percentages were used to calculate the normalized probe-accessible area, and then plotted in dose–response graphs to display the cell permeability effects of TNF-α, LPS, and IL-6.
ROCK Inhibition Assay Using Fasudil
HPAECs were seeded in the biotinylated gelatin-coated 96-well plates at a density of 12,000 cells/well and incubated for 6 h and then pretreated with Fasudil at 0 (vehicle: PBS), 0.3, 0.6, 1.3, 2.5, 5, 10, and 20 µg/mL for 18 h (n = 3). After overnight incubation, the cells were challenged with 0.3 U/mL thrombin for 1 h and fixed for staining. The image cytometer was used to acquire bright-field and fluorescent images after the thrombin challenge to measure fluorescent confluence percentages. The measured confluence percentages were used to calculate the normalized probe-accessible area and then plotted in dose–response graphs to display the cell permeability inhibitory effects of Fasudil.
Celigo Image Cytometer Data Acquisition and Analysis
The Celigo Image Cytometer was used to measure the fluorescent confluence percentage from the cell monolayer to determine cell permeability. It employs one bright-field and four fluorescent imaging channels— blue (excitation [EX] 377/50 nm, emission [EM] 470/22 nm), green (EX 483/32 nm, EM 536/40 nm), red (EX 531/40 nm, EM 629/53 nm), and far red (EX 628/40 nm, EM 688/31 nm)—for cell-based assays.35–37 Cells seeded in standard microplates are autofocused, scanned, and analyzed in the software, which consists of five major steps: START, SCAN, ANALYZE, GATE, and RESULTS.
The software application “Confluence 1 + 2” was employed for determining cell permeability by measuring the fluorescent cell monolayer confluence area. Bright-field (exposure: auto) and FITC (exposure: 80–100 ms at 350 gain) images were acquired to measure cell monolayer confluence percentages in the green channel. The ANALYZE parameters for the green channel were set to “Algorithm = FL Confluence,” “Intensity Threshold = 40 – 100,” “Saturated Intensity = 0,” “Precision = High,” “Cell Diameter = 8,” “Background Correction = Not Check,” and “Minimum Thickness = 0.” The ANALYZE parameters for the bright-field channel were set to “Algorithm = Texture,” “Intensity Threshold = 255,” “Saturated Intensity = 0,” “Precision = Low,” “Cell Diameter = 8,” “Background Correction = Not Check,” and “Minimum Thickness = 3.” The bright-field images were only used for visualization purposes.+
Comparison of Assay Quality between Plate Reader and Image Cytometer
For the bulk fluorescence measurements, the Synergy Neo2 HTS Multi-Mode Microplate Reader (BioTek, Winooski, VT) was used following the manufacturer’s recommended setting for fluorescein measurements. The EX 485 nm, EM 516 nm filter set was used to capture the fluorescent intensities.
The XPerT assay was performed with HPAECs seeded in the biotinylated gelatin-coated 96-well plates at a density of 15,000 cells/well and incubated overnight. After incubation, the cells were treated with 0.3 U/mL thrombin or vehicle (PBS) for 60 min (n = 3). After cell FITC–avidin staining and fixation, the plate was imaged and analyzed using the image cytometer and then the normalized probe-accessible area was calculated. The same plate was read using the plate reader to generate fluorescent signals, which was then used to calculate normalized signals. The Z′ values were calculated using the equation
Image Analysis Using ImageJ
The time-course thrombin experimental images acquired from the image cytometer were converted based on their pixel intensities, using fixed threshold values. The numbers of FITC-positive and FITC-negative pixels were calculated and exported into Excel for calculating the normalized probe-accessible area and statistical analysis. The results were compared directly with the Celigo software analysis algorithm.
Statistical Analysis
The p value and significance data were processed in the Prism software (GraphPad, San Diego, CA). The p value was calculated using a one-way analysis of variance (ANOVA) nonparametric test relative to the control samples. The significance level intervals have been designated as follows: p > 0.05 is not significant, *p ≤ 0.05, **p ≤ 0.01, ***p ≤ 0.001, and ****p ≤ 0.0001.
Results
Time-Course Effects of Thrombin, TNF-α, and LPS Treatment on Cell Permeability
The XPerT assay was conducted to investigate the performance of the image cytometry method to assess the level of cell permeability at various time points after treatment with thrombin, TNF-α, and LPS. Previous studies have shown that these compounds will increase endothelial cell monolayer permeability.31,33,34 The increase in cell monolayer permeability in response to thrombin treatment reached the maximum response between 30 and 60 min of treatment, and basal permeability was completely restored after 4 h (Fig. 3a). In contrast, the TNF-α-induced cell permeability disruptions reached the maximum response after 24 h of treatment (Fig. 3b). Finally, the LPS-induced cell permeability disruption was not as pronounced as that for thrombin and TNF-α, which only showed a slight increase above the basal level in the 24 h of treatment (Fig. 3c). The time-dependent green fluorescent images are shown in Figure 3d, which show respective increases or decreases in fluorescent area.
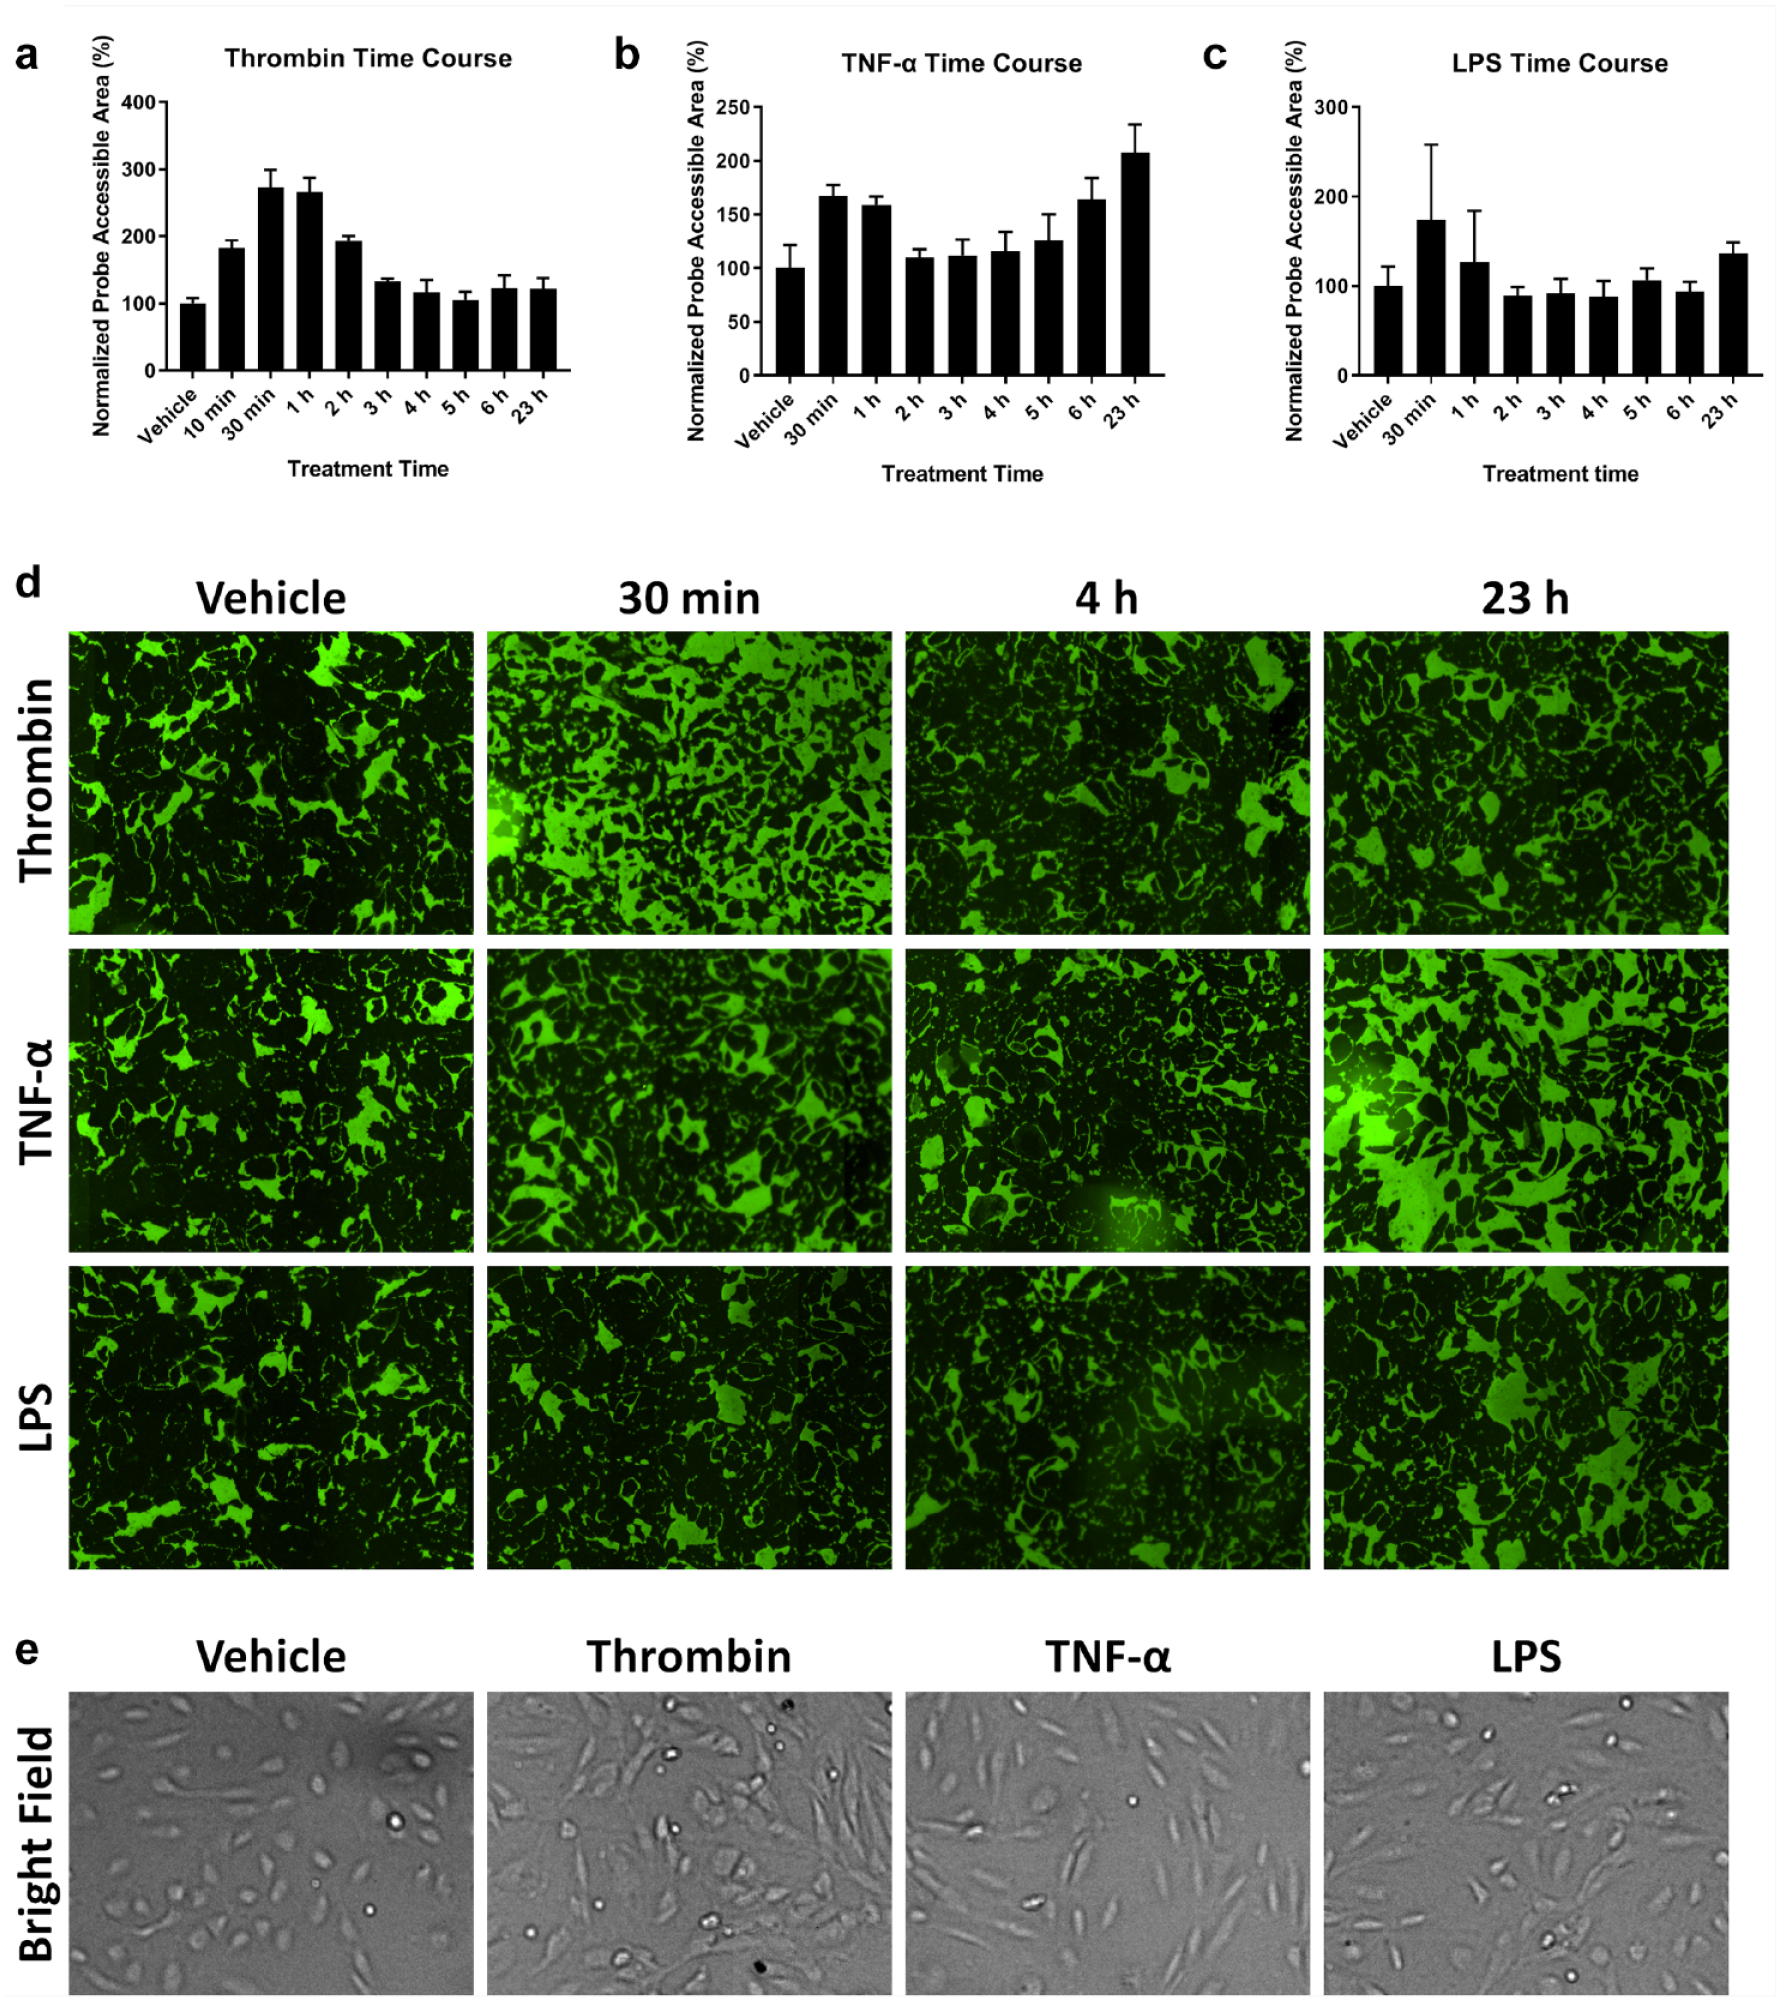
Time-course assay with cells treated with thrombin, TNF-α, and LPS shows that these compounds affect cell permeability at various time points. The XPerT assay was performed with the three soluble factors that are known to cause changes in cell permeability. HPAECs were treated with (
It is interesting to note that we observed a short immediate increase in the permeability during the first 30–60 min of each treatment. Therefore, the endothelial cell permeability disruption by TNF-α and LPS may have a biphasic response curve. In addition, thrombin, TNF-α, and LPS caused some noticeable morphological changes. Visually, thrombin treatment caused slight shrinkage in cell size and cell edge retraction, TNF-α caused cell elongation, and LPS seemed to show both effects (Fig. 3e).
Dose Response of TNF-α, LPS, and IL-6 Treatment on Cell Permeability
The XPerT assay was conducted to investigate the performance of the image cytometry method to assess the level of cell permeability when treated with TNF-α, LPS, and IL-6 at different concentrations. The results showed similar dose-dependent increases in cell permeability when HPAECs were treated with TNF-α and LPS measured at different time points (
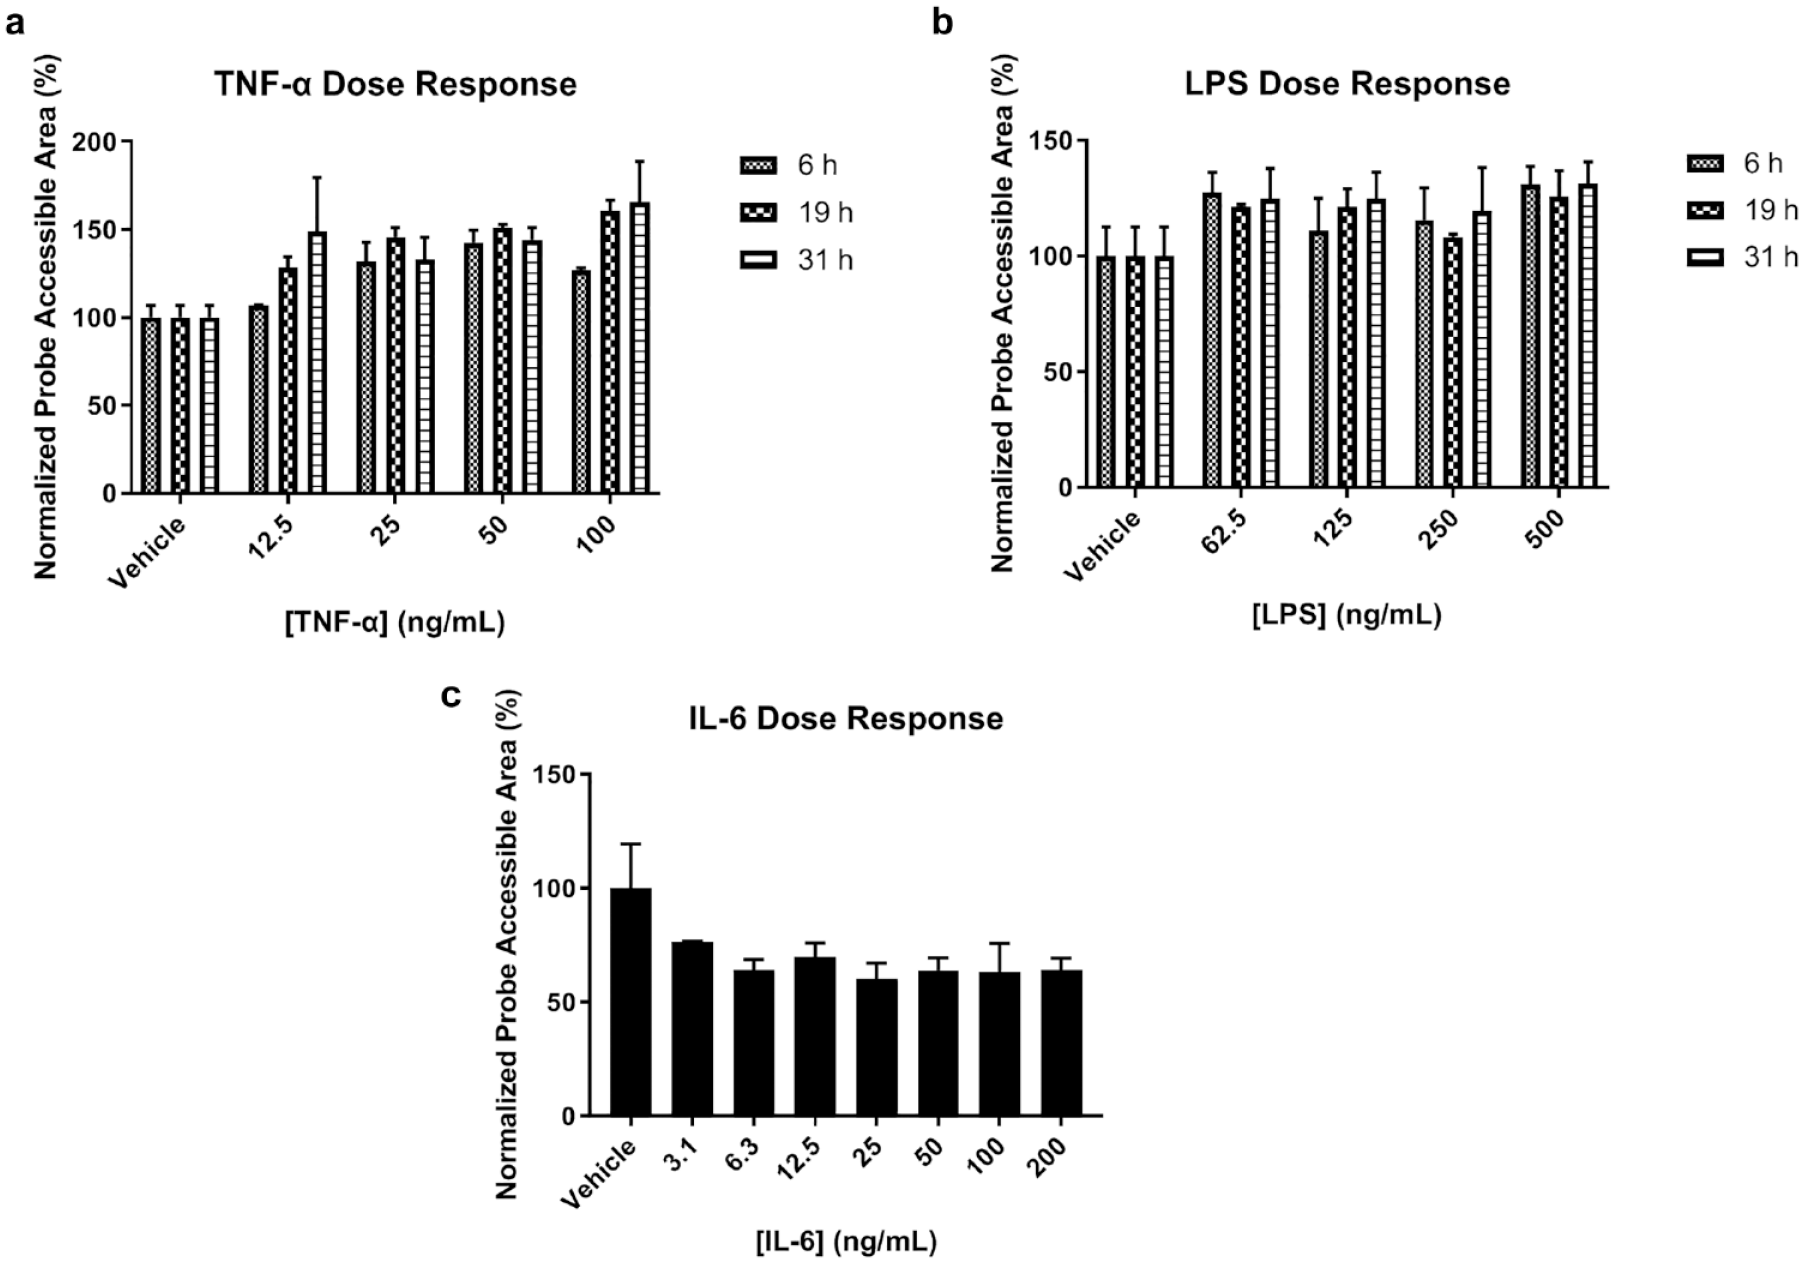
Various dosages of TNF-α, LPS, and IL-6 affect cell permeability at different time points. HPAECs were treated with (
Cell Permeability Inhibition Effect of Fasudil on Thrombin Challenge
The ROCK inhibition assay was conducted to demonstrate the ability of image cytometry to detect cell permeability inhibition of Fasudil on thrombin challenge. The dose-dependent green fluorescent images are shown in
Figure 5a
, which show a gradual reduction of fluorescent area with respect to the Fasudil concentration. In the data quantification, the Fasudil showed a clear inhibition effect on the thrombin challenge as the concentration increased (
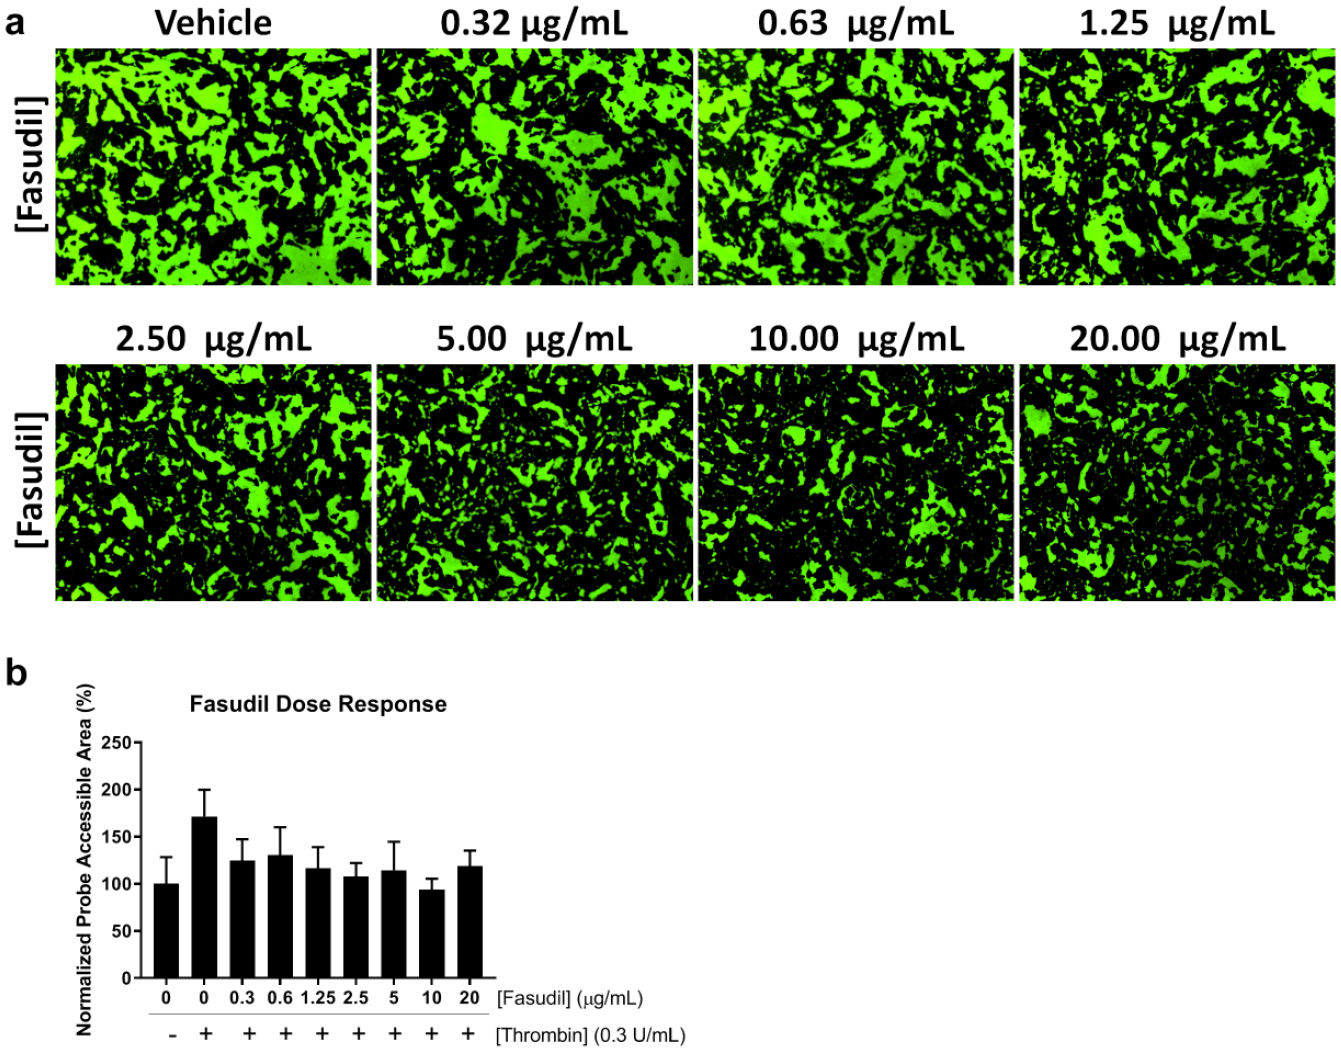
Fasudil treatment inhibits the effect of thrombin on cell permeability. (
Comparison between Bulk Fluorescence and Tracer-Accessible Area Measurements
An XPerT assay was performed in one 96-well plate to determine the assay quality between the plate reader and image cytometer. By using the positive (thrombin) and negative (vehicle) sample results, we were able to calculate the Z′ values for each method for comparison (
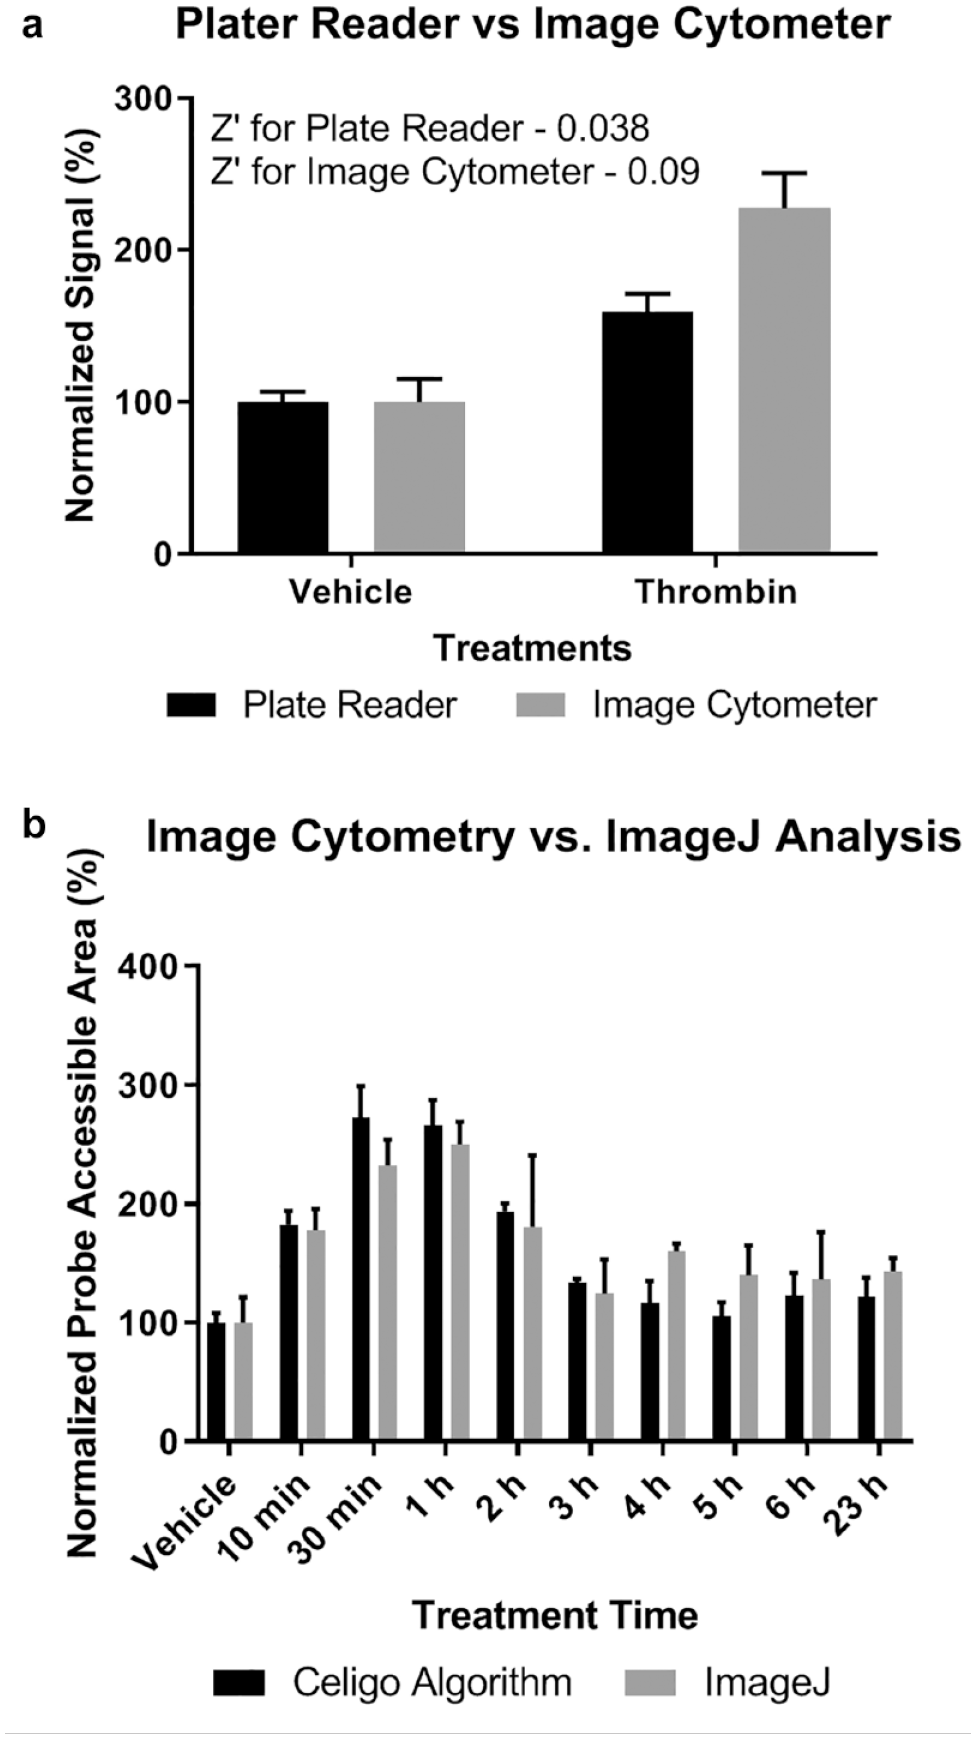
Image cytometry is comparable to other methodologies for measuring HPAEC permeability. (
Comparison of ImageJ and Image Cytometry Analysis Algorithm
In order to find the optimally suited software algorithm for image data analysis, we compared the performance of ImageJ and the built-in Celigo software algorithm. The image cytometry-acquired fluorescent images from the thrombin challenge time-course experiment were analyzed in the ImageJ software. The image cytometry algorithm produced lower standard deviation values and a slightly higher signal window (
Discussion
The absence of improvements in ARDS treatment for the past four decades has sparked highly valuable new drug discovery initiatives. The identification of potential target candidates and the drug discovery process itself require a reliable HTS-compatible cell-based assay. In addition, a good and appropriate in vitro disease model is important when the condition is rare and clinical data cannot provide reliable biomarkers or details for the disease mechanisms.
The permeability of a healthy endothelium is typically controlled by the state of adherens junction and focal adhesion. Small-molecule compounds may modulate the permeability of endothelium-inducing perturbations in the cell physiology of adherens junction and focal adhesion. However, small-molecule compounds may also activate the necrosis/apoptosis pathways, thus increasing cell permeability, which can be identified as false positives in a screening assay. In addition, cytokine treatment for inhibiting cell permeability may also cause necrosis/apoptosis, again generating false positives. Therefore, it is important to incorporate the investigation of apoptosis and necrosis effects from the tested small-molecule compounds in future studies.
The XPerT assay is a highly promising alternative approach as compared with the permeability coefficient and TER methodologies, due to its adaptability and ability to visualize cell permeability. The visualization aspect of the XPerT assay makes it highly suitable to be adapted for the plate-based image cytometry method.
In this work, we directly translated the XPerT assay to be conducted in the Celigo Image Cytometer. The proposed method automatically acquires bright-field and fluorescent images and directly measures the probe-accessible area, which can minimize variability due to the fluctuation of probe concentration. The results showed more than double the increase in signal window size in comparison with the bulk fluorescence measurements using a conventional microplate reader. Since the XPerT assay can provide instantaneous cell permeability measurements, it was able to produce kinetic measurements of cell permeability, whereas the permeability coefficient method cannot. This was demonstrated by the time-course experiment, where HPAECs were challenged with thrombin, TNF-α, and LPS.
We were able to demonstrate the kinetic disruption of endothelial cell permeability and morphological changes by various soluble factors with distinguishable time dependencies, reflecting their differences in molecular mechanisms. For example, the thrombin treatment caused a pronounced but temporal cell permeability disruption with a maximum response between 30 min and 2 h.30 In contrast, both TNF-α and LPS treatment caused slowly developing permeability disruption that reached a plateau between 12 and 18 h.38 The kinetic cell permeability results showed good correlation reported by the TER method in previous publications.30,38 It is worth mentioning that only TER measurements can resolve time-dependent changes in barrier function after soluble factor challenge. It is important to note that we did not observe any permeability disruption at 23 h for TNF-α, LPS, and IL-6. In addition, the experiment did not reach beyond 23 h due to the concern of cells becoming apoptotic.
The differences observed in the kinetics and cell morphology in response to thrombin, TNF-α, and LPS challenges were mediated by the differences in their molecular mechanisms. The thrombin acts by cleaving the PAR receptor, which culminates in ROCK activation and actomyosin contraction, whereas the involvement of the ROCK in the TNF-α response has yet to be documented.10,39 In order to assess thrombin-mediated permeability disruption on ROCK activity, HPAECs were pretreated with Fasudil for 18 h, a potent ROCK inhibitor, before treatment with thrombin. The pretreatment with Fasudil prevents the endothelial permeability disruption by thrombin. Fasudil is a selective, potent, and orally available inhibitor of ROCK2, which was the first ROCK inhibitor approved for clinical use in Japan and China. On the other hand, Y-27632 has been widely used to explore its effect on ROCK-dependent processes, but has shown less selectivity with strong off-target effects in vitro and in vivo. 40 The biochemical inhibition constant (Ki) for both inhibitors is highly comparable for ROCK2. Furthermore, a study investigating the protective effect of ROCK inhibition on endothelial dysfunction showed no efficiency differences between Fasudil and Y-27632; however, Fasudil showed a higher potency. 41 Therefore, we selected the use of Fasudil for the in vitro assay performed here, which may more closely mimic physiological conditions.
The and IL-6 are two important soluble factors that can affect endothelial cell permeability function. Despite testing a wide range of concentrations and treatment duration, we were able to detect only a small increase in HPAEC monolayer permeability after LPS challenge (Figs. 3c and 4b). LPS has been well characterized as an ARDS-promoting agent in several in vivo models, 42 as well as one of the major culprits in the sepsis-induced ARDS clinical cases. 43 The LPS permeability disruptive activity has also been demonstrated in many in vitro studies using the TER method, where much higher concentrations were used. 32 One of the possible explanations of failure to detect large permeability disruption with LPS is the size of the fluorescent probe used in this assay. The fluorescein-labeled avidin has a molecular weight of approximately 68 kDa. The TER measurement detects changes in electrical conductivity, which corresponds to the size of inorganic ions. Another possible explanation may be an indirect effect of LPS that was mediated by immune cell activation shown in in vivo models and clinical studies. 39 In contrast, IL-6 treatment induced a permeability protective effect, reaching a plateau after 10 ng/mL (Fig. 4c). It is interesting that IL-6 can cause an enhancement in endothelial barrier function. Although a similar explanation to that for LPS may be applied, it is important to note that several studies have reported an endothelial barrier protective function of IL-6.44,45
Although the performance of the XPerT assay for bulk fluorescence measurements using a conventional plate reader has been previously demonstrated, a high measurement variability was reported. 29 We believe that this variability may be due to the local fluctuation of probe concentration because of the short probe exposure. Furthermore, the visualization and assessment of the probe-accessible area may be a more physiologically relevant parameter. In order to compare bulk fluorescence and tracer-accessible surface area measurement, we reproduced the originally published protocol and measured cell permeability using a plate reader and the image cytometer. Although both methodologies displayed low Z′ values, image cytometry results showed two times the Z value, which indicates it may be a more robust method and can be further optimized.
There are various parameters that can be optimized to further improve the image cytometry method. First, the employment of an automated liquid handling system for fluorescent permeability probe staining may improve the precision and reproducibility of the assay. Second, cell media composition can be optimized to achieve lower basal permeability of the endothelial cell monolayer, thus increasing the robustness and the Z′ value of the assay. Finally, the utilization of permeability probes with different molecular weights may provide higher sensitivity to changes in the barrier function.
The advantages of the lateral diffusion visualization and analysis method have allowed for the development of an HTS/HCS (high-content screening)-compatible method to measure endothelial cell permeability. The performance of the proposed image cytometry method was evaluated by conducting the previously published XPerT assay. The image cytometry method was able to provide kinetic and dose-dependent fluorescent area measurement as well as cell morphology visualization. This multiplexing ability is highly valuable for screening applications. It can provide additional data analysis for insights into possible mechanisms of action of hits and potentially reduces false-positive/negative discovery rates by providing alternative ways of activity detection.
Using image cytometry, we were able to successfully use a green fluorescence channel to obtain information about the state of barrier function, and use the bright-field channel to examine the cell morphology. By using other fluorescent channels (blue, red, far red) in the same scan, information about the cellular distribution of junctional and cytoskeletal proteins, phosphorylation state of proteins of interest, reduction/oxidation cellular potential, pro-apoptotic pathway activation, and so forth, may be obtained. The proposed image cytometry method provides an excellent starting point for the development of a high-content, high-throughput multiplexing assay to study pathways involved in the regulation of endothelial barrier function. Another potential application would be the study of cell–cell interactions between endothelial cells and activated immune cells in co-culture. Other future work may be to improve the flexibility of probe sizes used in the assay, where one can substitute the biotinylated gelatin coating with another protein of choice combined with 6–12 His peptide crosslinking. This modification will make it possible to use various Ni chelate conjugates with a wide spectrum of molecular masses and biochemical properties. It will allow simultaneous usage of up to three probes with different molecular weights. Furthermore, the methodology may be adapted to 384-well plates for even higher throughput.
In conclusion, we have reported a new image cell cytometry-based cell monolayer permeability assay with great potential for HTS/HCS integration. The assay can be used to study signaling pathways involved in endothelial barrier regulation using an annotated chemical probe library, potential target identification, and PDD compounds with promising barrier protective functions, which ultimately can lead to new pharmacological approaches of ARDS treatment.
Footnotes
Declaration of Conflicting Interests
The authors declared the following potential conflicts of interest with respect to the research, authorship, and/or publication of this article: L.L.C. and E.H. declare competing financial interests. The research in this paper is for reporting on the use of the Celigo Image Cytometer from Nexcelom Bioscience to perform the XPerT assay.
Funding
The authors received no financial support for the research, authorship, and/or publication of this article.