
Abstract
Biophysical methods are widely employed in academia and the pharmaceutical industry to detect and quantify weak molecular interactions. Such methods find broad application in fragment-based drug discovery (FBDD). In an FBDD campaign, a suitable affinity determination method is key to advancing a project beyond the initial screening phase. Protein-observed (PO) nuclear magnetic resonance (NMR) finds widespread use due to its ability to sensitively detect very weak interactions at residue-level resolution. When there are issues precluding the use of PO-NMR, ligand-observed (LO) NMR reporter assays can be a useful alternative. Such assays can measure affinities in a similar range to PO-NMR while offering some distinct advantages, especially with regard to protein consumption and compound throughput. In this paper, we take a closer look at setting up such assays for routine use, with the aim of getting high-quality, accurate data and good throughput. We assess some of the key characteristics of these assays in the mathematical framework established for fluorescence polarization assays with which the readers may be more familiar. We also provide guidance on setting up such assays and compare their performance with other affinity determination methods that are commonly used in drug discovery.
Keywords
Introduction
Fragment-based drug discovery (FBDD) has delivered four Food and Drug Administration-approved drugs to the clinic since its first mention around 20 years ago. 1 The clinical success of FBDD and its ability to seamlessly insert into more traditional drug discovery settings such as high-throughput screening (HTS) have seen the adoption of FBDD in big pharma. Owing to its lower entry costs, FBDD has also been an enabling method for small biotech companies to establish themselves in the pharmaceutical industry and has found widespread use in academic labs around the globe. FBDD aims to start with low-molecular-weight (MW) hits. Despite their typically low affinity (Kd > 10 µM), fragment hits make well-matched interactions with the target, 2 which, combined with good solubility and synthetic tractability, improves the chances of their elaboration to drug-like leads. Maintaining good physicochemical properties, from the initial fragment hits through to clinical candidate selection, maximizes the chance of successful clinical outcomes. 3
To select ligand-efficient starting points and test initial medicinal chemistry efforts, a highly sensitive method for affinity determination is required. Fragment affinities for their targets are often too low to be reliably detected and quantified by biochemical assays. Instead, more sensitive biophysical methods are usually necessary for this. 4 Nuclear magnetic resonance (NMR) is one of the most popular methods for both fragment screening and affinity determination. Fragment screening can be carried out via ligand-observed (LO) or protein-observed (PO) NMR methods. For affinity determination, PO-NMR, especially 2D heteronuclear NMR, has proven to be one of the most widely applicable methods. This stems in part from the high protein concentrations commonly used in 2D-NMR, precluding the method from being useful for stronger binders and in part from PO-NMR being relatively insensitive to ligand aggregation or other unfavorable compound behavior. 2D-NMR titrations benefit from the exquisite sensitivity of the chemical shift to changes in the surroundings of a spin, allowing detection of even the weakest binding events. Chemical shift changes also allow mapping of the binding site at residue resolution, sometimes even in the absence of resonance assignments. 5 Excellent reviews of how to carry out 2D-NMR titration experiments and perform data analysis have been published.6,7 However, 2D-NMR methods suffer from a few limitations. First, they require isotopically labeled protein. This limits the applicability of the method to targets expressed in Escherichia coli 8 and, in some cases, insect cells. 9 Second, the inherent MW limitations of NMR preclude the analysis of targets much bigger than 50 kDa or 100 kDa by [ 15 N, 1 H] and [ 13 C, 1 H] correlation spectroscopy, respectively.10,11
Here we demonstrate that LO-NMR methods that are traditionally used for fragment screening can avoid some of the limitations of PO-NMR when it comes to measuring affinities. LO-NMR methods monitor not the chemical shift of a spin, but its relaxation (auto- or cross-relaxation) behavior. 12 Both auto-relaxation (of transverse magnetization) and cross-relaxation (of longitudinal magnetization) are more efficient the higher the MW of a protein. They therefore tend to work better for larger targets. Also, LO-NMR experiments do not require the use of labeled target protein, and so can be applied to targets from all expression systems. By virtue of being 1D-NMR methods, LO-NMR experiments typically benefit from increased signal-to-noise (S/N) and data acquisition throughput. Unfortunately, relaxation effects monitored in LO-NMR experiments cannot be easily related to the fraction of ligand that is bound to the target. This is because both auto- and cross-relaxation rates of ligands in exchange between a free and a target-bound state are governed by a complex set of parameters, such as kinetic rates and structural features of the complex. It is thus possible only under special conditions to derive a dissociation constant directly from such effects in a titration experiment. 13 However, if the affinity of one ligand (we use the term “reporter ligand” for this in the rest of this article; in the fluorescence polarization [FP] nomenclature this would often be called the “probe molecule”) for the target is known, that knowledge can be used to derive the affinity of an inhibitor binding to the same site as the reporter ligand.6,14,15 This is an application of a traditional competitive binding equilibrium analogous to FP binding assays or radioligand displacement methods, with which the reader may be familiar. 16 We believe such NMR competition assays are underutilized in the landscape of biophysical and biochemical methods used for affinity determination ( Fig. 1 ). In this paper, we will highlight some of the key similarities and differences between FP and NMR reporter assays. We also show how NMR reporter assays can provide a robust and generic approach for probing a wide range of fragment affinity values with relatively high throughput and using moderate quantities of protein.

An affinity determination in the medium-throughput range but with access to low affinities fulfills an important unmet need in the throughput versus affinity landscape of biophysical and biochemical assays for affinity determination. FBDD campaigns often start with hits that are in this region of the affinity landscape. When a screening campaign delivers many hits and/or during hit validation, a higher throughput than what can be provided by ITC or 2D-NMR is highly desired.
Materials and Methods
NMR Data Acquisition
CPMG (Carr–Purcell–Meiboom–Gill) experiments used in the NMR reporter assays presented in this paper typically consisted of 64–128 spin echoes with the total time of 1 spin echo being 2.5 ms for a total of a 160 or 320 ms relaxation period and a reference experiment containing 4 spin echoes for a total of a 10 ms relaxation period. Experiments were acquired in an interleaved manner resulting in a pseudo-2D data set. Water suppression was achieved using low-power presaturation and/or the WATERGATE method. 17 Data were acquired on a Bruker Avance III HD console (Bruker BioSpin, Faellanden, Switzerland) under Topspin 3.5. All NMR samples contained 0.1 mM trimethyl-silyl propionic acid (TSP) for chemical shift referencing. At the same time, the TSP resonance was used as an internal intensity standard against which the signal intensity of the reporter compound was compared (see below for more details). TSP was confirmed to not interact with the target protein by ascertaining its intensity was not affected by the (low) target protein concentrations used in the NMR reporter assays, which were typically between 1 and 20 µM. Target protein was purified from E. coli grown in LB (Luria-Bertani) medium, purified by affinity and size-exclusion chromatography, and was dialyzed into the same buffer that was used for the NMR reporter assay. A typical NMR reporter assay buffer used in our lab consists of 40 mM sodium phosphate, pH 7.4, 150 mM NaCl, 1 mM Tris, 2 mM DTT, 15% D2O, and 1% DMSO-d6. The chosen reporter compound was typically at a concentration in the range between 10 and 100 µM. Inhibitor was titrated into samples containing a target–reporter complex up to its maximal solubility, doubling the inhibitor concentration between each sample. All samples in a titration series are DMSO matched and pH controlled to exclude any effect other than from the inhibitor molecule. A fresh sample was prepared for each inhibitor concentration tested. Samples were prepared by hand and transferred into SampleJet tubes using the SamplePro Tube robot from Bruker.
NMR Data Processing
Pseudo-2D data sets were split and processed using nmrPipe. 18 S/N and Z′ values for the NMR reporter assays were calculated as reported previously. 19 For each sample, the intensities of the reporter and the reference signals of the short and long CPMG were measured, giving Ireporter,short, Ireporter,long, Ireference,short, and Ireference,long. The long reporter intensity (Ireporter,long) is the key experimental measure of interest. The short reporter intensity (Ireporter,short) and both the short and long reference intensities (Ireference,short, Ireference,long) allow us to alleviate sources of error, such as different shim qualities between samples, by serving as normalization factors. They allow the calculation of a double ratio RR (RR = [Ireporter,long/Ireporter,short]/[Ireference,long/Ireference,short]), a single ratio Rrep (Rrep = Ireporter,long/Ireporter,short), or a single ratio Rrep,ref (Rrep,ref = Ireporter,long/Ireference,long) as additional experimental measures to the long reporter intensity I (Ireporter,long).
Simulations
Curves in
Key characteristics of NMR reporter assays. (
Results
Competition Binding Assays for Affinity Determination
We consider here a classical competitive binding equilibrium as outlined in Scheme 1. We assume that both the reporter ligand (L) and the inhibitor (I) bind to the same site on the receptor (R) and that the system is devoid of any nonspecific binding effects. We start by adding a predetermined total concentration of receptor [R0] to a reporter ligand solution of total concentration [L0]. Depending on the Kd of the R-L interaction, this will result in a certain fraction of reporter ligand being bound by the receptor. We call this initial bound fraction of reporter ligand f0. If we add an inhibitor with an affinity Ki for the receptor to this system, we can define an IC50 value as the total concentration [I0] of inhibitor that needs to be added to reduce the fraction of bound reporter ligand by half (f = f0/2). It is important to note that the IC50 is defined as a total concentration of inhibitor required to reach f = f0/2 and not the free inhibitor concentration at f = f0/2. Equation 1 relates the IC50 and Ki values via the parameters f0, [L0], and Kd. 21
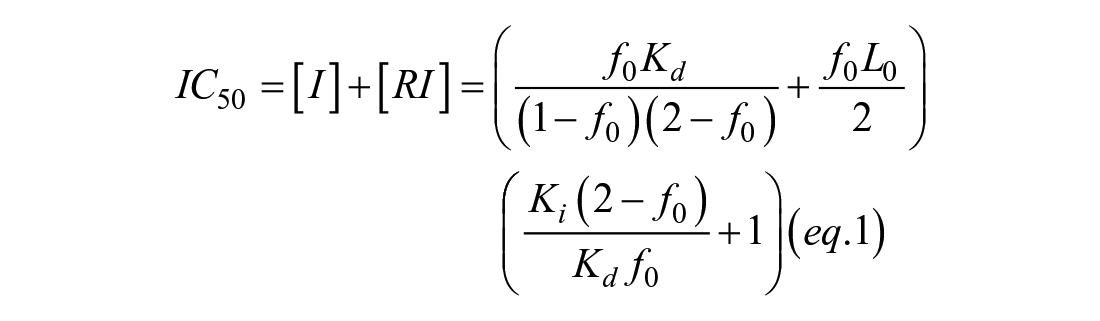
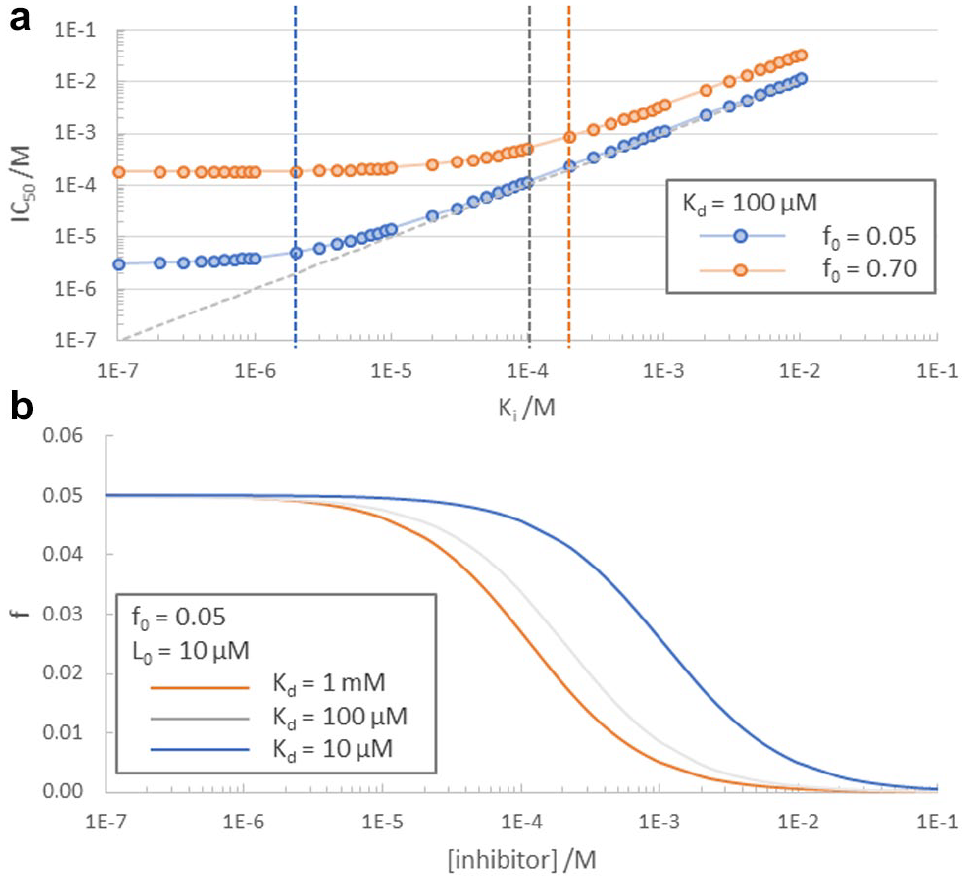
[I] and [RI] are the free inhibitor and receptor–inhibitor complex concentrations, respectively, in the above equation. It is a characteristic of LO-NMR experiments that maximal effects on the relaxation behavior of a reporter ligand can be achieved at low saturation values (typically 0.01 < f0 < 0.1). 22 FP assays, on the other hand, require significantly higher saturation levels of the reporter ligand (f0 > 0.5). 21 The value of f0 has important implications for the dynamic range of an assay, as shown in Figure 2a . Whereas the bottom (or lower limit) of an FP assay (i.e., the lowest IC50/Ki value that can be reliably determined) is typically on the order of the Kd of the interaction of the reporter ligand and the receptor, the bottom of an NMR reporter assay is at least one order of magnitude below this Kd. In both methods, the upper limit of Ki is imposed by the solubility or other physicochemical properties (aggregation, nonspecific binding, fluorescence in the case of FP assays, etc.) of the inhibitor.
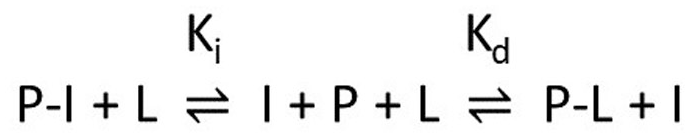
Competitive ligand binding model. The reporter ligand L and the competitive inhibitor I bind to the same site on the protein P with dissociation constants Kd and Ki, respectively.
FP assays are typically aimed at supporting a drug discovery project all the way through to candidate selection. Thus, the dynamic range of an FP assay is vital, as such an assay must be able to provide reliable results down to single-digit nanomolar affinities. For weak-affinity ligands, the required high inhibitor concentrations for FP assays can often cause fluorescence interference. A biophysical assay such as an NMR reporter assay, which suffers much less from compound interference, is ideally suited to bridge an affinity determination gap until an FP assay is reliably on scale, which is typically when inhibitor affinity values are in the 1–10 µM range. As such, the largest possible dynamic range is not the primary goal of an NMR reporter assay. Rather, the ability to measure weak affinities reliably is key. Therefore, a weak reporter ligand is preferred when setting up such an assay. As illustrated in Figure 2b , a weak reporter ligand can be more easily displaced by an inhibitor. In addition, the weaker a reporter ligand is, the higher the concentration can be used for good S/N, and yet results will not be significantly affected by small inconsistencies in reporter ligand concentration when [reporter ligand]/Kd <1. This is of particular importance if the solubility of the inhibitor or the maximally tolerable DMSO concentration is limited.
Performance Comparison of NMR Reporter Assays with Other Biophysical Assays
Over the past years, Astex has utilized NMR reporter assays in different projects using the relaxation properties of both 1H and 19F signals. We will not go further into the advantages that 19F offers as a reporter ligand nucleus. Instead, we refer the interested reader to a large body of excellent literature on this subject.23–25 We would like to stress that 1H nuclei—in particular methyl groups—can also be attractive reporter signals.
The differing formats of the assays we have used over the years reflect the specific requirements of each project. For one project, we developed a saturation transfer difference (STD; where the receptor is selectively saturated and transfer of this saturation onto weakly binding ligands is observed) 26 competition experiment to monitor reporter ligand displacement while running a waterLOGSY (water ligand observed via gradient spectroscopy; where transfer of magnetization from the hydration shell of the receptor onto weakly binding ligands is observed) 27 experiment of the inhibitor in parallel to assess its solubility and detect the formation of soluble aggregates. Data from concentrations where the inhibitor started to show signs of aggregation were discarded. This resulted in relatively long measurement times and therefore limited throughput. In the majority of cases where throughput is of prime concern, we prefer to use CPMG (where an increase in apparent transverse relaxation rate for weakly binding ligands is observed) type experiments28,29 due to their fast acquisition times, resulting in assays with high throughput. CPMG-based NMR reporter assays can deliver 20–30 Ki values per 24 h of spectrometer time on a 500 MHz spectrometer with a cryogenically cooled probe head. Such a throughput is well suited for hit validation and hit-to-lead campaigns in the pharmaceutical industry.
Cross-validation of our historic NMR reporter assay data with other biophysical methods (mainly isothermal titration calorimetry [ITC]- and 2D-NMR-derived affinities) shows a good correlation between the obtained affinity data as highlighted by Figure 3a . It is worth noting some peculiarities of NMR reporter assays that can lead to discrepancies with other biophysical methods for affinity determination. First, NMR reporter assays are commonly performed at low temperature, typically 5 °C. Such conditions often lead to an increased binding response in LO-NMR experiments. For enthalpically driven ligand binding, this leads to a systematic overestimation of affinities, compared with room temperature assays. 30 This is evident for data from the yellow data series (an epigenetic reader module) in Figure 3a . These ligands have strongly negative binding enthalpy, which is correlated with the observed difference between the Ki measured by NMR reporter assay and the Kd measured directly by ITC or 2D-NMR (data not shown). We have observed up to threefold differences for projects with highly enthalpically favorable binding modes (ΔHbind ≤ –10 kcal/mol). If desired, measuring Ki values at two different (low) temperatures allows us to extrapolate to the true value at physiological temperature via the Van’t Hoff equation. Second, as for all competition-based formats, NMR reporter assays have a lower limit of detection, which depends on the affinity of the reporter ligand for the target (see above). For the same data series, it is evident that the NMR reporter assay reached its lower limit at about 10 µM Ki.
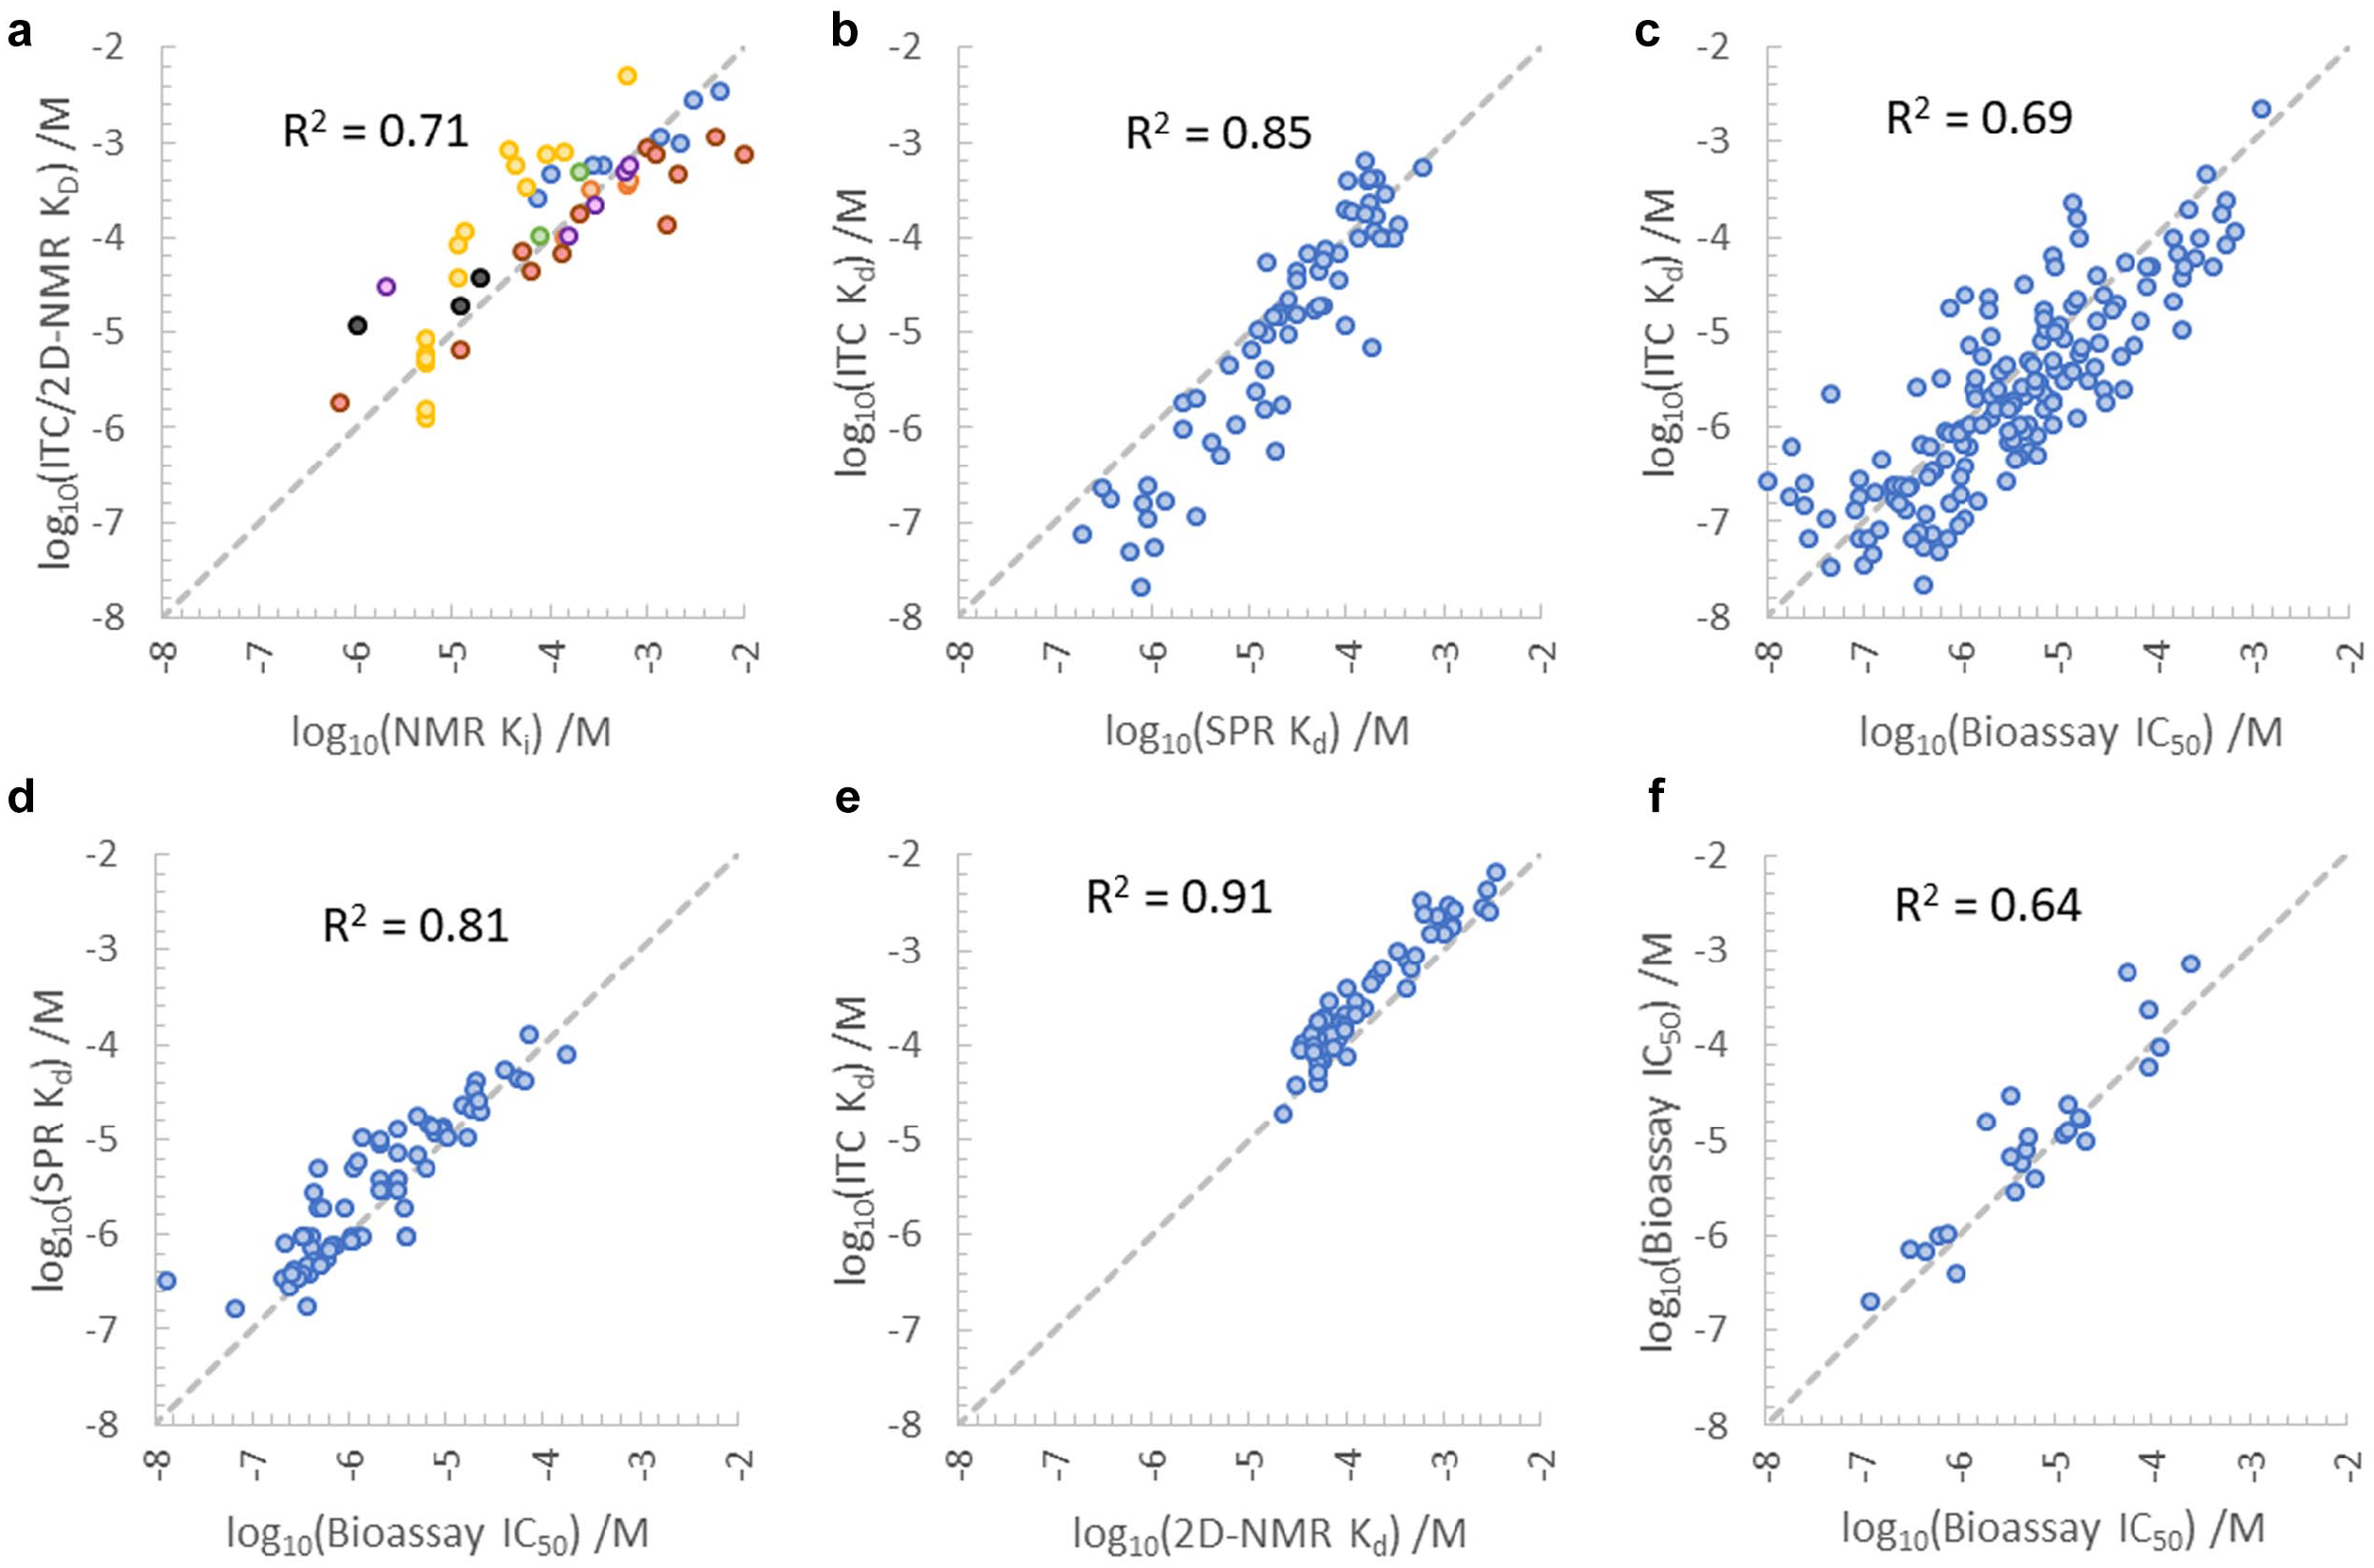
Correlations between different biophysical and biochemical affinity assays. The term “bioassay” refers here to fluorescence-based competition assays (FP or FRET). (
Practical Aspects of Setting Up and Running NMR Reporter Assays
The choice of LO-NMR assay conditions is dictated by several factors. First, the reporter ligand should give rise to a clear NMR relaxation effect (waterLOGSY, STD, or CPMG) at a concentration around, or below, its Kd. If the concentration of reporter ligand required is much greater than Kd, higher concentrations of the inhibitor will be required to displace the reporter ligand and may exceed the solubility limit of the inhibitor. Second, the reporter ligand concentration should be sufficiently high that the NMR binding signal can be observed within a reasonably short time. Third, a reporter ligand must be in “fast exchange” with the target for LO-NMR experiments to perform optimally. This is typically the case for ligands with Kd values >1 µM. Finally, and importantly, the reporter ligand should be bound exclusively to the site of interest. If it is not, then complete displacement cannot be achieved by an inhibitor competing at the site of interest, leading to underestimation of the potency of a competitive inhibitor. In addition, competition effects may be generated from competitive binding at secondary sites. The selectivity of the reporter ligand can be established by observing its complete displacement when titrated by a more potent and selective ligand, preferably a well-characterized biological ligand or drug. If this is not possible, selectivity over secondary sites is more likely to be achieved by a more potent, smaller ligand (i.e., one with higher ligand efficiency), and so potential reporter ligands should be selected on that basis. The discussions in the following paragraphs assume that the reporter binds specifically to the site of interest. Only in this case will the assumptions made for the data analysis hold true. 20 Mathematical models have been developed that allow dealing with nonspecific binding in competition assays 31 and can be applied if necessary but will not be discussed in further detail here.
Any ligand with an observable NMR signal can serve as a reporter. Ligands with fluorines or methyl groups make for particularly interesting reporters due to their high sensitivity of detection. The selected potential reporter ligands should undergo Kd measurement against the site of interest, preferentially by 2D-NMR or ITC, and the one with the most suitable affinity selected. Once a reporter ligand has been selected, it is titrated with the target protein until the reporter ligand signal is completely quenched in the case of a CPMG experiment or maximal in the case of STD or waterLOGSY experiments. The total concentration of the reporter ligand is chosen such that a desired S/N can be achieved within a reasonable experimental time. We often choose 20 µM for CH3 and CF3 signals and 50–100 µM for aromatic H and F signals. A sufficient binding response signal from the reporter ligand can usually be achieved at a 0.01–0.1 fraction of bound reporter ligand. In detail, this depends on the Kd and the binding kinetics and other NMR-specific parameters. A titration of the reporter ligand with target protein allows the determination of the reporter signal intensity as a function of the fraction of bound reporter ligand. The relationship between these two values can then be cast in a suitable mathematical expression (e.g., an exponential function). The addition of an inhibitor will displace some of the reporter ligand from the target, and the observed change in the reporter ligand’s signal can be used to calculate the Ki of the inhibitor.20,31 Depending on the application, one or several inhibitor concentrations can be tested to determine a Ki value.14,23 The use of several inhibitor concentrations is encouraged to reduce the influence of experimental error on the determined Ki.
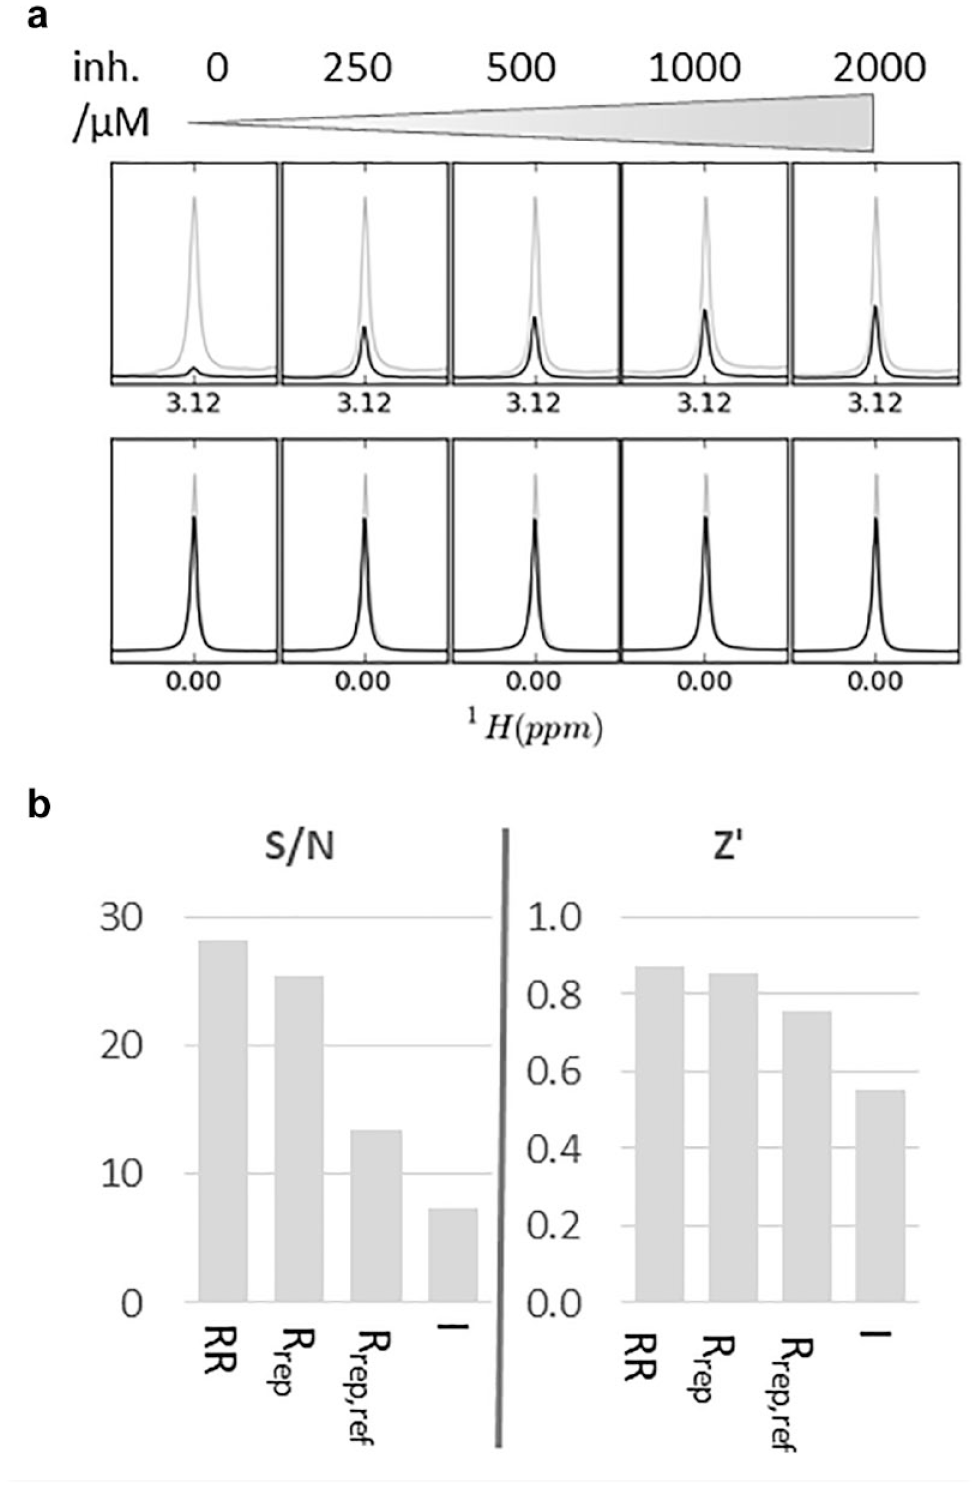
We have found that much more reliable data can be achieved if the signal of the reporter ligand is referenced to that of a nonbinding, internal reference molecule. If desired or necessary, an additional correction can be carried out by normalizing the LO-NMR signal of both the reporter and the nonbinding reference molecule against a reference spectrum (e.g., in the case of the CPMG experiment against a reference CPMG spectrum acquired with a short CPMG duration or in the case of a waterLOGSY or STD against a conventional 1D-NMR spectrum). This is illustrated in Figure 4a , where a N-methyl signal at 3.12 ppm served as the reporter signal in a 1H-CPMG NMR competition assay and TSP at 0 ppm served as a nonbinding reference. This internal referencing procedure can very efficiently reduce experimental errors from small inconsistencies between individual NMR samples. For example, small differences in the magnetic field homogeneity would otherwise translate to different peak intensity values for two identical samples. Competition assays are typically benchmarked in terms of their S/N and Z′ values, which inform about the sensitivity and reproducibility of the assay, respectively. 19 Figure 4b shows that both the S/N and Z′ parameters of an NMR reporter assay improve when using an internal control signal for standardization of the measured reporter intensities. In fact, the Z′ value can be pushed into the realm typical for excellent competition assays. 23 The capability for internal referencing is a special feature of the NMR reporter method and makes a notable contribution to its robustness and reliability.
(
During progression through iterative medicinal chemistry design and synthesis cycles, the inhibitor affinity will approach the range where another assay that is more amenable to be operated in a high-throughput manner (e.g., biochemical assay, fluorescence resonance energy transfer [FRET] assay, FP competition assay) can take over affinity determination reliably (Ki ≈ 1–10 µM). We recommend running the NMR reporter assay and novel assay in parallel for a while in that “handover” region. This will serve to build trust in the reliability of the newly deployed assay. At the same time, the NMR reporter assay will still be available to determine accurately the affinities for weaker inhibitors. Such inhibitors will manifest undoubtably while a project is in the handover region, where invalid design hypotheses will result in the synthesis of inhibitors that will again become off scale in the new assay.
Discussion
NMR reporter assays fill an interesting niche in the throughput versus affinity landscape of biophysical and biochemical assays that is particularly important for FBDD. Together with a suitable biological and/or biochemical assay, the full affinity range of an FBDD project can be covered. NMR reporter assays are conceptually similar to FP assays in that both are competition assays where the displacement of a reporter molecule from the target of interest is monitored. There are some key differences between the two, though. The main difference is the fact that NMR reporter assays are performed with a very low level of bound reporter ligand. This results in a much lower bottom of the assay than the traditional 2*Kd value limit that applies to FP assays. Practically, this means that with a 100 µM affinity reporter ligand, inhibitor affinities down to the single-digit micromolar range can be measured reliably. This is an affinity range that is often not accessible to the more traditional PO-NMR assays. As such, NMR reporter assays also offer a significant extension of the applicability of NMR for affinity determination. NMR reporter assays rely on differences in relaxation behavior of the free reporter versus the bound reporter. Such differences are larger for more viscous solutions and slower tumbling times of the target protein, which is the reason NMR reporter assays are commonly carried out at low temperatures. For ligands with an enthalpically driven binding mode, this will mean that the binding affinity Ki of an inhibitor will be overestimated compared with the value at room or physiological temperature. This is a noteworthy consideration for FBDD, where fragment binding is typically driven by enthalpy changes. 32
NMR reporter assays require some up-front investment to set up. Usually several candidates need to be evaluated for their suitability of being a reporter molecule. In our opinion, such efforts are warranted when it is anticipated that more than 20–30 affinities will have to be determined in the future. Below that threshold, we find that it is usually more economical to rely on ITC or 2D-NMR for affinity determination. Once an NMR reporter assay is set up, it can deliver affinities as reliably as other commonly used biophysical and biochemical affinity determination methods. This is evident from correlations that individual assays show with each other, but also by independent assay quality parameters such as the Z′ factor.
NMR reporter assays are more economical in terms of protein consumption than 2D-NMR or ITC. Smaller tubes than the standard 5 mm ones are becoming routinely supported by NMR hardware vendors. We find that 3 mm tubes offer a good compromise between reagent savings and more difficult handling in automation settings. In such tubes, 0.1–1 mg of protein is sufficient for the determination of one inhibitor affinity. The former value is typical for a highly sensitive assay with a reporter ligand having a Kd <1 mM for the target protein, whereas the latter value can be required for less sensitive assays probing very weak interactions with a reporter ligand Kd >1 mM.
Twenty to thirty inhibitor affinities can be probed in 1 day with an assay that is well set up. When maximal throughput is of the essence, several options are available. Experimental time can be cut down by omitting the referencing against a normal 1D spectrum or short CPMG experiment. This will essentially halve the experimental time. Figure 4b shows that this may be acceptable, if decreased sensitivity and robustness of the resulting assay are deemed still acceptable. Reducing the number of inhibitor concentrations is another way of increasing throughput, albeit at the cost of a reduced precision of the assay. However, it is in principle possible to get reliable affinity data from just one single inhibitor concentration.14,33 We find that most often a series of four samples containing increasing inhibitor concentrations and an additional reference sample in the absence of inhibitor provide data of good quality. Even though such assays will benefit from the availability of robotics for generating dilution series and transfer of samples into NMR tubes, these assays can also be set up by hand. The only robotic support that we feel is absolutely required is a sample changer feeding the prepared NMR samples into the magnet.
Finally, we would like to stress the fact that because NMR reporter assays monitor one single NMR signal, they lend themselves ideally to automated analysis. An ideal reporter signal is one that shows a low propensity for overlap with signals from the inhibitors. In that respect, fluorine signals are of particular interest due to the large chemical shift anisotropy of the 19F nucleus. In the absence of any such overlap, the reporter signal can be easily picked automatically, and its integral value converted to a fraction of bound reporter ligand. From this, the Ki value of the inhibitor can be fitted in turn. We run automated analysis of NMR reporter assay data routinely. Results are evaluated by eye, and only data sets with poor fits (e.g., due to overlap) are reevaluated by hand. Such automated analysis reduces the time for analysis and reporting of the assay results considerably.
Conclusion
NMR has proven to be a versatile method for the determination of weak ligand affinities. While for small numbers of ligands PO-NMR (often 2D) is usually the most efficient method, LO methods are worth investigating when higher throughput is required. LO-NMR methods independent of a reporter molecule are available and can offer interesting alternatives.34,35 However, these methods require more specialist intervention for setting up and data analysis. NMR reporter assays require some effort to establish but offer a cheap and fast route to ligand affinity determination once an assay is set up. The method does not rely on any specialized NMR hardware and is easy to set up and analyze even for nonexpert users. As such, we believe the method to be of use to many small-molecule drug discovery laboratories in industry and academia.
Footnotes
Acknowledgements
We would like to acknowledge the invaluable contributions of Glyn Williams and Hiroki Ogasa in setting up several of the NMR reporter assays described in this manuscript. We would like to thank Dominic Tisi, Anthony Dossang, Juan Castro, and Joe Coyle for helpful comments while preparing this manuscript. Finally, we would like to thank all Astex employees, present and past, who have contributed to collecting the assay data presented in this manuscript.
Declaration of Conflicting Interests
The authors declared the following potential conflicts of interest with respect to the research, authorship, and/or publication of this article: All authors are employed by Astex Pharmaceuticals, and their research and authorship of this article were completed within the scope of their employment with Astex Pharmaceuticals.
Funding
The authors received no financial support for the research, authorship, and/or publication of this article.