
Abstract
In this article, we demonstrate and validate a new bioassay named the NTAB [NGF–TrkA (nerve growth factor–tropomyosin receptor kinase A) antagonist bioassay] for the determination of the inhibitory potency of NGF–TrkA antagonists, based on the inhibition of NGF-dependent proliferation of the human TF1 erythroleukemic cell line.
It is well known that NGF holds great therapeutic potential due to its neurotrophic and neuroprotective properties. NGF is also involved in some pathways, however, principally driven by TrkA that, if not correctly regulated, can lead to unwanted pathological outcomes linked to pain, angiogenesis, and cancer.
Indeed, there is an increasing interest, from a therapeutic perspective, in designing new effective molecules (antibodies, antibody fragments, or small molecules) able to inhibit the undesired NGF–TrkA pathway. For these reasons, there is an interest to develop functional cell-based assays for determination of the inhibition potency of compounds inhibiting the NGF–TrkA axis. The NTAB presents significant advantages over other published NGF–TrkA functional bioassays, for these reasons: (1) It is quantitative, (2) it measures a pure TrkA response, (3) it is simpler, (4) it is based on a natural biological response, and (5) it is easily scalable from a lab scale to an automated industrial assay.
The NTAB assay was validated with a panel of well-characterized NGF–TrkA inhibitors, yielding characteristic dose–response curves, from which the relative strength of the inhibitors was quantitatively determined and used for comparisons. This new bioassay will be very useful to assist in the validation and prioritization of the best inhibitors among a large number of candidates.
Introduction
Nerve growth factor (NGF), the prototype of the neurotrophins protein family, is involved in the survival and growth of sensory neurons and in the maintenance of neurons in the central nervous system. 1 In addition to its neuronal targets, NGF has been shown to also act on astrocytes and microglia, on cells of the immune system, and on keratinocytes, blood vessels, endothelial cells, and many other non-neuronal targets.1–2 It exerts its action through the receptors TrkA (tropomyosin receptor kinase A, in the tyrosine kinase superfamily) and p75NTR (p75 neurotrophin receptor, in the tumor necrosis factor receptors superfamily). 3 NGF holds great therapeutic potential due to its neurotrophic and neuroprotective properties. NGF is also involved in some pathways, however, that are principally driven by TrkA and that, if not correctly regulated, can lead to unwanted pathological outcomes linked to pain, angiogenesis, and cancer.
NGF is a potent sensitizer of the sensory pathways that generate pain. 4 Pain sensitization by NGF involves NGF–TrkA interactions on nociceptive sensory neurons. 5 Inhibition of the NGF–TrkA interaction has grown, therefore, as an emerging strategy for the control of inflammatory and chronic pain, as an alternative to the use of nonsteroidal anti-inflammatories or opioids. 6 Another therapeutic area in which inhibition of NGF–TrkA interactions might be beneficial is cancer, since NGF has been shown to regulate, via interactions with TrkA, both angiogenesis and growth and progression of some tumors, including medullar thyroid, 7 lung, 8 pancreatic, 9 prostatic, 10 and breast carcinomas. 11 For this reason, an interest in developing inhibitors of the NGF–TrkA signaling axis has emerged for therapeutic areas of unmet medical need, such as chronic pain or oncology. The front line of this new class of candidate drugs is represented by anti-NGF antibodies. 6 Anti-NGF antibodies–based analgesics are not without problems, 12 however, and alternative strategies to interfere with this pathway are being pursued actively. Among these, neutralizing anti-TrkA antibodies is the alternative choice,13,14 but also small molecules modulating the NGF–TrkA interaction are being investigated. 15
In this article, we demonstrate and validate a new bioassay for the determination of the inhibitory potency of NGF–TrkA antagonists, based on the NGF-dependent proliferation of the human TF1 erythroleukemic cell line. 16 This NGF–TrkA antagonist bioassay (NTAB) presents significant advantages over other published NGF–TrkA functional bioassays, for at least one of these reasons: (1) It is quantitative, (2) it measures a pure TrkA response, (3) it is simpler, (4) it is based on a natural biological response, and (5) it is easily scalable from a lab scale to an automated industrial assay.
Materials and Methods
TF1 Cell Assay
The original protocol of the bioassay by Chevalier et al. 16 has been optimized. 17 TF1 cells were cultured for 1 week in Roswell Park Memorial Institute 1640 medium (RPMI-1640) containing 10% fetal bovine serum (FBS) with 2 ng/ml recombinant human granulocyte–macrophage colony-stimulating factor (rhGM-CSF; R&D Systems, Abingdon, UK). Cells were washed, resuspended in RPMI-1640 and FBS to a concentration of 300,000 cells/ml, and replated on 96-well microplates (15,000 cells/well) without rhGM-CSF.
After 60 min, increasing concentrations of human nerve growth factor (hNGF; 7.6, 3.8, 1.6, 0.8, 0.4, 0.17, 0.13, 0.09, 0.017, and 0.009 nM; NGF molecular weight: 26.9 kDa) with or without a fixed concentration of inhibitor ( Suppl. Table S1 ) were added. Control wells were included, either containing medium alone or containing TF1 cells in the absence of NGF. Each treatment was performed in duplicate. After 40 h of incubation at 37 °C, 5% CO2, the medium was changed. 20 µl of CellTiter 96 Aqueous One Step Solution (Promega, Milan, Italy) was pipetted into each well. The plate was incubated for 1–3 h at 37 °C, 5% CO2. The absorbance at 490 nm was recorded using an ELISA Reader (Bio-Rad, Basel, Switzerland) after 1, 2, and 3 h.
We evaluated the effect on NGF curves:
1. By blocking NGF using:
a. Anti-NGF antibodies (MAb256, R&D Systems; αD11, tested as whole antibody and as antibody fragments FAb and FAb2; 18 and 4GA 19 on NGF painless20–22)
b. p75NTR BP 23 (a gift of Levicept)
2. By blocking TrkA using anti-TrkA (MNAC1314) ( Suppl. Table S2 )
Negative controls included dose–response curves in the presence of unrelated antibodies: (1) anti-proNGF (cat. no. PAb ANT005, Alomone, Jerusalem, Israel), (2) in-house monoclonal antibody (MAb) anti-tau, or (3) anti-NGF 4GA challenged with hNGF WT (wild type).
Moreover, we also tested the effect of the same antibodies used as inhibitors (MNAC13, αD11, MAb256, and 4GA) on TF1 without NGF to exclude an effect of the antibodies on the cells.
MAb, FAb, FAb2, or p75NTR BP concentrations are reported in Supplemental Table S2 . We used equimolar concentrations for each inhibitor, with the exception of FAb. Due to the fact that FAb2 and MAb contain two antigen-binding sites, a twofold equimolar amount of FAb was used. The antibodies assayed as negative controls were tested at only three concentrations (500, 62.5, and 7.8 ng/ml).
All the assays were repeated twice in independent experiments.
As an additional control, we also tested the potential toxicity of two representative antibodies (the anti-TrkA MAb MNAC13 and the anti-NGF MAb αD11) on two unrelated cell lines (HeLa and CHO) and on TF1 cultured with rhGM-CSF, in the absence of NGF. CHO and HeLa cells were treated with MNAC13 or αD11 (500 ng/ml). TF1 cells were plated with GM-CSF with or without MNAC13 or αD11 at 500 ng/ml. Cells were counted 48 and 72 h after the treatment. No toxicity was observed with the two antibodies in all the conditions tested (data not shown).
PC12 Cell Assay
We have compared the inhibitory effect of MAb αD11, MAb MNAC13, MAb256 (R&D Systems), and p75NTR BP on the NTAB and on the PC12 neurite outgrowth assay. 24 PC12 cells were cultured for 24 h in a T175 flask with 10 ml of RPMI-1640 containing 10% horse serum (HS), 5% FBS, plus 50 ng/ml of recombinant human NGF, produced by our group. 17 Cells were then washed, resuspended in the same medium to a concentration of 25,000 cells/ml, and replated on a poli-lysinated six-well plate (2 ml cells/well). Human recombinant NGF at the concentration of 10 ng/ml was added to the medium, with or without the inhibitors [MAb anti-NGF αD11, MAb anti-TrkA MNAC13, MAb256, and p75NTR BP] at two concentrations (3.3 nM or 0.41 nM), representing the maximum and an intermediate concentration used for the NTAB assay. Also, a negative control was carried out by plating cells in medium without any additive. The cells were cultured for 5 d, changing medium and additives (NGF + inhibitor) every 48 h. After 2 d and 5 d, cells were counted at the optic microscope. For each treatment, the numbers of cells, of the cells exhibiting one neurite, and of the cells with more than one neurite were counted in four different fields. The percentage of cells exhibiting one or more neurites was calculated.
Data Analysis
Each assay generated a dose–response curve, which was interpolated according to the following formula:

where H is the optical density (OD) at 490 nm, Hmax represents the maximum OD reached when the curve is at saturation, CNGF is the concentration of NGF in ng/ml, and C50 represents the concentration of NGF determining half of the maximum effect on cell proliferation (1/2 Hmax).
To evaluate the strength of inhibition for each inhibitor, C50 values in the function of inhibitor concentrations were reported. For each inhibitor concentration, C50 values of NGF curves in the presence of inhibitors were subtracted from the C50 of the NGF curve in the absence of inhibitors. The points were interpolated by linear regression analysis, with the constraint of passing from 0, and the slope was calculated.
To compare the slope value derived from the curves with a pharmacological parameter, the IC50 (half-maximal inhibitory concentration) value also was calculated. The OD at 490 nm, corresponding to the NGF concentration of 200 ng/ml, for each concentration of inhibitor was used to calculate the IC50 value using GraphPad Prism (GraphPad, San Diego, CA). The resulting sigmoidal curves were interpolated by a four-parameter dose–response curve equation. The measurements carried out without inhibitor and in the absence of both NGF and inhibitor were used, respectively, as positive and negative controls.
Results
We have previously shown that the NGF-dependent proliferation assay of the human TF1 erythroleukemic cell line 16 allows comparing the potency of NGF mutants in a quantitative way and can be used to quantitatively evaluate changes in the folding and efficacy of NGF proteins as a result of different physicochemical treatments. 17 The TF1 cells express human TrkA in the absence of detectable p75NTR, 16 so the assay provides a measure of pure TrkA responses. We have now adapted the TF1 assay to assess the effects of some NGF inhibitors on the bioactivity of NGF on human receptor TrkA. The TF1 cells–based proliferation assay was carried out in the presence of different concentrations of a panel of inhibitors, targeting either the NGF ligand or the TrkA receptor. Two well-known neutralizing anti-NGF antibodies were used: αD11 and MAb256. αD1118 represents an anti-NGF blocking antibody, exhibiting a very high affinity for NGF, with a very fast-binding kinetics and very slow dissociation. 25 The commercial MAb256 was chosen because it is a widely used neutralizing anti-NGF antibody. MAb 4GA recognizes the epitope formed by the amino acid serine in position 61 of the mature mouse NGF, but it does not detect human NGF WT, which has a proline at this position. 4GA was tested in our assay both on painless NGF, which is an NGF mutant containing the P61S epitope, 17 and on NGF WT, which was used as negative control. Painless NGF is the double-mutant P61SR100E of human NGF with therapeutic potential, having similar neurotrophic properties to NGF WT, with no nociceptive activity.19–21
Since NGF, besides TrkA, also binds the low-affinity receptor p75NTR, the inhibitory effect of the soluble P75NTR BP on NGF was assessed. P75NTR BP is being developed for its prospective use in the treatment of chronic pain. P75NTR BP acts as a neurotrophin-binding protein or scavenger of neurotrophins. Another way to block the NGF effect is to act indirectly on its receptor, TrkA. MNAC13 is an anti-TrkA blocking antibody that is very selective for TrkA, and it does not recognize other Trk receptors. With this aim, MNAC1314 was tested by the NTAB. For each of these inhibitors, the NTAB was carried out, exposing the cells to increasing concentrations of NGF in the presence of fixed concentrations of inhibitor. A set of curves was collected at different concentrations of inhibitor. This generated a set of dose–response curves that were interpolated as described in the Materials and Methods section, in which the curve with higher Vmax value is represented by the curve of NGF without inhibitor. The presence of inhibitor impaired the action of NGF on cell proliferation, causing a change in the parameters of the dose–response curves (Hmax and/or C50) or, at higher inhibitor concentrations, even in the shape of the curve, which becomes more similar to a linear one (
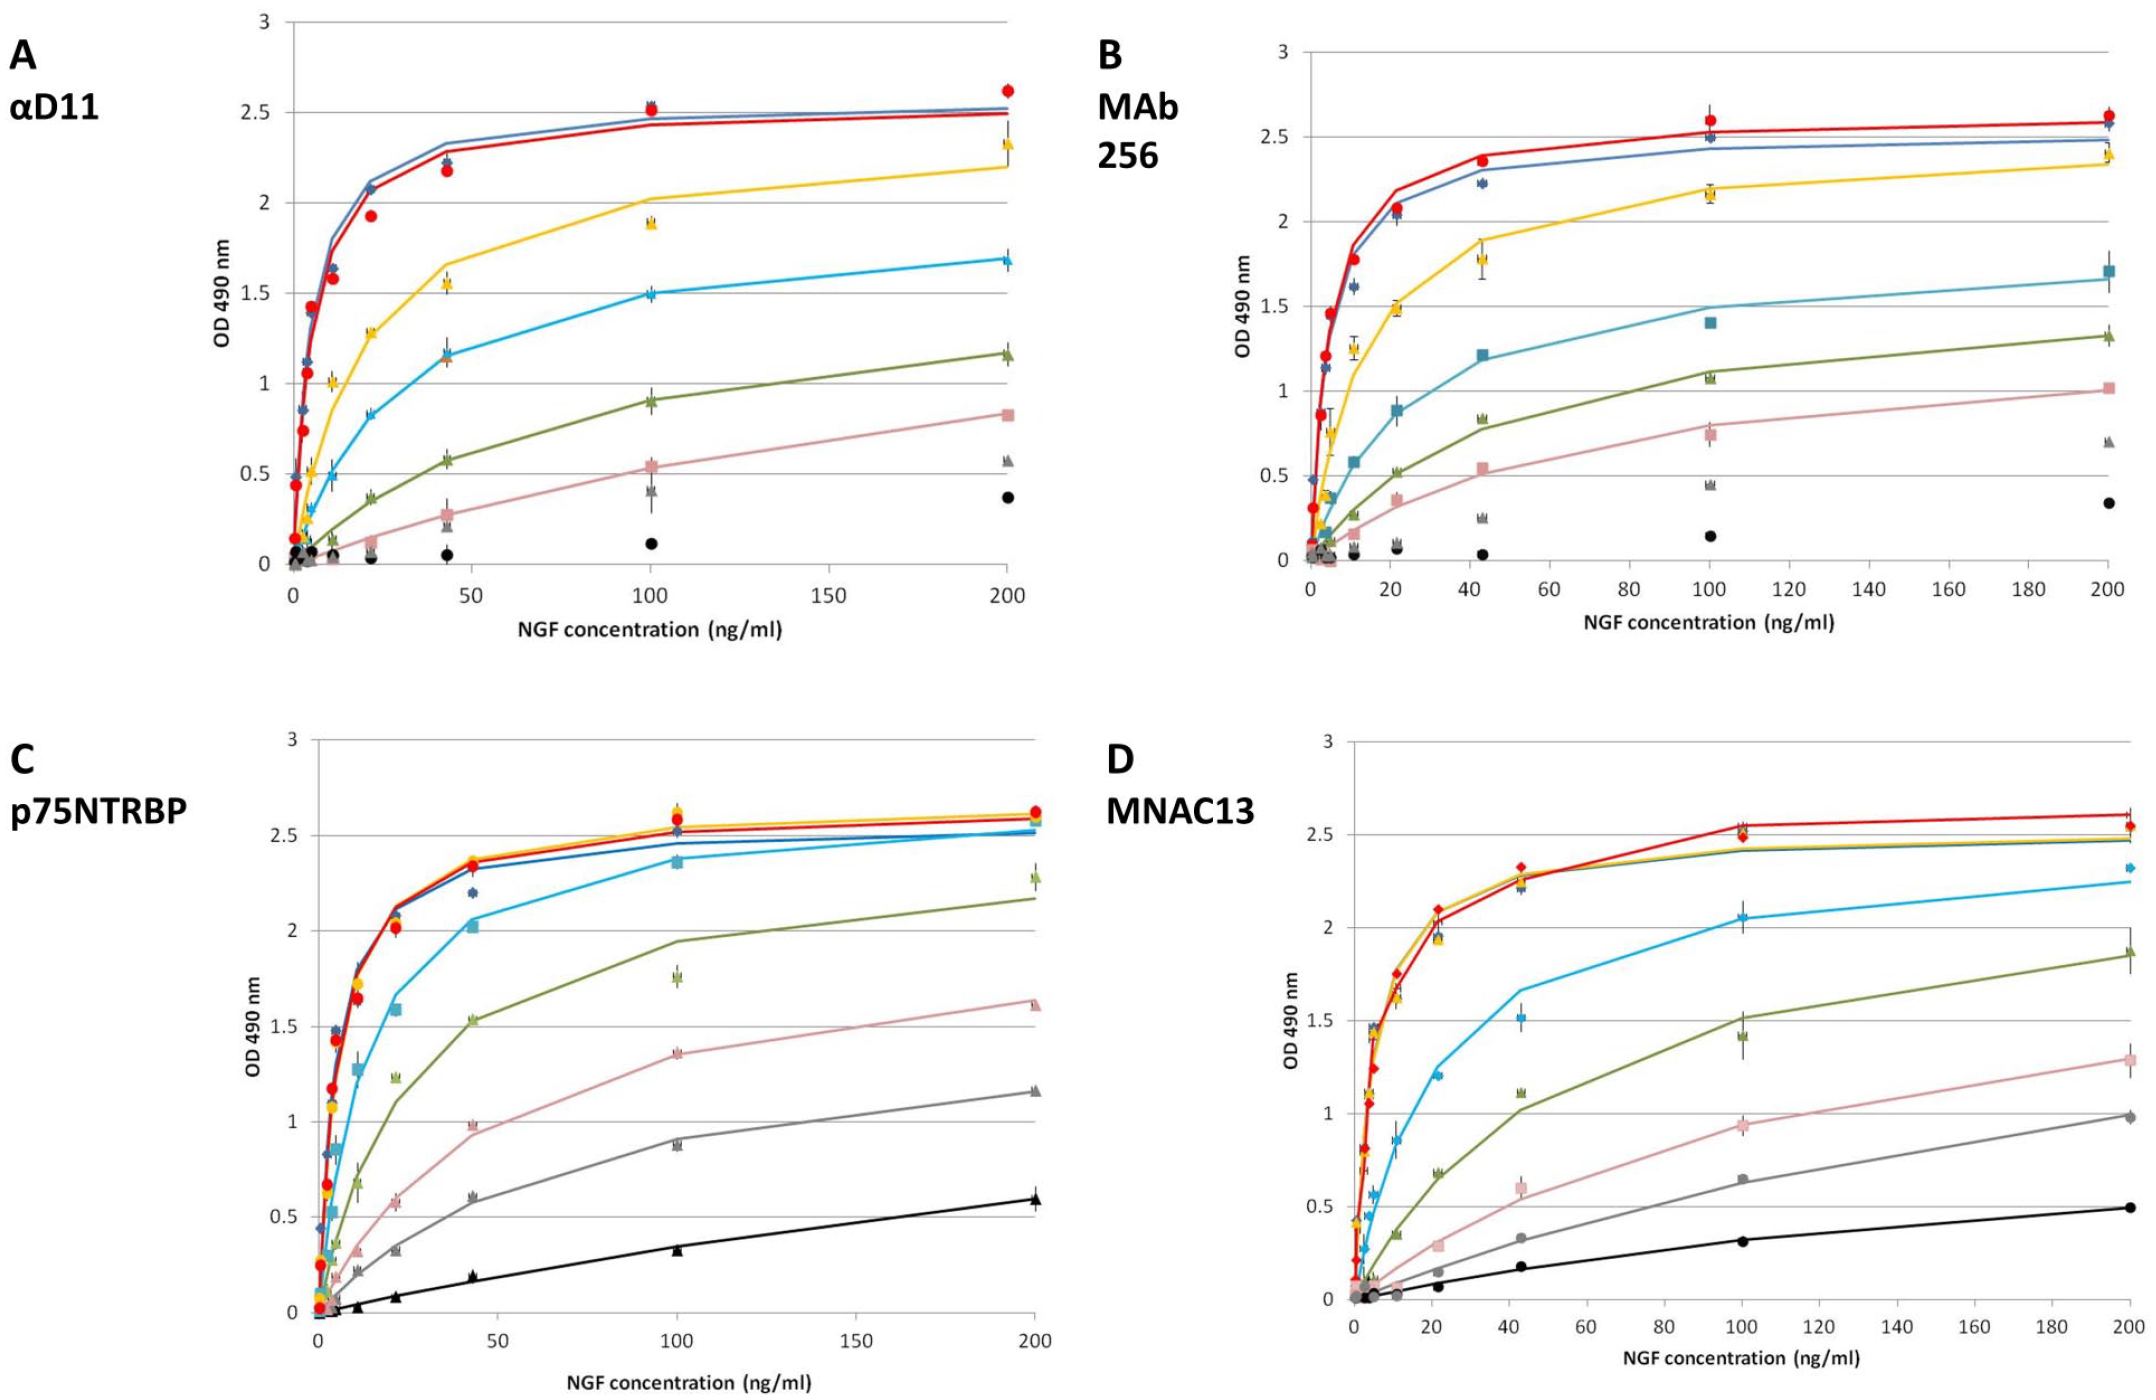
NTAB [NGF–TrkA (nerve growth factor–tropomyosin receptor kinase A) antagonist bioassay] set of curves, generated for the anti-NGF antibodies (
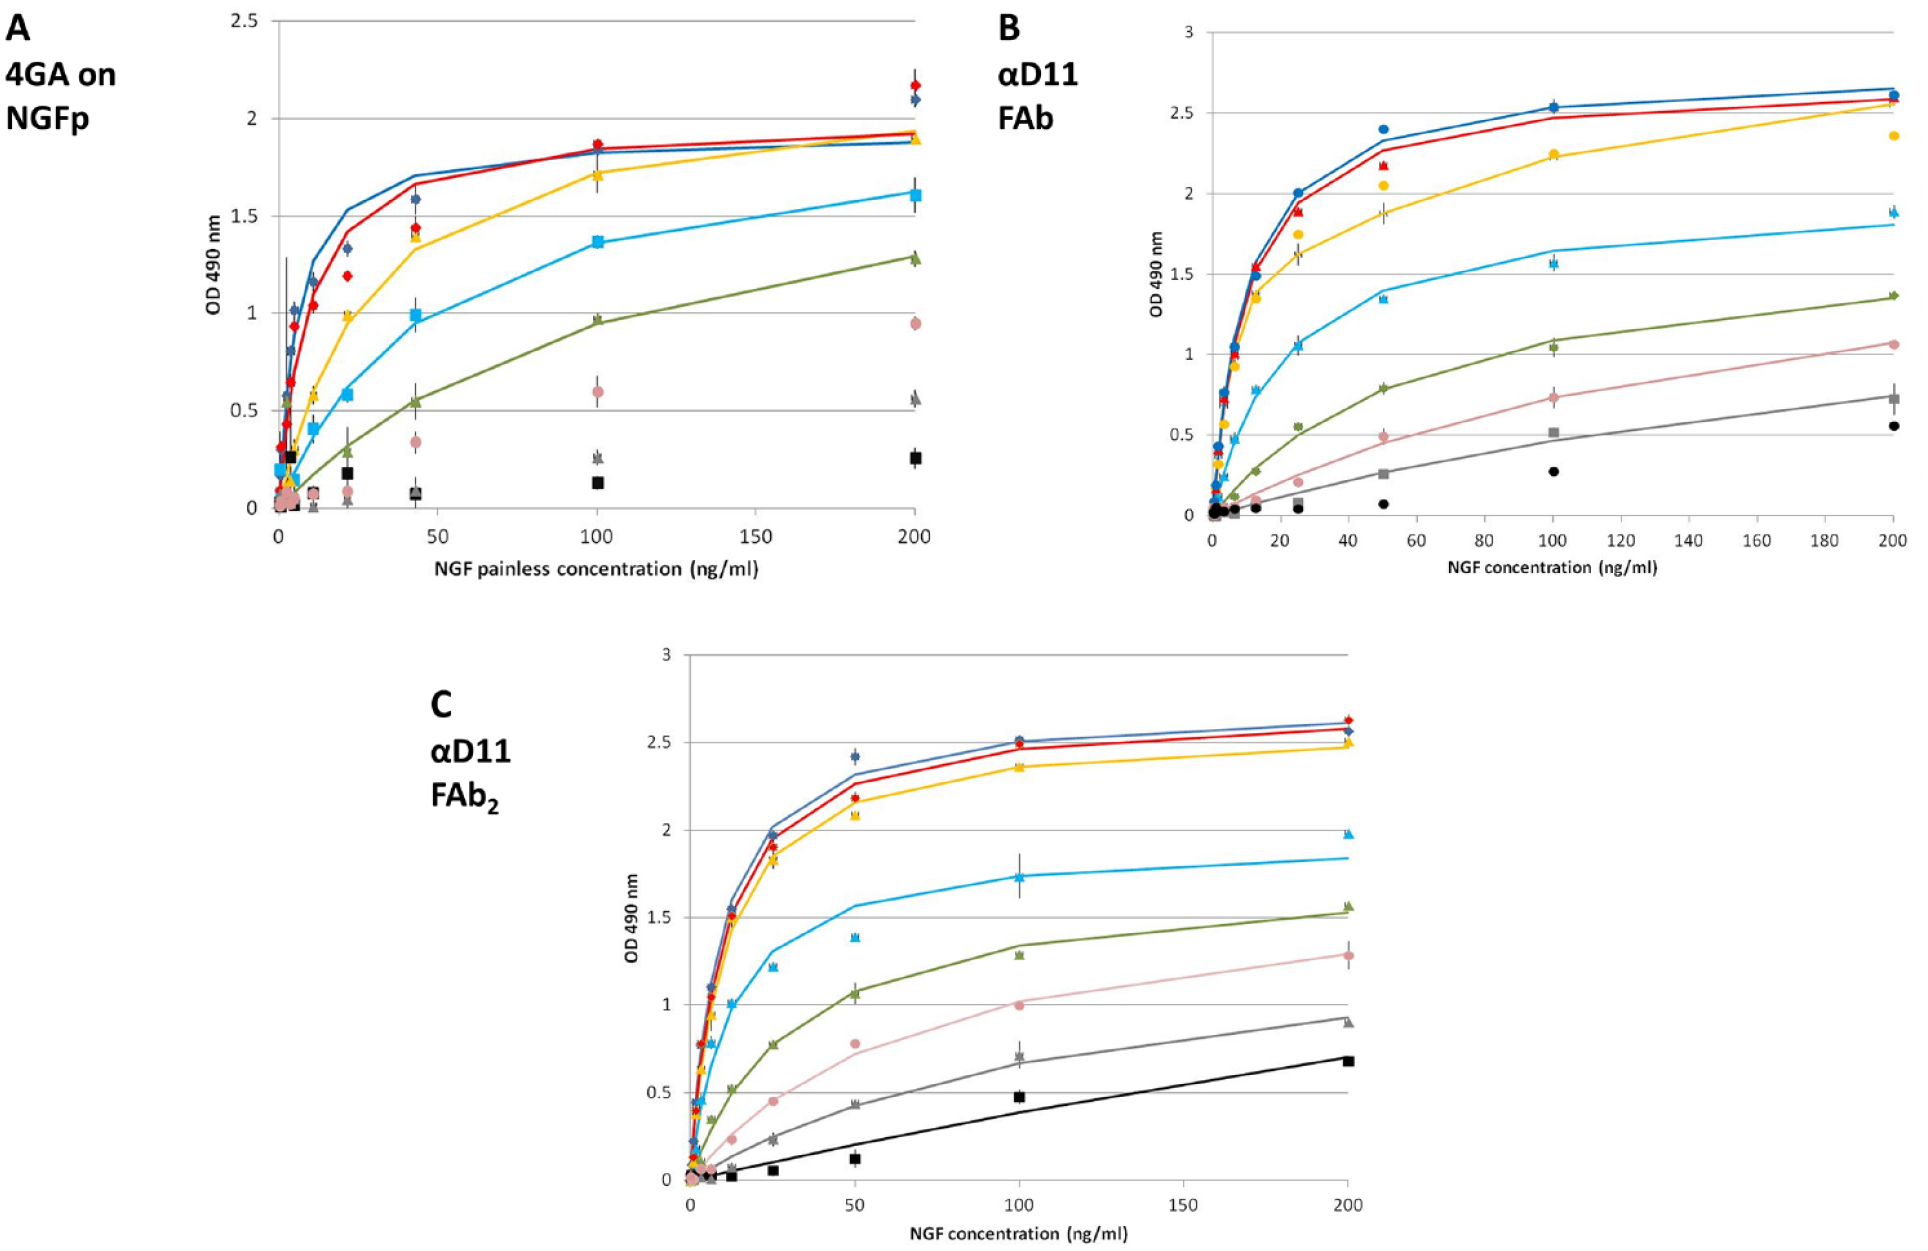
NTAB [NGF–TrkA (nerve growth factor–tropomyosin receptor kinase A) antagonist bioassay] set of curves, generated for (
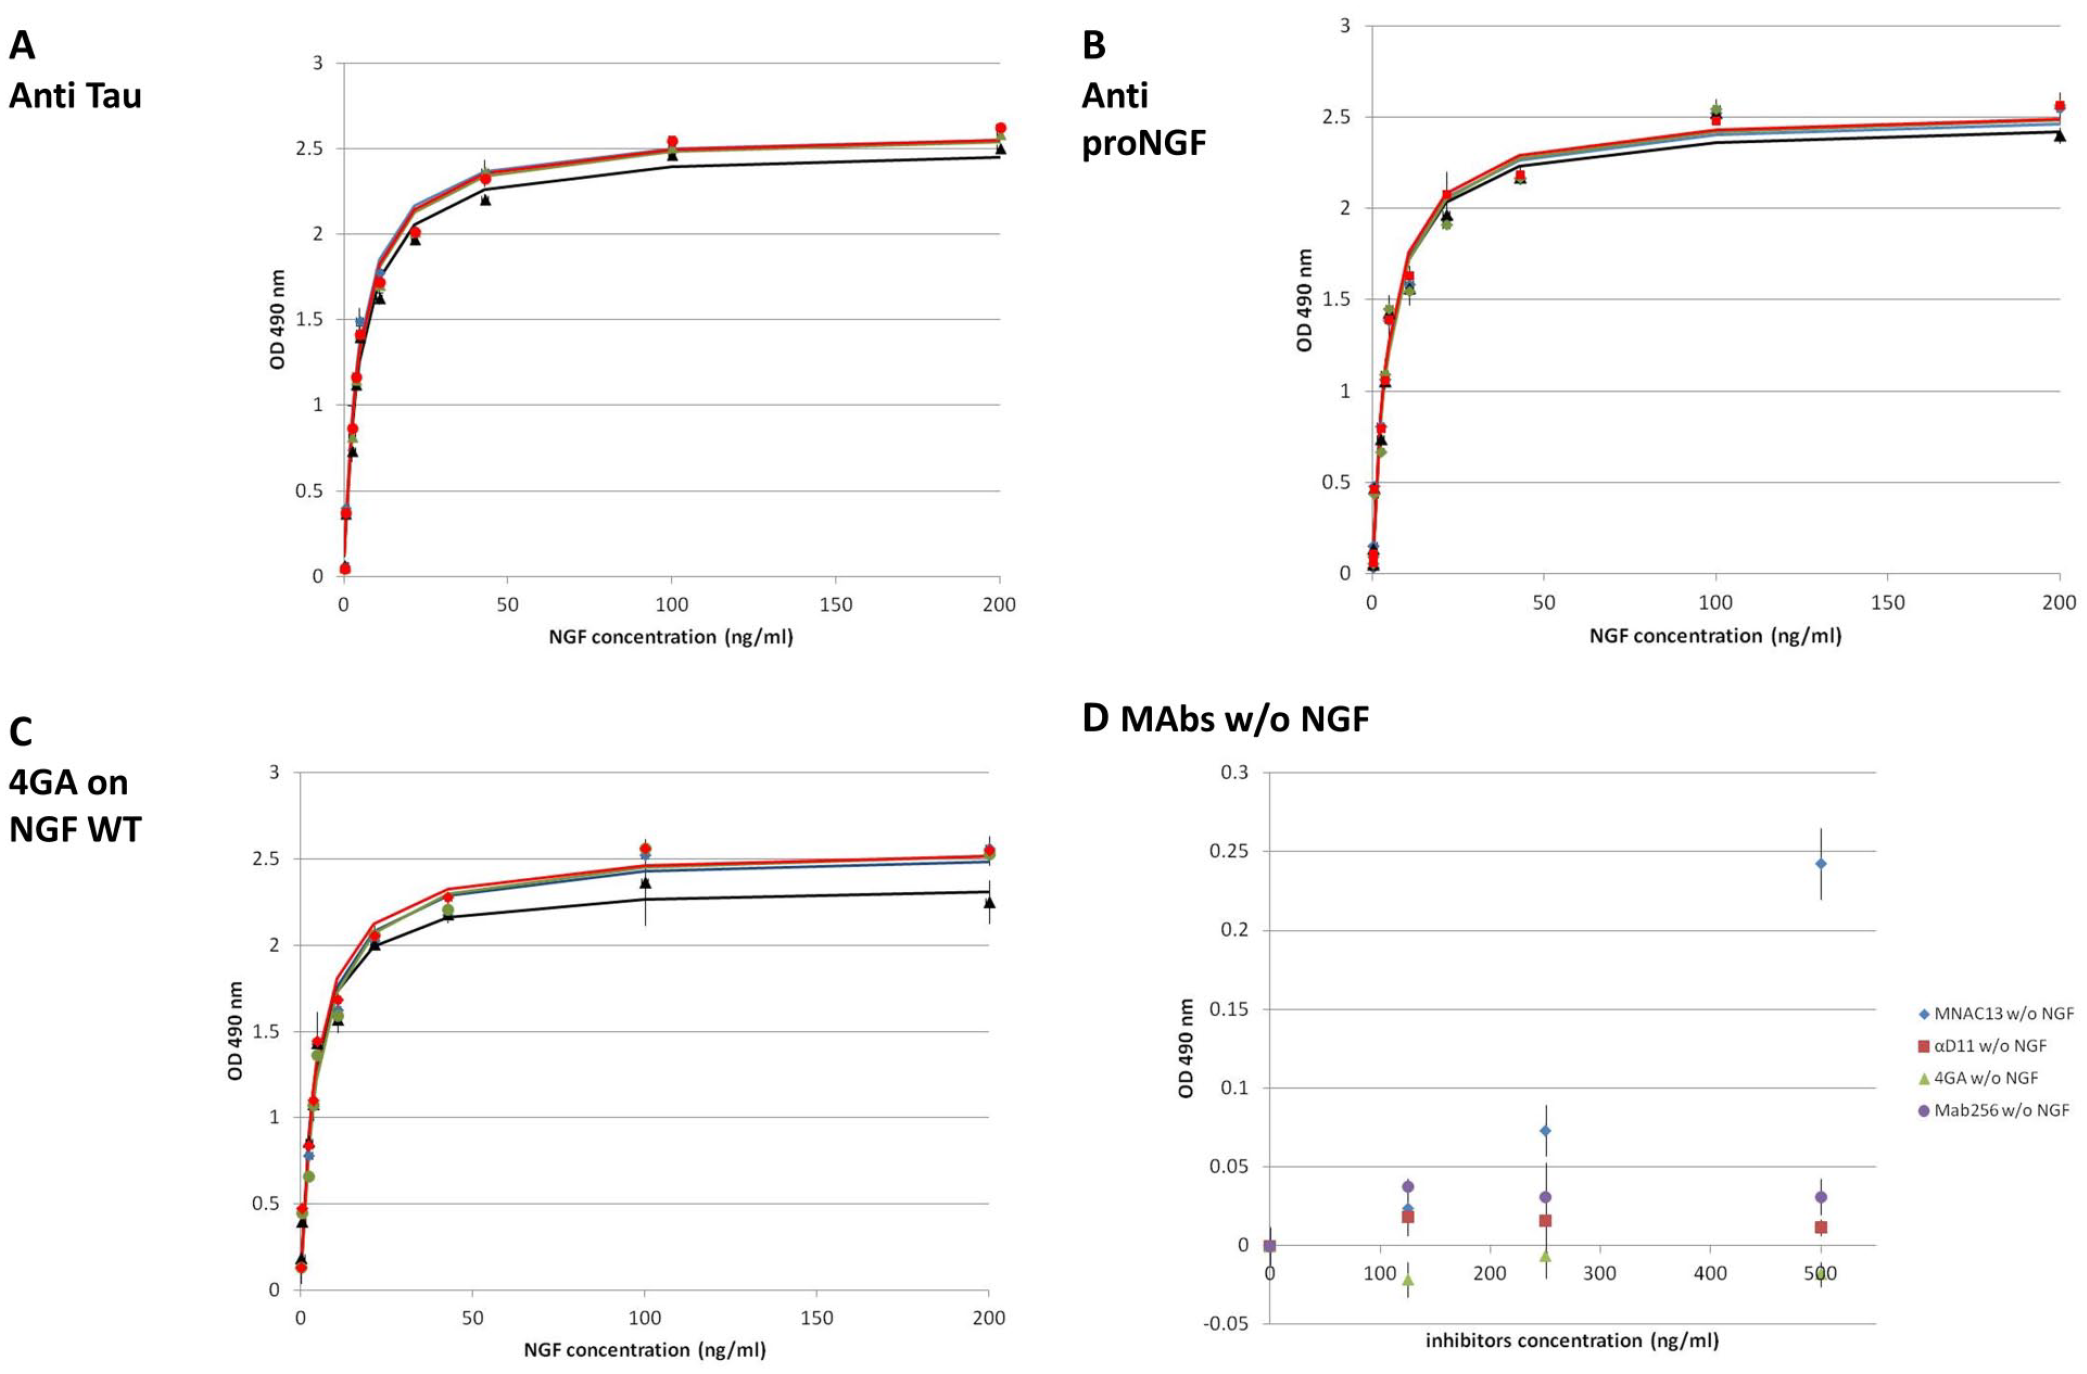
Negative controls. The NTAB [NGF–TrkA (nerve growth factor–tropomyosin receptor kinase A) antagonist bioassay] set of curves was generated for the unrelated antibodies (
To have a quantitative overview of the different efficacy rates of the inhibitors, the calculated Hmax and C50 at different inhibitor concentrations were compared ( Suppl. Tables S3 and S4 ). The effect of the inhibitors is evident from the change of the parameters of the dose–response curves: The C50 value increases with the increase of the inhibitor concentration, while the Hmax value does not always change (e.g., in the case of MNAC13 inhibition, the Hmax value was almost invariable). The C50 parameter is most consistently affected by the inhibition and represents the concentration of hNGF determining half of the maximum effect on cell proliferation (1/2 Hmax); it takes into account the variations both in NGF concentration and also in Hmax. For this reason, we evaluated the C50 parameter as a function of inhibitor concentrations. As is evident from Figure 4A , the C50 value varies in the function of inhibitor concentration, following a linear trend, with a slope representing a direct index of the strength of inhibition (see the Data Analysis subsection in the Materials and Methods section). An increase in the slope of the curve corresponds, therefore, to a higher potency of inhibition. This allows one to analyze the efficacy of different inhibitors by comparing a single numeric parameter, deduced from the set of dose–response curves ( Table 1 ). Among the antibodies tested in this study, the best inhibitor was MAb αD11, followed by FAb αD11 (and 4GA on NGF painless). This result is expected, because αD11 has a sub-picomolar affinity for NGF, with a kinetics of dissociation that is significantly slow, causing a very stable antigen–antibody complex that justifies the blocking effect on NGF. 25
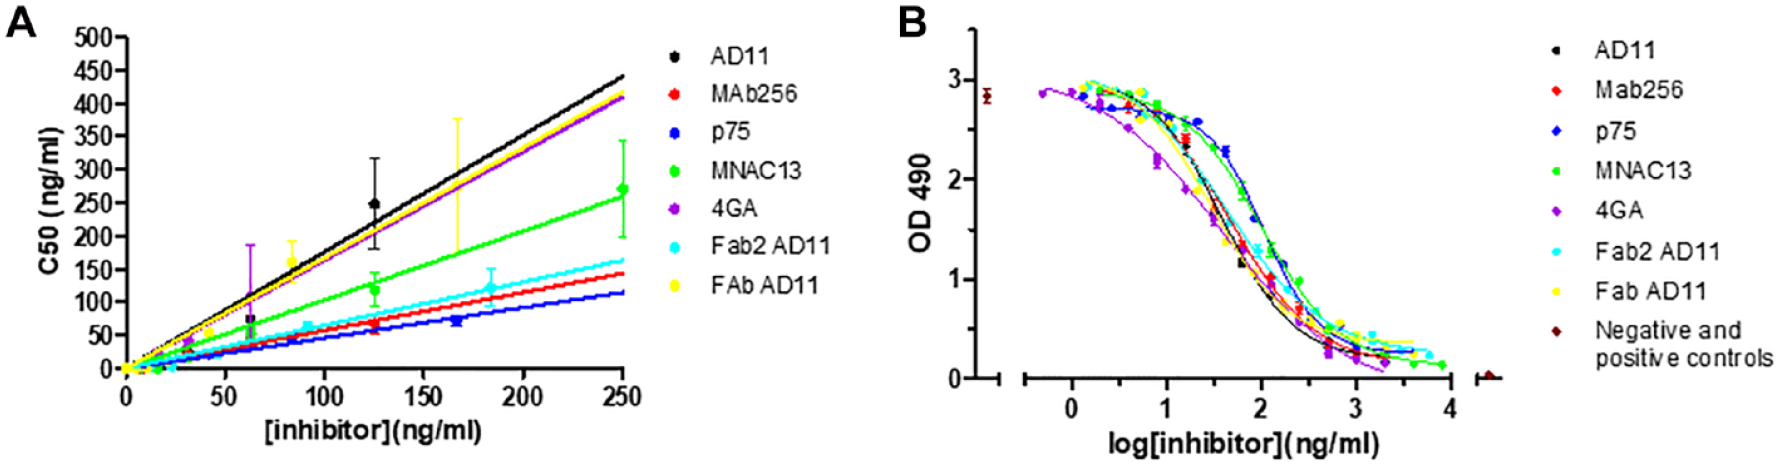
Comparison among the strength of inhibition of the tested antagonists. (
Slope, R2 and IC50 Values Calculated for the Tested Antagonists.

FAb, Antigen-binding fragment; MAb, monoclonal antibody; NGFp, nerve growth factor painless; p75NTR, p75 neurotrophin receptor.
We compared the potency of some of the inhibitors (Mab αD11, Mab MNAC13, Mab256, and p75NTR BP) using the widely used cellular assay, the PC12 neurite outgrowth assay. As is evident from the results in the Supplemental Materials ( Suppl. Fig. S1 ), in all the tested conditions, the rank order obtained by the NTAB assay also was confirmed in this assay. Due to the described intrinsic limitations of the PC12 neurite outgrowth assay, we were not able to obtain any pharmacologically relevant parameters.
To compare the C50 slope parameter to the IC50, a pharmacological parameter, the IC50 value was calculated. In Figure 4B , the interpolated sigmoidal curves for each inhibitor are shown, while the calculated IC50 values are listed in Table 1 .
A comparison between the C50 slope parameter and the IC50 half-maximal dose shows that they are comparable with some limited differences (see Table 1 ). Consideration of the two parameters integrates information about the inhibitors. Indeed, while the IC50 value, the half-maximal inhibitory concentration, is calculated at a fixed concentration of NGF, the C50 slope parameter globally reflects all the tested NGF concentrations, with respect to the NGF curve without inhibitor (i.e., it reflects the effect of the inhibitor on the whole range of NGF concentrations tested).
Discussion
NGF holds great therapeutic potential due to its neurotrophic and neuroprotective properties, but it is also involved in some pathways, principally driven by TrkA, that, if not correctly regulated, can lead to unwanted pathological outcomes linked to pain, angiogenesis, and cancer.
Indeed, there is an increasing interest, from a therapeutic perspective, in designing new effective molecules (antibodies, antibody fragments, or small molecules) able to inhibit the undesired NGF–TrkA pathway.
We have set up a new bioassay (the NTAB) for the determination of the inhibitory potency of NGF–TrkA antagonists, based on the NGF-dependent proliferation of the human TF1 erythroleukemic cell line. 20 This assay provides an easy and quantitative way to determine the functional potency of NGF–TrkA signaling. Moreover, the TF1 cells express human TrkA in the absence of detectable p75NTR, 16 so the assay provides a measure of pure TrkA responses. A panel of different NGF–TrkA inhibitors was tested by the NTAB, and the strength of inhibition was quantitatively estimated. We analyzed the strength of inhibition of candidate antagonists by measuring the variations produced by different concentrations of inhibitors on the dose–response NGF curves. By comparing the C50 values trend in the function of the antagonist concentration, we were able to generate a “potency ranking” for the tested molecules by using a single numeric parameter, and to reveal which inhibitor in a panel of potential candidates is more effective in preventing TrkA–NGF interaction, providing the methodological basis for the use of the assay in the screening of NGF–TrkA inhibitors.
There are some published functional cell-based assays for determination of the inhibition potency of compounds inhibiting the NGF–TrkA axis, but our assay presents advantages over these ones for one or more of these reasons: (1) It is quantitative, giving a unique parameter defining the inhibitory potency; (2) it evaluates only the TrkA response in the absence of the p75NTR receptor; (3) it is simpler; (4) it is based on a natural biological response; and (5) it is versatile, because it has been set up for lab-scale use but could be easily automated for industrial purposes. An ideal NGF–TrkA bioassay should be (1) based on a natural functional response; (2) dependent exclusively on TrkA signaling, without the confounding presence of p75 signaling; and (3) quantitative, with a good dynamic range.
Moreover, the NTAB is a cell-based assay, with a well-assessed protocol, easy to be scalable from 96-well microtiter plates to 384- or 1536-well plates. Due to its characteristics, the NTAB could be optimized into a high-throughput format for large-scale screening of inhibitory compounds, after steps of miniaturization and automation by the means of multichannel liquid-handling instruments. This feature could be used by the pharmaceutical industry: Cell-based high-throughput screening assays are largely used in modern drug discovery for their ability to provide robust performance on a large scale, under automated and high-speed conditions.
In summary, we have provided a quantitative, robust, scalable, and simple high-throughput compatible assay for the screening and selection of a large number of candidate NGF–TrkA inhibitors for further development or potential use in therapies against pain, angiogenesis, or cancer, or for research use.
Supplemental Material
sj-pdf-1-jbx-10.1177_24725552211000672 – Supplemental material for A Quantitative Bioassay to Determine the Inhibitory Potency of NGF–TrkA Antagonists
Supplemental material, sj-pdf-1-jbx-10.1177_24725552211000672 for A Quantitative Bioassay to Determine the Inhibitory Potency of NGF–TrkA Antagonists by Francesca Malerba, Bruno Bruni Ercole, Rita Florio and Antonino Cattaneo in SLAS Discovery
Footnotes
Acknowledgements
The authors acknowledge Valentina Latina, Giuseppina Amadoro, and Annalisa Manca for technical support. We thank Simon Westbrook (Levicept) for providing the p75NTR scavenger.
Supplemental material is available online with this article.
Declaration of Conflicting Interests
The authors declared no potential conflicts of interest with respect to the research, authorship, and/or publication of this article.
Funding
The authors received the following financial support for the research, authorship, and/or publication of this article: This work was supported by the European Commission (PAINCAGE no. 603191 and MADIA no. 732678) and by Fondo Ordinario Enti (FOE D.M. 865/2019) in the framework of a collaboration agreement between the Italian National Research Council and EBRI (2019–2021).
References
Supplementary Material
Please find the following supplemental material available below.
For Open Access articles published under a Creative Commons License, all supplemental material carries the same license as the article it is associated with.
For non-Open Access articles published, all supplemental material carries a non-exclusive license, and permission requests for re-use of supplemental material or any part of supplemental material shall be sent directly to the copyright owner as specified in the copyright notice associated with the article.