
Abstract
We have developed a novel reporter assay that leverages SNAP-epitope tag/near-infrared (NIR) imaging technology to monitor G protein-coupled receptor (GPCR) degradation in human cell lines. N-terminal SNAP-tagged GPCRs were subcloned and expressed in human embryonic kidney (HEK) 293 cells and then subjected to 24 h of cycloheximide (CHX)-chase degradation assays to quantify receptor degradation half-lives (t1/2) using LICOR NIR imaging–polyacrylamide gel electrophoresis (PAGE) analysis. Thus far, we have used this method to quantify t1/2 for all nine adrenergic (ADRA1A, ADRA1B, ADRA1D, ADRA2A, ADRA2B, ADRA2C, ADRB1, ADRB2, ADRB3), five somatostatin (SSTR1, SSTR2, SSTR3, SSTR4, SSTR5), four chemokine (CXCR1, CXCR2, CXCR3, CXCR5), and three 5-HT2 (5HT2A, 5HT2B, 5HT2C) receptor subtypes. SNAP-GPCR-CHX degradation t1/2 values ranged from 0.52 h (ADRA1D) to 5.5 h (SSTR3). On the contrary, both the SNAP-tag alone and SNAP-tagged and endogenous β-actin were resistant to degradation with CHX treatment. Treatment with the proteasome inhibitor bortezomib produced significant but variable increases in SNAP-GPCR protein expression levels, indicating that SNAP-GPCR degradation primarily occurs through the proteasome. Remarkably, endogenous β2-adrenergic receptor/ADRB2 dynamic mass redistribution functional responses to norepinephrine were significantly decreased following CHX treatment, with a time course equivalent to that observed with the SNAP-ADRB2 degradation assay. We subsequently adapted this assay into a 96-well glass-bottom plate format to facilitate high-throughput GPCR degradation screening. t1/2 values quantified for the α1-adrenergic receptor subtypes (ADRA1A, ADRA1B, ADR1D) using the 96-well-plate format correlated with t1/2 values quantified using NIR-PAGE imaging analysis. In summary, this novel assay permits precise quantitative analysis of GPCR degradation in human cells and can be readily adapted to quantify degradation for any membrane protein of interest.
Keywords
Introduction
It has been estimated that ~30%–40% of all approved medications target the G protein-coupled receptor (GPCR) family of membrane proteins. 1 Thus, understanding the biological basis of GPCR function is essential for human health, as each new revelation of a conserved GPCR process provides a potential interface to be modulated with novel small molecules. One such basic process that has been gathering increasing interest includes GPCR ubiquitin-dependent degradation.2,3 With the discovery of small molecules that act as “molecular glues” to enhance the interaction affinity between target substrates and their cognate E3 ligases, the potential to enhance or block GPCR degradation with novel small molecules appears tractable. 4 However, before this nascent field in GPCR drug discovery can be harvested, revealing the precise mechanisms regulating GPCR degradation in human cells is essential.
To date, significant effort has been put forth to identify E3 ubiquitin ligases that govern trafficking and/or degradation of specific GPCR cohorts. Potential GPCR:E3 ligase combinations that have been proposed include MDM2, 5 Nedd4, 6 and MARCH27 for β2-AR, AIP4 for CXCR48 and the delta-opioid receptor, 9 SMURF2 for the mu-opioid receptor, 10 Nedd4-2 for the PAR1 and P2Y1 receptors, 11 Cbl for the PAR2 receptor, 12 and Siah1A for metabotropic glutamate receptors 1 and 5. 13 Given that the human body encodes >800 GPCRs, 14 much work remains to be performed if we are to categorize GPCRs into modules of E3 ubiquitin ligase nodes. Unfortunately, matching GPCRs with their cognate E3 ligases has proven to be experimentally challenging, primarily due to the inherent technical issues associated with performing biochemical assays on membrane proteins. Commercially available anti-GPCR antibodies are often of minimal experimental utility, 15 and as a result, the GPCR field has had to rely heavily on fusion epitope tags to monitor GPCR degradation in cell culture using standard biochemical (i.e., co-immunoprecipitation) and imaging (i.e., confocal fluorescence microscopy) assays. Although useful, these approaches have limited quantitative accuracy and often produce numerous nonspecific artifacts that can reduce the reliability of data sets. Thus, to achieve the goal of pairing all human GPCRs with the E3 ubiquitin ligases that facilitate their degradation, assays that can be performed with relatively high throughput, can produce reliable, reproducible data sets, and are sufficiently sensitive to detect low GPCR expression levels are essential.
Herein, we report the development of a novel cycloheximide (CHX)-chase degradation assay we termed SNAP-GPCR-CHX. This assay leverages the self-labeling SNAP-epitope reporter tag to facilitate the monitoring of SNAP-tagged GPCR protein expression levels using LICOR near-infrared (NIR) imaging–polyacrylamide gel electrophoresis (PAGE) assays. SNAP-GPCR-CHX was validated using a series of essential control experiments that (1) compared endogenous and SNAP-tagged protein degradation rates, (2) determined the effect of altering SNAP-tagged GPCR expression levels on degradation rate, and (3) examined the effects of the proteasome inhibitor bortezomib. Next, we used SNAP-GPCR-CHX to calculate t1/2 degradation rates for 21 human GPCRs expressed transiently in human embryonic kidney (HEK) cells. SNAP-GPCR degradation rates were subsequently correlated with degradation rates of endogenous GPCRs expressed in cultured cells by monitoring agonist-stimulated label-free dynamic mass redistribution (DMR) functional responses. Finally, we repurposed SNAP-GPCR-CHX into 96-well plates to facilitate high-throughput screening of GPCR degradation. In doing so, we demonstrate that SNAP-GPCR-CHX permits rapid, quantitative, and reproducible determination of GPCR protein half-life in cultured human cells with the potential for high-throughput screening and is thus amenable to identifying degradative mechanisms targeting GPCRs.
Materials and Methods
Chemicals, Constructs, and Cell Lines
HEK293 and SW480 human colon carcinoma cells were purchased from ATCC (Manassas, VA) and grown in Dulbecco’s modified Eagle’s medium (DMEM) supplemented with 10% fetal bovine serum and 2 mM
SNAP-CHX-Chase Assays
Forty-eight hours posttransfection, 50 µg/mL CHX was added to cultured cells. Cells were treated for 0–6 and 24 h. Cells were then counted with the Corning cytosmart, diluted to ensure uniformity across samples, and immediately lysed in 50 mM Tris, pH 7.4, 150 mM NaCl 0.1% Tween-20, 1% NP40 buffer at 4 °C. Cell lysates were subsequently treated with 0.5 µM SNAP substrate BG-782 and subjected to PAGE. Next, GPCR monomer band fluorescent intensities at 800 nm were quantified with the LI-COR Clx NIR imaging system (Lincoln, NE). PAGE gels were Coomassie stained to quantify total protein levels per gel lane in order to normalize each data point by total protein per sample. For β-actin SNAP-CHX assays, polyacrylamide gels were transferred to nitrocellulose blots, blocked with 5% bovine serum albumin, and incubated overnight at 4 °C with 1:1000 rabbit anti-β-actin monoclonal antibody from Cell Signaling Technologies (Danvers, MA). Nitrocellulose was then washed 3× with PBST and incubated for 1 h with 1:5000 goat anti-rabbit DyLight 680 antibody.
96-Well-Plate SNAP-CHX-Chase Assays
Following transient transfection using the conditions described in “Chemicals, Constructs, and Cell Lines,” HEK293 cells were trypsinized and plated at ~100,000 cells/well into 96-well glass-bottom plates. CHX (50 µg/mL) was added to each well and incubated for 0–6 h. Cells were then fixed with 4% paraformaldehyde for 30 min. Next, cells were labeled with 0.5 µM SNAP–substrate BG-782 for 30 min at 37 °C in darkness. Cell nuclei were stained with To-Pro-3. Plates were then imaged with LI-COR Odyssey Clx NIR imaging in the 800 nm channel to measure SNAP-GPCR protein expression. To-Pro-3 nuclear stain signals were measured in the 700 nm channel and used as a normalization control for each well.
Label-Free DMR Assays
Cells were counted with the Corning cytosmart counter and plated uniformly at ~50,000 cells/well in 384-well Corning Epic microsensor plates. Cells were cultured for 24 h and then mounted on the Corning Epic BT reader at 37 °C. Baseline DMR measurements were recorded for 1 h. Compounds were added with the Sorenson Biosciences 96-well Benchtop Pipettor and agonist DMR responses were recorded for 1 h. Data were exported to Microsoft Excel using Epic Analyzer Software for analysis with GraphPad Prism software (La Jolla, CA).
Data Analysis
All PAGE SNAP-CHX-chase data were analyzed with GraphPad Prism software and are expressed as percent band intensity per total protein as measured by Coomassie staining. All 96-well-plate data are expressed as %800 nm/%700 nm signal values in each individual well.
Results and Discussion
The SNAP-tag is a 20 kDa mutant of the DNA repair protein O6-alkylguanine-DNA alkyltransferase that can be covalently bound by benzylguanine derivatives linked to an array of synthetic probes. We and others have utilized SNAP-tag technology to monitor GPCR protein expression and localization in vitro.16–25 Here, we investigated the utility of incorporating SNAP-tag technology into traditional CHX-chase assays to permit calculation of GPCR protein half-lives when expressed in cultured human cells. Our experimental workflow involved fusing the SNAP-tag to the N-terminal domain of select GPCRs, transiently transfecting SNAP-GPCR cDNA constructs into HEK293 cells, and then treating cells with 50 µg/mL CHX for 0–24 h. Cells were then lysed and treated with the irreversible SNAP substrate BG-782, subjected to PAGE, and analyzed with LICOR Odyssey NIR quantitative analysis.
To begin, we examined the utility of performing SNAP-GPCR-CHX studies on the adrenergic family of GPCRs, which are clinical targets for numerous cardiovascular
26
and central nervous system disorders.
27
Our previous studies have demonstrated the utility of using SNAP-tag labeling to monitor adrenergic receptor (AR) protein expression and agonist-stimulated functional responses in label-free DMR assays.
16
Shown in
Figure 1
are representative SNAP PAGE images of CHX-chase assays performed in HEK293 cells transiently expressing the α1-AR (α1A-AR/ADRA1A [
Fig. 1A
], α1B-AR/ADRA1B [
Fig. 1B
], α1D-AR/ADRA1D [
Fig. 1C
]), α2-AR (α2A-AR/ADRA2A [
Fig. 1E
], α2B-AR/ADRA2B [
Fig. 1F
], α2C-AR/ADRA2C [
Fig. 1G
]), and β-AR (β1-AR/ADRB1 [
Fig. 1I
], β2-AR/ADRB2 [
Fig. 1J
], β3-AR/ADRB3 [
Fig. 1K
]) receptor subtypes. Each SNAP-GPCR-CHX-chase assay was performed in triplicate, and data were analyzed with GraphPad Prism software to calculate the protein half-life (t1/2) with nonlinear regression one-phase exponential decay curve fitting (
SNAP-GPCR Degradation Half-Lives (t1/2) as Quantified with SNAP-CHX-Chase Assays (n = 3 or 4).
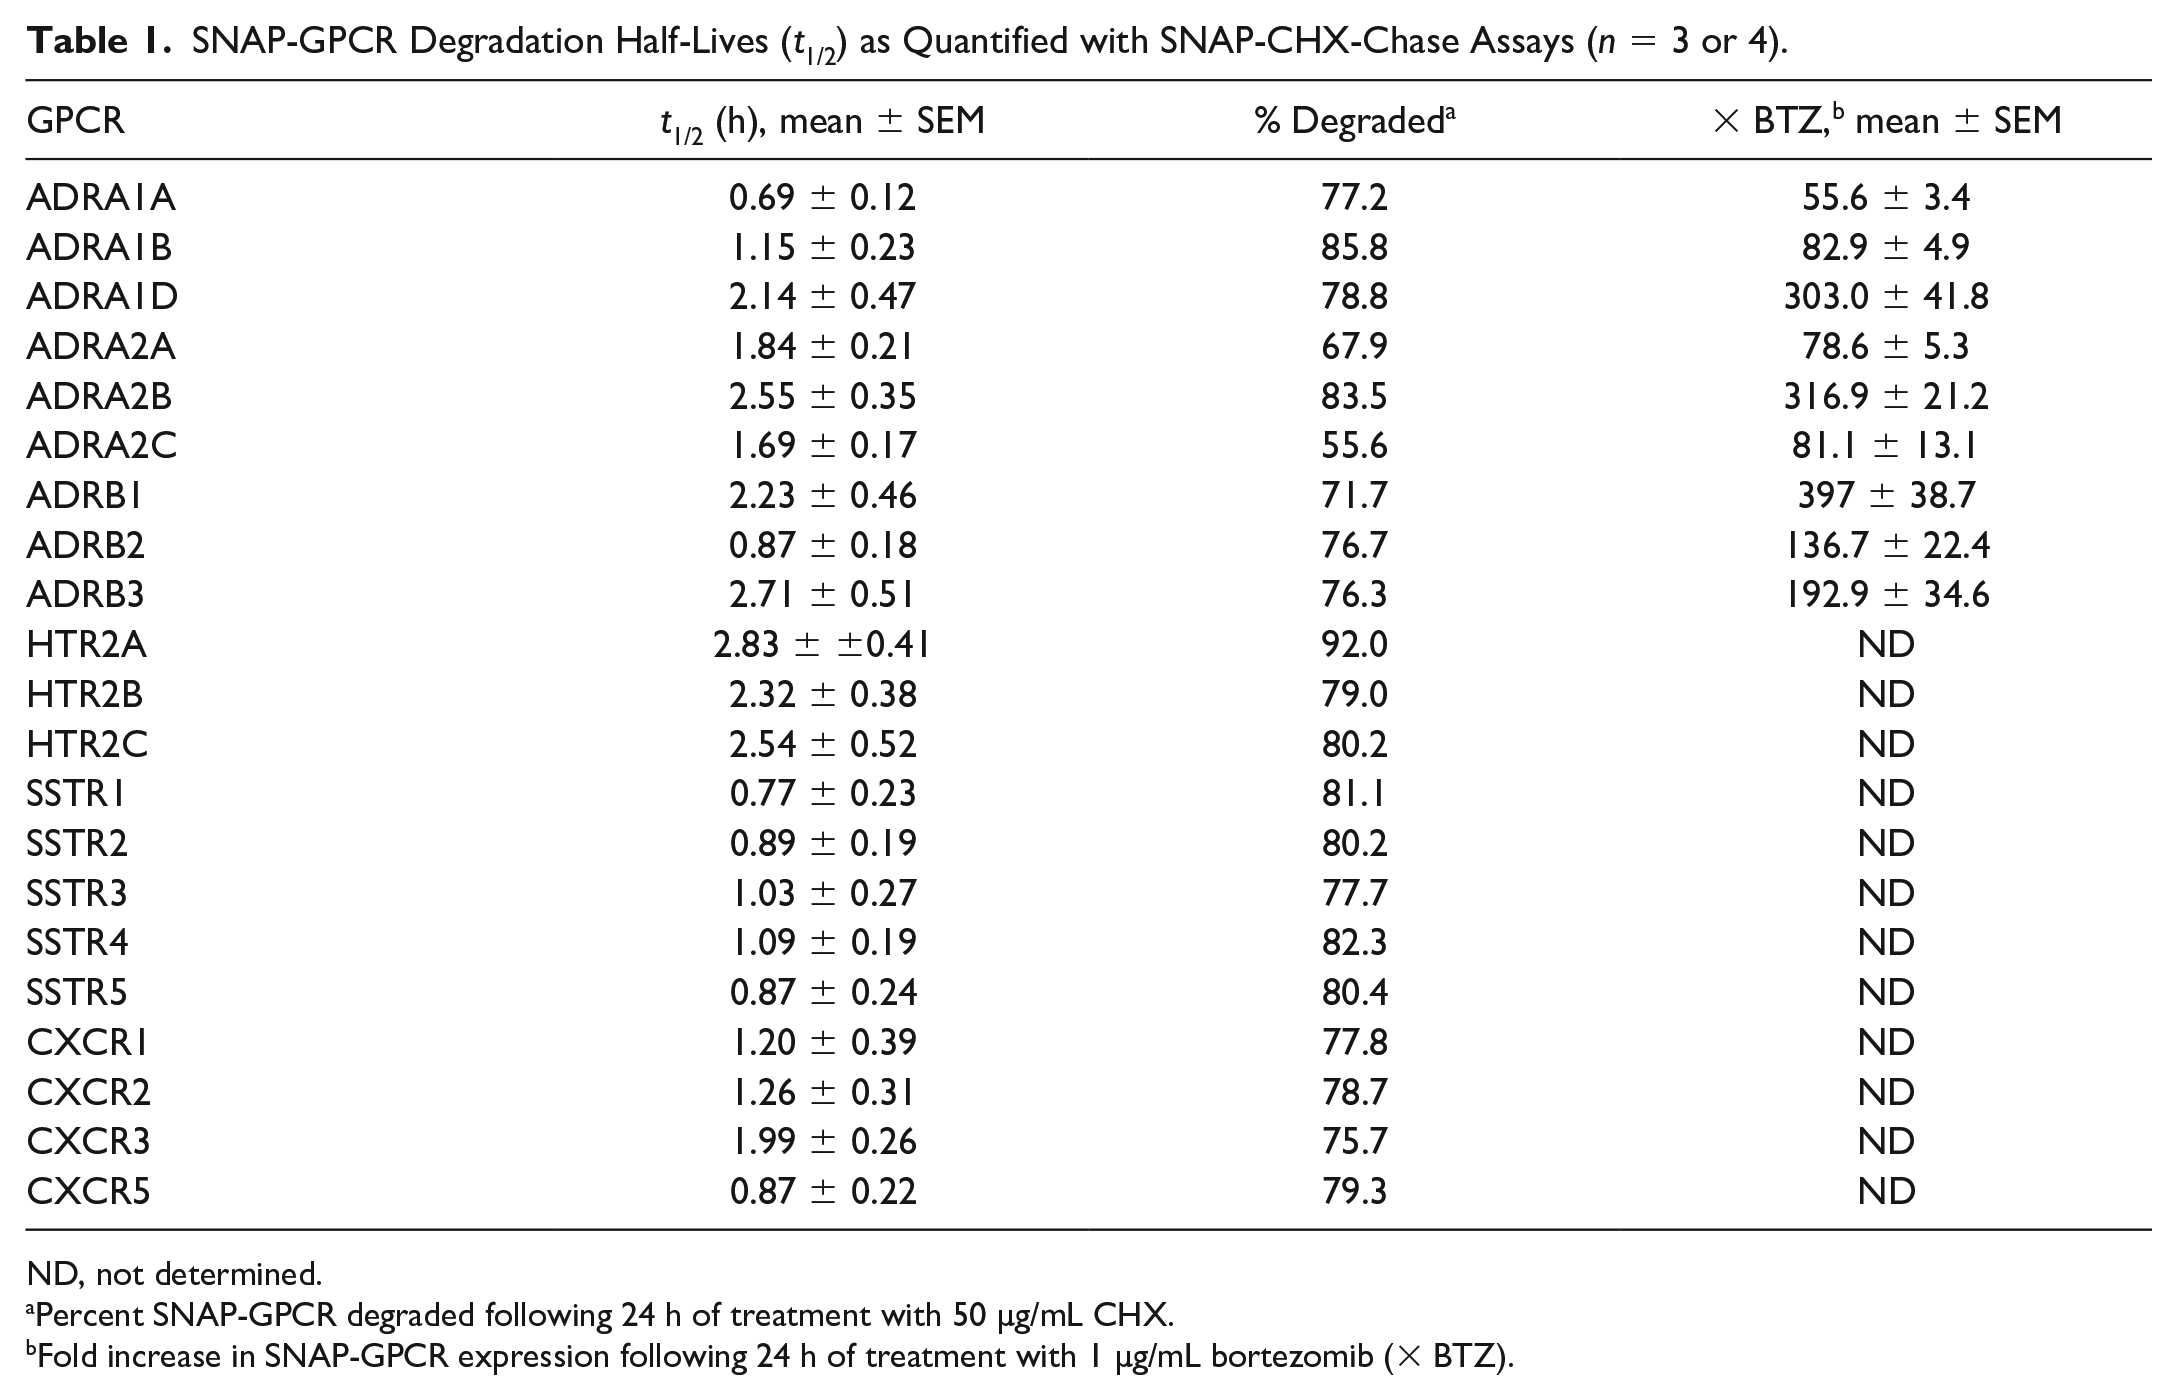
ND, not determined.
Percent SNAP-GPCR degraded following 24 h of treatment with 50 µg/mL CHX.
Fold increase in SNAP-GPCR expression following 24 h of treatment with 1 µg/mL bortezomib (× BTZ).
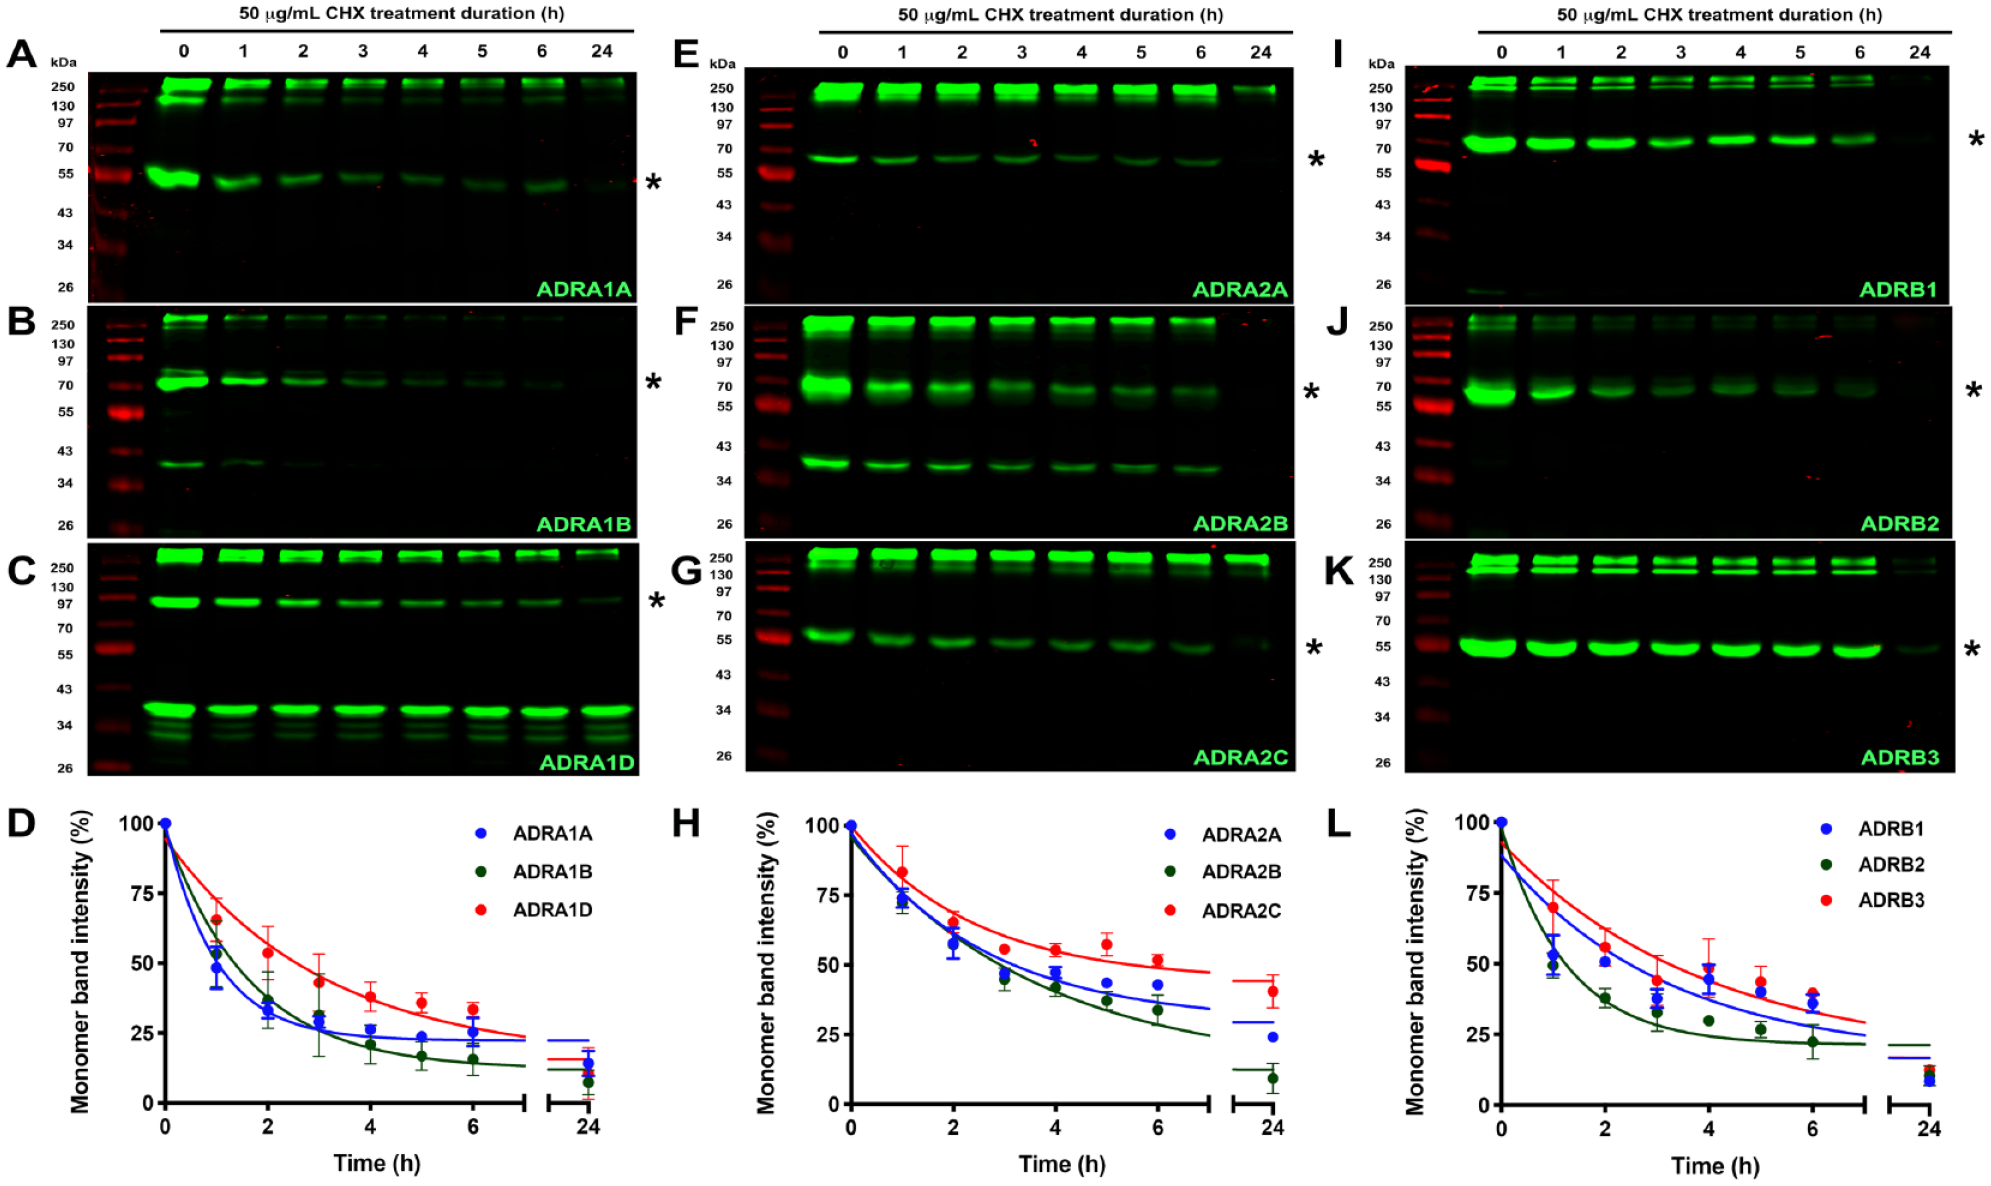
CHX-chase of SNAP-tagged ARs in HEK293 cells. Representative images of polyacrylamide gels displaying SNAP-GPCR protein levels in HEK293 cell lysates expressing the α1-ARs: (
Next, we tested if the observed GPCR degradation rates were affected by nonspecific artifacts induced by the presence of the SNAP-tag. First, CHX-chase degradation assays were performed on HEK293 cells expressing empty pSNAP vector. As shown in
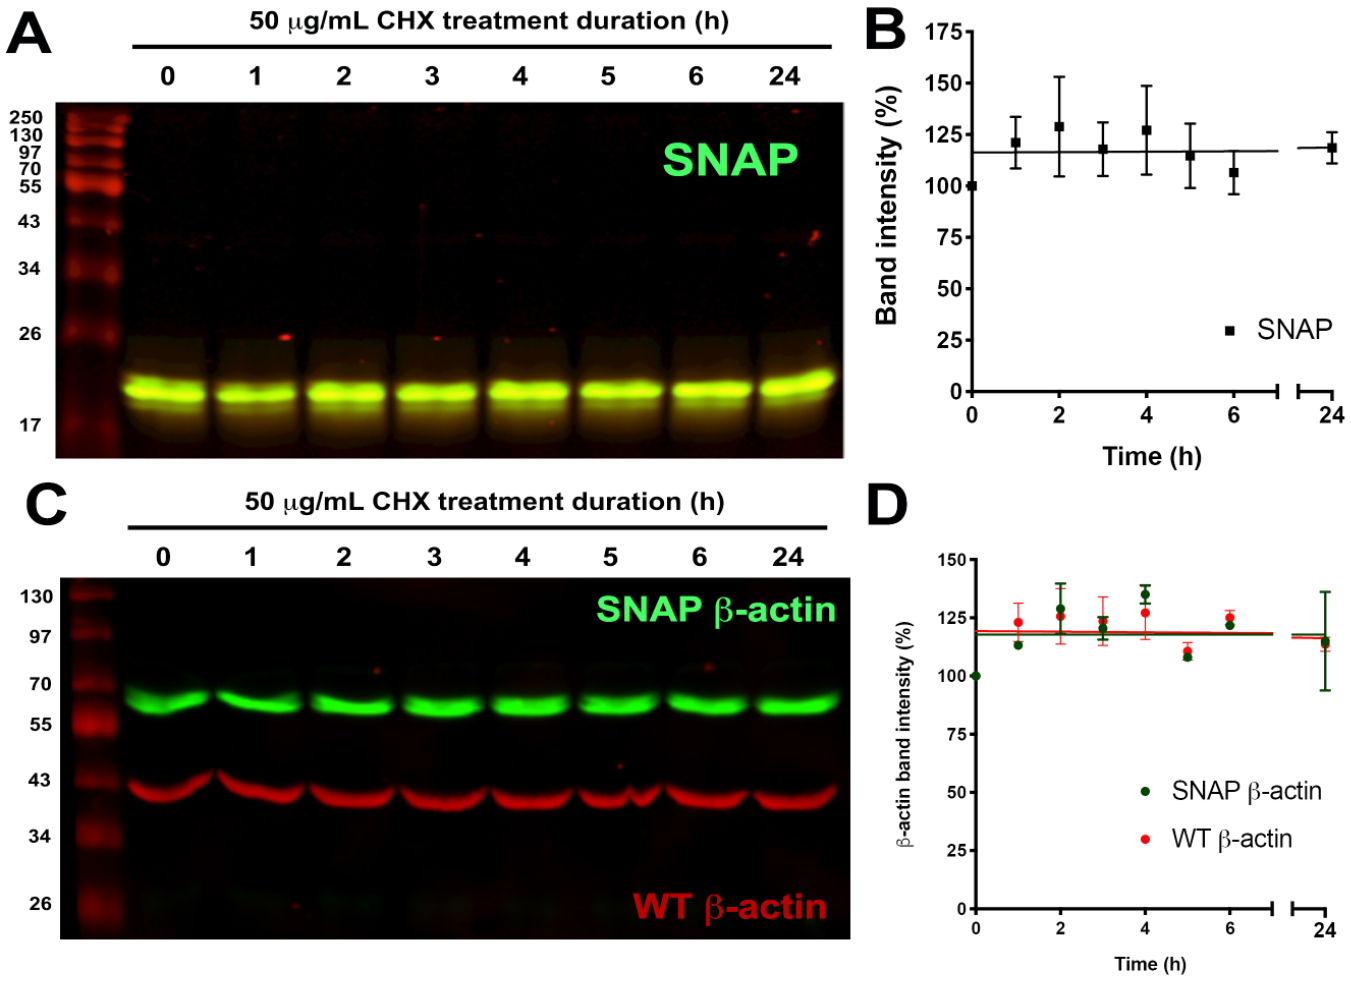
CHX-chase of pSNAP and β-actin in HEK293 cells. (
GPCRs are degraded by both E1/E2/E3 ubiquitin/proteasome-dependent and -independent (i.e., lysosomal) mechanisms.
28
To delineate the contribution of ubiquitin- and non-ubiquitin-dependent mechanisms to GPCR degradation, HEK293 cells expressing SNAP-GPCRs were treated with bortezomib, a selective inhibitor of the 26S proteasome that is FDA approved to treat multiple myeloma and lymphoma. If specific SNAP-tagged GPCRs are degraded by the ubiquitin/proteasome pathway, we would expect bortezomib treatment to enhance SNAP-GPCR protein expression levels following 24 h treatment.
Figure 3
compares the effects of 1 µM bortezomib on HEK293 cells expressing the α1-AR (α1A-AR/ADRA1A [
Fig. 3A
], α1B-AR/ADRA1B [
Fig. 3B
], α1D-AR/ADRA1D [
Fig. 3C
]), α2-AR (α2A-AR/ADRA2A [
Fig. 3e
], α2B-AR/ADRA2B [
Fig. 3F
], α2C-AR/ADRA2C [
Fig. 3G
]), and β-AR (β1-AR/ADRB1 [
Fig. 3I
], β2-AR/ADRB2 [
Fig. 3J
], β3-AR/ADRB3 [
Fig. 3K
]) receptor subtypes. Remarkably, bortezomib enhanced protein expression levels of all nine AR subtypes with rank order ADRB1 > ADRA2B > ADRA1D > ADRB3 > ADRB2 > ADRA1B > ADRA2C > ADRA2A > ADRA1A (
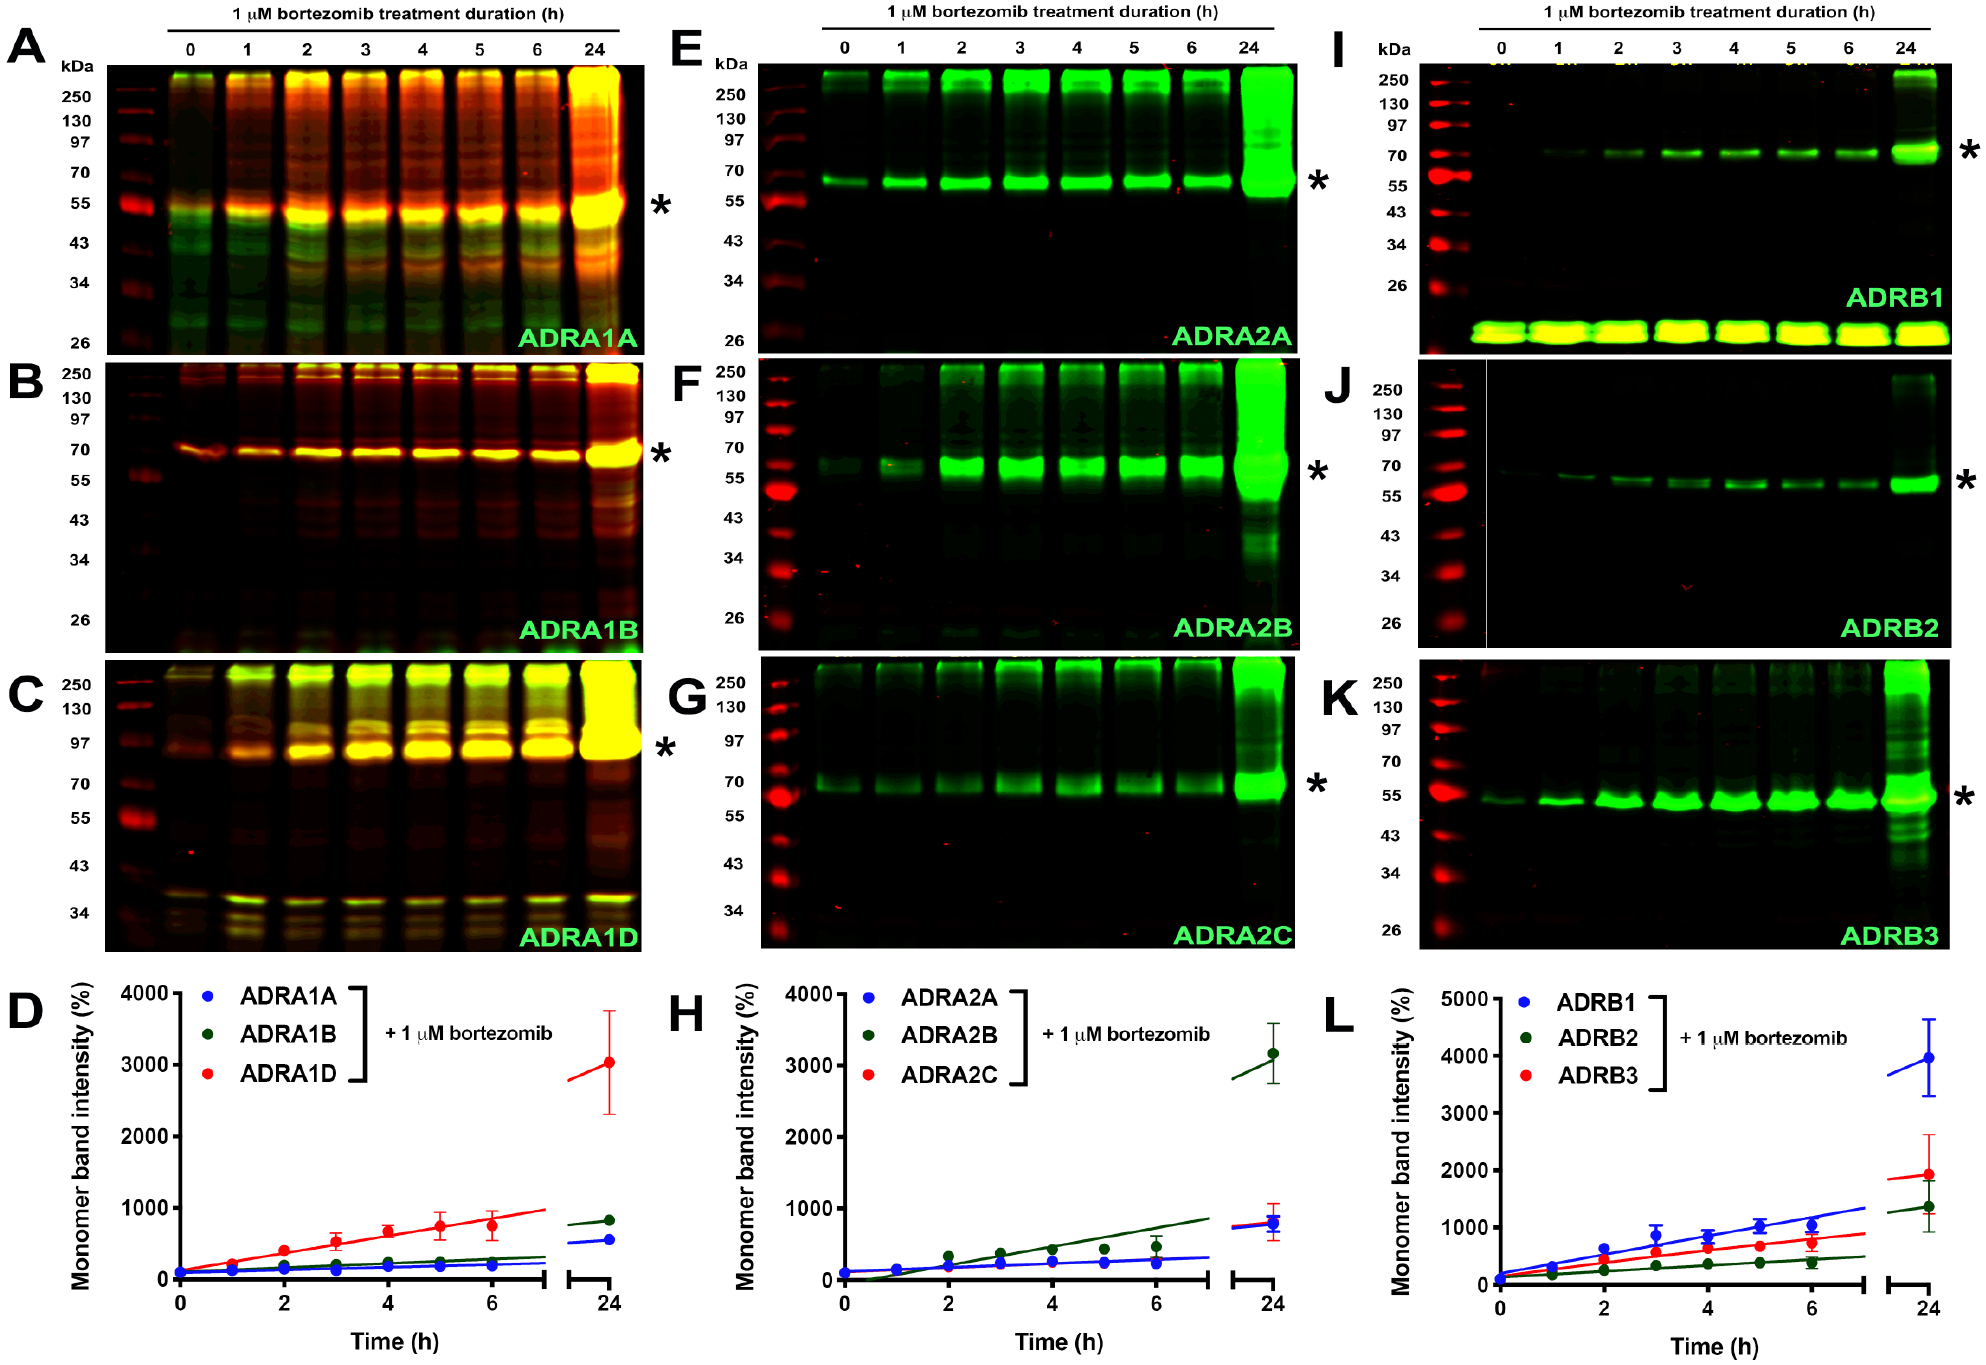
Effects of the proteasome inhibitor bortezomib on SNAP-GPCR protein expression in HEK293 cells. Representative images of polyacrylamide gels displaying SNAP-GPCR protein levels in HEK293 cell lysates expressing the α1-ARs: (
One potential limitation of this novel approach is the reliance on ectopic SNAP-GPCRs, which may produce results that are not entirely indicative of the cellular or molecular mechanisms degrading endogenous GPCRs in vivo. Thus, we examined the effects of CHX-induced degradation of endogenously expressed GPCRs by measuring agonist-stimulated label-free DMR responses in cultured cells. In previous studies, we determined that HEK293 cells endogenously express functional β-ARs using label-free DMR Schild regression analysis.
16
Twenty-four-hour CHX treatment reduced protein expression levels of β-ARs by >70% in SNAP-GPCR-CHX assays (
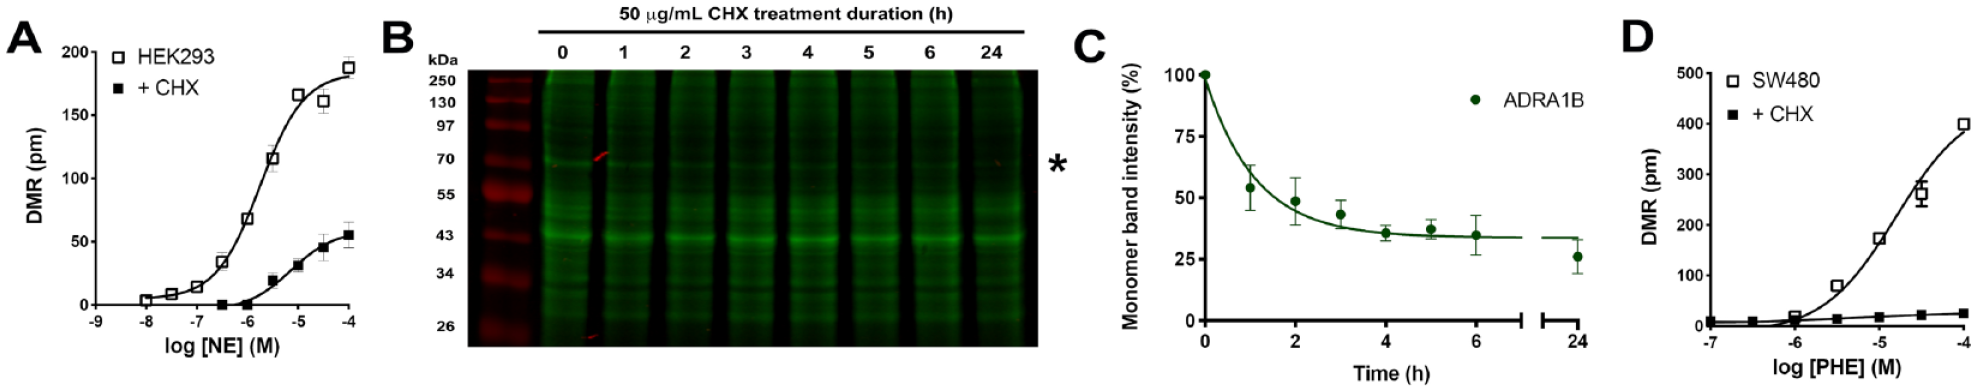
CHX treatment reduces GPCR functional responses in cultured human cells. (
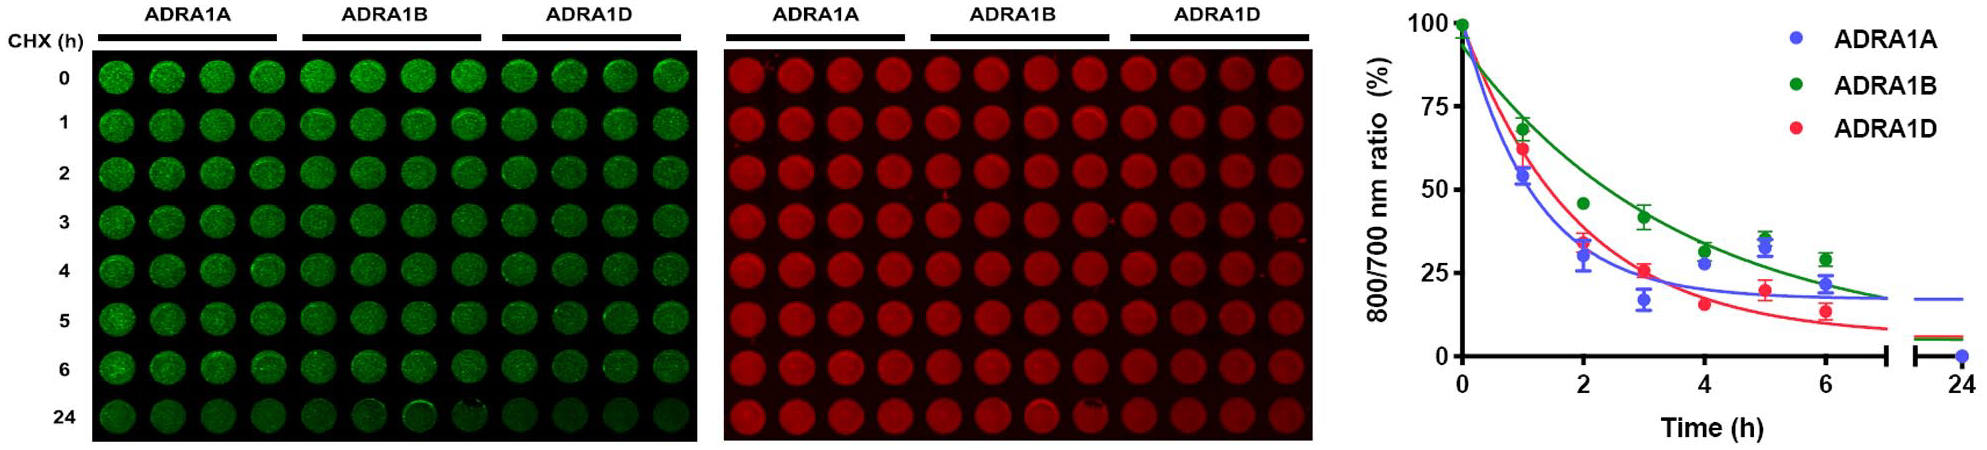
Finally, we adapted the SNAP-GPCR-CHX assay to a 96-well-plate imaging, high-throughput format. In brief, HEK293 cells transfected with SNAP-GPCR subtypes were seeded in glass-bottom 96-well plates and treated with 50 µg/mL CHX for 0–24 h. Cells were then fixed with paraformaldehyde and stained with BG-782 to label SNAP-GPCRs or with TO-PRO-3 to label cell nuclei, as a normalization control. Plates were then imaged and analyzed with LICOR NIR. Shown in
Figure 5A
is a representative 96-well-plate SNAP-GPCR-CHX assay performed on HEK293 cells expressing the α1AR subtypes;
Figure 5B
displays the calculated degradation rates for each subtype, which are quantified as the ratio of 800 nm fluorescence (SNAP substrate BG-782, green) divided by the 700 nm signal (TO-PRO-3, red). In comparison with SNAP-GPCR-CHX degradation rates determined using NIR-PAGE, the 96-well-plate format produced similar half-life values (ADRA1A t1/2 = 0.83 ± 0.24 h; ADRA1B = 2.48 ± 0.76 h; ADRA1D t1/2 = 1.33 ± 0.45 h), with a discrepancy in rank order of ADRA1D > ADRA1B, which we suspect is a result of the 96-well plate capturing all ADRA1D bands labeled with BG-782, including N-terminal cleavage products that are resistant to degradation (
Ninety-six-well-plate CHX-chase assays quantifying SNAP-GPCR protein expression level in HEK293 cells. (
Significant effort has been put forth to decipher the cellular and molecular mechanisms governing GPCR ubiquitin-dependent proteasomal degradation. Unfortunately, progress in the field has been hindered by technical difficulties in performing the currently available biochemical assays on integral membrane proteins like GPCRs. Previous studies have used a wide variety of epitope tags to circumvent these issues, such as HA,29,30 V5, 10 FLAG, 5 and Myc–.30,31 In most approaches, to obtain sufficient GPCR protein signal-to-noise ratios, epitope-tagged GPCRs must first be detergent solubilized and then immunoprecipitated with an affinity resin specific to the fused epitope tag. Standard PAGE and nitrocellulose transfer are performed, followed by immunoblotting with primary and secondary antibodies. Although informative, these biochemical approaches have limited quantitative accuracy, are costly, and are laboriously time-consuming. Alternatively, radiolabeled small-molecule agonists or antagonists can be used to monitor GPCR protein expression levels,32,33 but require significant exposure time to produce detectable signals and are potentially hazardous.
Thus, the primary goal of this study was to develop a simple, reproducible approach that can be used to quantify degradation half-lives of GPCRs (and possibly other membrane proteins) in high throughput relative to traditional immunoprecipitation/immunoblotting. Previous studies in which the SNAP-tag was leveraged to identify and characterize the α1D-AR:Scribble:dystrophin-associated protein complex, 34 determined the importance of type I PDZ ligands for GPCR functional expression, 15 or facilitated the serendipitous discovery that the α1D-AR N-terminal domain is endogenously cleaved 19 guided the decision to incorporate the SNAP-tag into CHX-chase assays. Herein, we demonstrated that the SNAP-epitope tag is remarkably stable and does not induce degradation of β-actin, and thus is not likely enhancing GPCR degradation rates. Additional support for this conclusion comes from our previous studies investigating SNAP-tagged GPCR label-free DMR responses, which clearly demonstrated agonist efficacy, and in turn GPCR functional expression is not hindered by the presence of SNAP-tags located in the N-terminal domain. 15 In future studies, leveraging CRISPR gene editing technology to fuse SNAP-tags to endogenous GPCRs should provide significant information about these essential cellular processes.
Incorporating the SNAP-tag into GPCR degradation studies provides significant experimental advantages. Importantly, SNAP-tagged GPCRs are labeled in cell lysates prior to PAGE, permitting direct imaging of GPCR protein bands in acrylamide gels using LICOR NIR imaging, thereby reducing experiment duration, reagent cost, and nonspecific artifact and enhancing data set resolution. The SNAP-tag can also be repurposed for imaging analysis with cellular localization specificity through the use of cell-permeable and -impermeable SNAP substrates,15,20 or for affinity purification/mass spectrometry of GPCR signaling complexes. 18 Thus, we propose that SNAP-GPCR-CHX assays are amenable for high-throughput monitoring of GPCR protein expression, and thus applicable for studies examining mechanisms governing GPCR degradation, and potentially to screen for small molecules that can enhance or inhibit GPCR degradation. Future experiments to be performed using our de novo 96-well-plate SNAP-GPCR-CHX assay will include testing the effects of proteasome inhibitors (i.e., bortezomib) on GPCR degradation and quantifying GPCR resynthesis rates following CHX washout. These experiments will facilitate the long-term goal of adapting SNAP-NIR CHX assays to identify and characterize the degradation mechanisms of non-GPCR membrane proteins, such as tyrosine kinase receptors, ion channels, adhesion molecules, and others.
Supplemental Material
sj-pdf-1-jbx-10.1177_2472555220979793 – Supplemental material for Development of a Novel SNAP-Epitope Tag/Near-Infrared Imaging Assay to Quantify G Protein-Coupled Receptor Degradation in Human Cells
Supplemental material, sj-pdf-1-jbx-10.1177_2472555220979793 for Development of a Novel SNAP-Epitope Tag/Near-Infrared Imaging Assay to Quantify G Protein-Coupled Receptor Degradation in Human Cells by Kyung-Soon Lee, Edelmar Navaluna, Nicole M. Marsh, Eric M. Janezic and Chris Hague in SLAS Discovery
Footnotes
Supplemental material is available online with this article.
Declaration of Conflicting Interests
The authors declared no potential conflicts of interest with respect to the research, authorship, and/or publication of this article.
Funding
The authors disclosed receipt of the following financial support for the research, authorship, and/or publication of this article: Funding for this research was provided by NIGMS T32GM007750 (E.M.J.) and R01GM100893 (C.H.).
References
Supplementary Material
Please find the following supplemental material available below.
For Open Access articles published under a Creative Commons License, all supplemental material carries the same license as the article it is associated with.
For non-Open Access articles published, all supplemental material carries a non-exclusive license, and permission requests for re-use of supplemental material or any part of supplemental material shall be sent directly to the copyright owner as specified in the copyright notice associated with the article.