
Abstract
Lactate dehydrogenase B (LDH-B) is overexpressed in lung and breast cancer, and it has been considered as a potential target to treat these types of cancer. Herein, we propose a straightforward incomplete factorial (IF) design composed of 12 combinations of two reaction buffers, three pH values, three salt (NaCl) concentrations, and three incubation times, which we called IF-BPST (Buffer/pH/Salt/Time), for the optimization of a colorimetric LDH-B assay in a final volume of 100 µL using 96-well plates. The assay is based on the absorbance change at ~570 nm and the color change of the reaction mixture due to the release of NADH that reacts with nitroblue tetrazolium (NBT) and phenazine methosulfate (PMS), resulting in the formation of a blue-purple formazan. The results obtained using the IF-BPST were comparable with those obtained by response surface methodology. Our work revealed that the NBT/PMS assay with some modifications can be used to measure the activity of LDH-B and other dehydrogenases in a high-throughput screening format at the early stages of drug discovery. LDH-B containing lysates cannot be assayed directly, however, due to the sensitivity of the method toward detergents. Thus, we suggest precipitating the proteins in the lysates to remove the interfering detergents, and then to dissolve the protein pellet in a suitable buffer and carry out the assay.
Keywords
Introduction
Lactate dehydrogenase (LDH) is a member of the 2-hydroxy acid oxidoreductases family and catalyzes the interconversion of pyruvate and lactate, coupled with the regeneration of NADH to NAD+ (and vice versa). 1 LDH is a tetrameric enzyme complex composed of two distinct isoforms, LDH-A (M isoform) and LDH-B (H isoform), that are mainly expressed in the skeletal muscle and heart muscle, respectively. 2 Both isoforms are found intracellularly in the cytosol, plasma membrane, and mitochondrial compartment. 3 In muscle or liver, most of the LDH is composed of four LDH-A subunits, while in the heart and brain, it is mainly composed of four LDH-B subunits. 4 In other tissues, LDH is composed of both LDH-A and LDH-B, and overall LDH tetramers form five isoenzymes that vary in their (i) ratio of LDH-A and LDH-B subunits [i.e., LDH-1 (4H), LDH-2 (3H1M), LDH-3 (2H2M), LDH-4 (1H3M), and LDH-5 (4M)], and (ii) tissue distribution. 2 LDH-A has a higher affinity to pyruvate (it converts pyruvate to lactate via oxidation of NADH to NAD+), while LDH-B exhibits a higher affinity to lactate (it converts lactate to pyruvate via reduction of NAD+ to NADH).1,5 Moreover, it has been demonstrated that LDH-B activity is strongly inhibited by elevated concentrations of pyruvate (substrate–inhibition effect). 6
Under normal physiological conditions, cells use mitochondrial oxidative phosphorylation to generate the energy that is required for cellular processes, and therefore pyruvate (the final product of glycolysis) is transferred into mitochondria, where it is converted to acetyl-CoA, and then enters the Krebs cycle. Cancer cells, however, through reprogramming of their metabolism use anaerobic glycolysis to produce energy, and the majority of pyruvate is converted to lactate by LDΗ-Α in the cytoplasm. 7 This phenomenon is known as the Warburg effect 8 and provides sufficient precursors and energy for infinite proliferation.
Formerly, it was believed that glycolysis is facilitated by the upregulation of LDH-A and downregulation of LDH-B, and this model explains the metabolic alterations in several cancers, including pancreatic, 9 liver, 10 and brain 1 cancers. But the upregulation of LDH-B has been observed in certain cancer genotypes, including colon,6,10 breast, 11 and lung 12 cancers as well as in testicular germ cell tumors. 12 Moreover, LDH-B and other enzymes related to glycolysis are upregulated in basal-like/triple-negative breast cancers, indicating that this type of cancers is distinctly glycolytic. 11 LDH-B expression has been used as a marker to evaluate the efficiency of neoadjuvant chemotherapy. 13 Elevated LDH-B levels have also been identified in lung cancer cell lines that are characterized by RAS pathway activation. 14 It has been recently suggested that LDH-B expression can be correlated with tumor progression 15 and the clinical stage of lung cancer. 16 It has also been demonstrated that LDH-B regulates the lysosomal activity and autophagy in cancers, and by inhibiting LDH-B activity a targeted inhibition of cancer cells growth was achieved, compared to the normal (control) cells. 17 Despite the fact that the vital role of LDH-B in the development of various cancers has been increasingly reported,6,12,17,18 how LDH-B functions in these types of cancer is not well understood, the association of LDH-B with cancers is more complicated than originally believed, 4 and the regulation of LDH-B expression is not well established. 14
Therefore, targeting LDH-B has been considered as a therapeutic strategy for patients with lung cancer who specifically overexpress LDH-B. 12 Overall, the efficacy of anticancer agents that target LDH-A, LDH-B, or both will possibly differ by cancer type and metabolic phenotype. 4 Note that even though LDH-B is mainly found in heart muscle, its inhibition would not cause cardiovascular side effects because, according to the National Library of Medicine, 19 LDH-B deficiency does not cause any health issues.
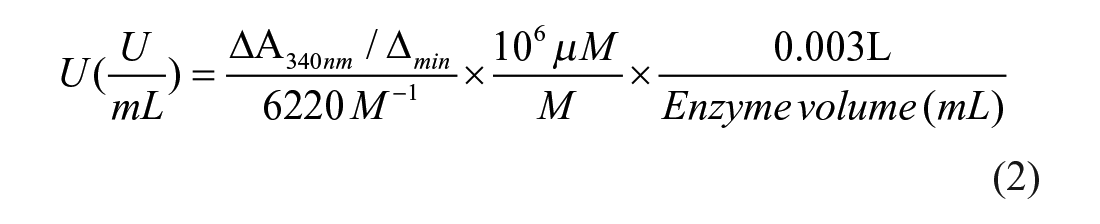
The activity of several dehydrogenases that use NAD+ as a cofactor, including LDH-B, is usually measured by monitoring the formation of NADH at 340 nm. 20 Even though the oxidized form of nicotinamide [NAD(P)+] absorbs weakly in the UV range, its reduced form [NAD(P)H] absorbs light at 340 nm with an extinction coefficient of ~6220 M−1 cm−1. This approach is not suitable, however, for high-throughput screening (HTS) assays aiming to identify hit and lead compounds from chemical libraries. To this end, a colorimetric assay for the determination of dehydrogenases activity using nitroblue tetrazolium (NBT)—which, in the presence of phenazine methosulfate (PMS), reacts with the NAD(P)H (that is released by dehydrogenases) to produce a blue-purple formazan—has been proposed. 21 This reaction has been successfully used in several assays to determine the activity of various dehydrogenases, 21 while a version of this assay for the determination of 6-phosphogluconate dehydrogenase activity in crude lysates of bacterial cells in a 96-well plate format has been reported. 22 It has also been proposed that the NBT/PMS assay has the potential for HTS of several dehydrogenases. 23 Moreover, NBT/PMS-based assays have been successfully used for the determination of novel alcohol dehydrogenases (ADH) in a high-throughput format, 24 for the screening of a small library of 6-phosphoglucomutase dehydrogenase variants, 21 as well as to determine the activity of ADH from Drosophila-ADH mutants. 25 Zymogram NBT/PMS-based assays for the determination of ADH and acetaldehyde dehydrogenase (ALDH) have also been developed. 26
Even though NBT/PMS assay kits are commercially available, the effect of some key buffer elements (e.g., DMSO) that are widely used in HTS and the effect of detergents that are commonly added in cell lysis buffers on the formation of the blue-purple formazan have not been examined. In addition, Tris-HCl (pH 8.0) has become the buffer of choice for the NBT/PMS-based assays for the determination of dehydrogenases activity; 22 however, the effect of buffer composition and pH, salt concentration, incubation time, and the like on the formation of the formazan has not also been investigated. The determination of optimum assay conditions as well as experiments aiming to examine the effects of various factors on the activity of the target enzyme are usually carried out using the ineffective and time-consuming one-factor-at-a-time (OFAT) approach. In contrast, statistical design of experiment (DoE) approaches provide information on variable interactions that cannot be obtained by the trial-and-error approaches, and they have been successfully used for the optimization of several assays (see Ref. 27 and references cited therein). The theory and potential applications of DoE approaches are extensively described in many excellent textbooks28,29 (for a review on the topic, see Ref. 30 ) and therefore will not be discussed here. Despite the obvious advantages of DoE approaches over OFAT design, however, the development and optimization of biological assays are usually performed using the latter method. To this end, several DoE software packages, including Design Expert (Stat-Ease Inc., Minneapolis, MN), JMP (SAS Institute Inc., Cary, NC), Minitab (Minitab, University Park, PA), and ECHIP (ECHIP, Wilmington, DE), are available to facilitate the choice of the DoE, the design of the experiments, and to interpret the results. Even though a lot of experimenters believe that statistically designed experiments are difficult to use,27,30 these DoE software packages require only basic knowledge of statistics and can help a DoE novice during the design of experimental assay conditions and interpretation of the results. 30
Herein, we report the optimization of an NBT/PMS-based colorimetric assay for the determination of LDH-B activity using DoE approaches. The potential of the assay to be used with enzymes in crude cell lysates was also examined. To this end, we examine for the first time the effects of (i) assay buffer composition and pH, (ii) buffer additives commonly used in HTS assays (e.g., NaCl and DMSO), and (iii) detergents (e.g., Triton-X100 and Tween-20) that are commonly used in lysis buffers on both the formation of the blue-purple formazan and LDH-B activity. Importantly, the effect of various assay conditions on LDH-B activity was assessed by using both the NBT/PMS colorimetric assay and the spectrophotometric method at 340 nm. To the best of our knowledge, this is the first study suggesting the use of the NBT/PMS assay for the determination of LDH-B activity in an HTS format.
Materials and Methods
Materials
Recombinant human LDH-B was obtained from R&D Systems (Minneapolis, MN). NBT and PMS were purchased from Sigma-Aldrich (St. Louis, MO), while NADH and NAD+ were obtained from Boehringer (Ingelheim, Germany). All other reagents were obtained from Sigma-Aldrich.
LDH-B Colorimetric Assay in a 96-Well Plate Format
NBT stock solution (30.5 mM) was prepared in 70% v/v dimethylformamide (DMF), while the PMS stock solution (30 mM) was prepared in distilled water. Both solutions are stable for approximately one year when they are stored at 4 °C and protected from light. The following reagents were freshly prepared and stored at 4 °C in the dark:
i Reaction buffer: The reagent consists of one of the buffers described within the text supplemented with 300 µM ΝΒΤ, 30 µM PMS, and 0.13% gelatin to prevent the precipitation of formazan. 21 After its preparation, it should be used within 30 min. It is noted that the assay buffer was optimized by a DoE approach, including testing different buffers of several pH values containing various NaCl concentrations.
ii Substrate mix: This solution is composed of 10 mM NAD+ and 250 mM sodium lactate in one of the tested buffers. The solution should be used promptly.
iii NADH solution: This solution is composed of 1.25 mM NADH in distilled water. The solution should be used promptly; otherwise, it should be stored at −20 °C (or lower).
All reaction mixtures were directly prepared in the wells of a 96-microtiter plate. Initially, 90 µL of reaction buffer was added in each well, and subsequently 10 µL of substrate mix was added. The plate was incubated for 30 sec at 25 °C in the dark, and the absorbance was measured at 570 nm in a microplate reader (PerkinElmer, Waltham, MA)
Two-level fractional factorial design for the identification of factors that have a significant impact on lactate dehydrogenase B (LDH-B) activity.
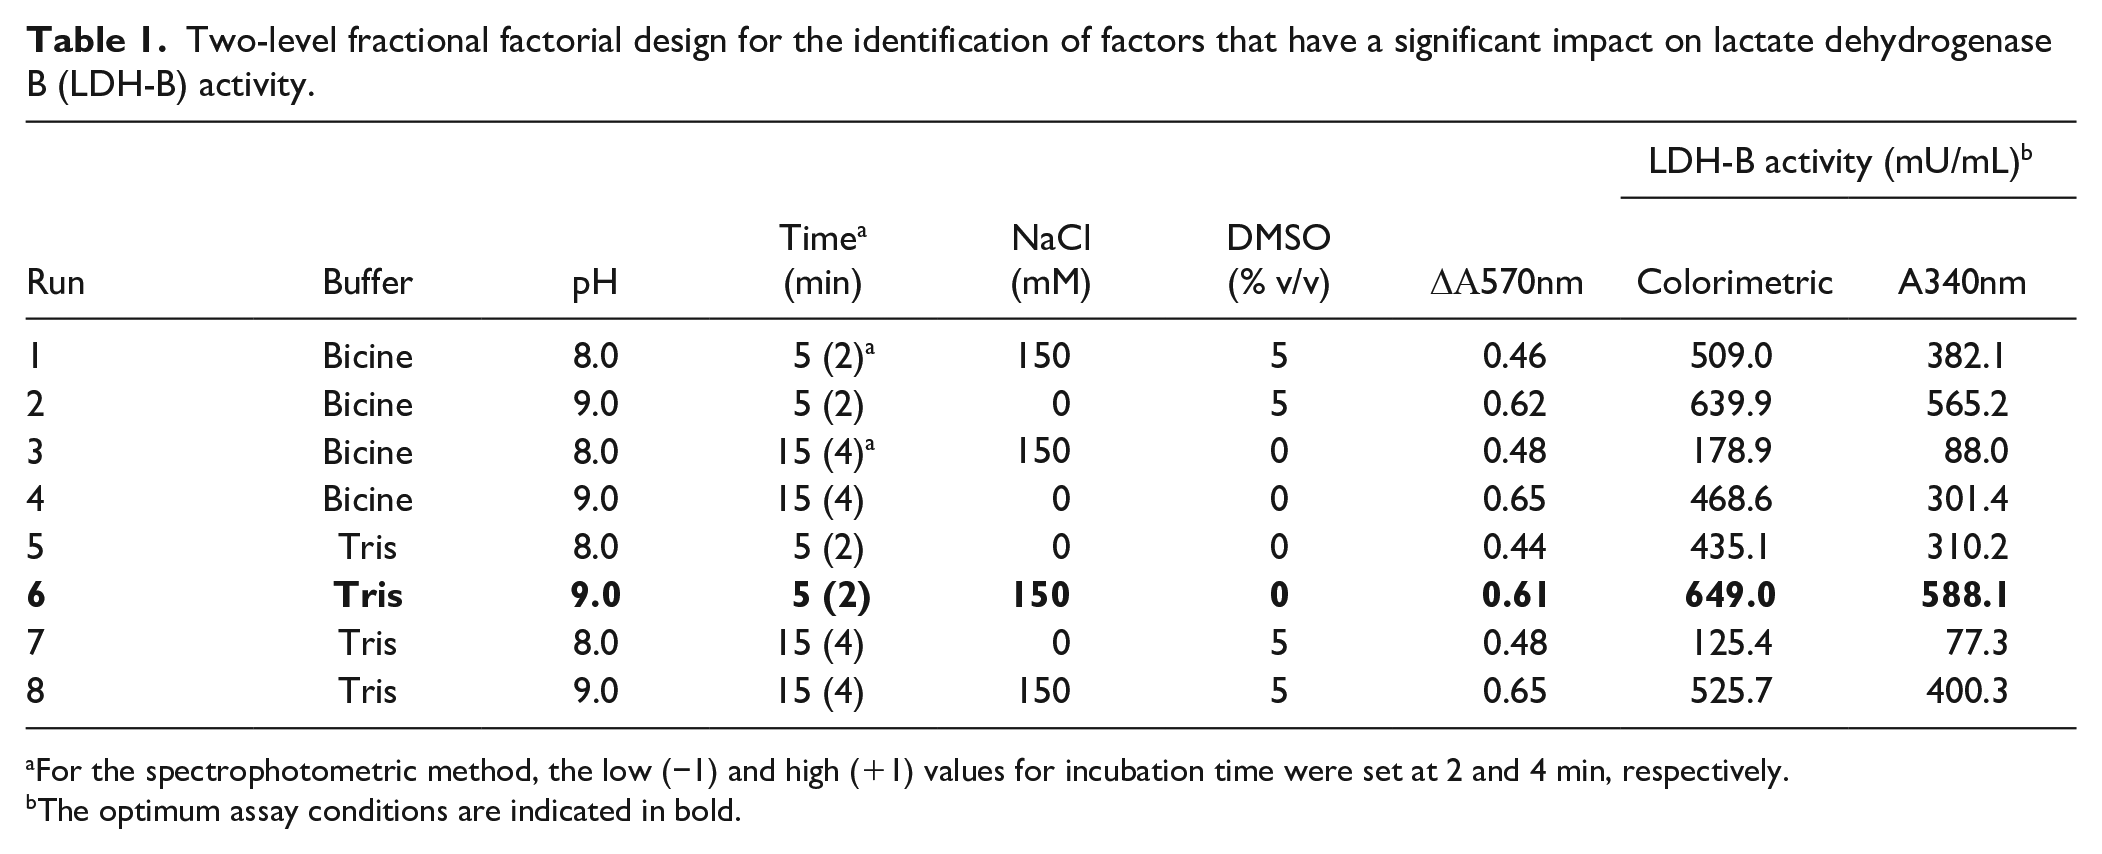
For the spectrophotometric method, the low (−1) and high (+1) values for incubation time were set at 2 and 4 min, respectively.
The optimum assay conditions are indicated in bold.
Box–Behnken design with actual and predicted responses for lactate dehydrogenase B (LDH-B) activity.
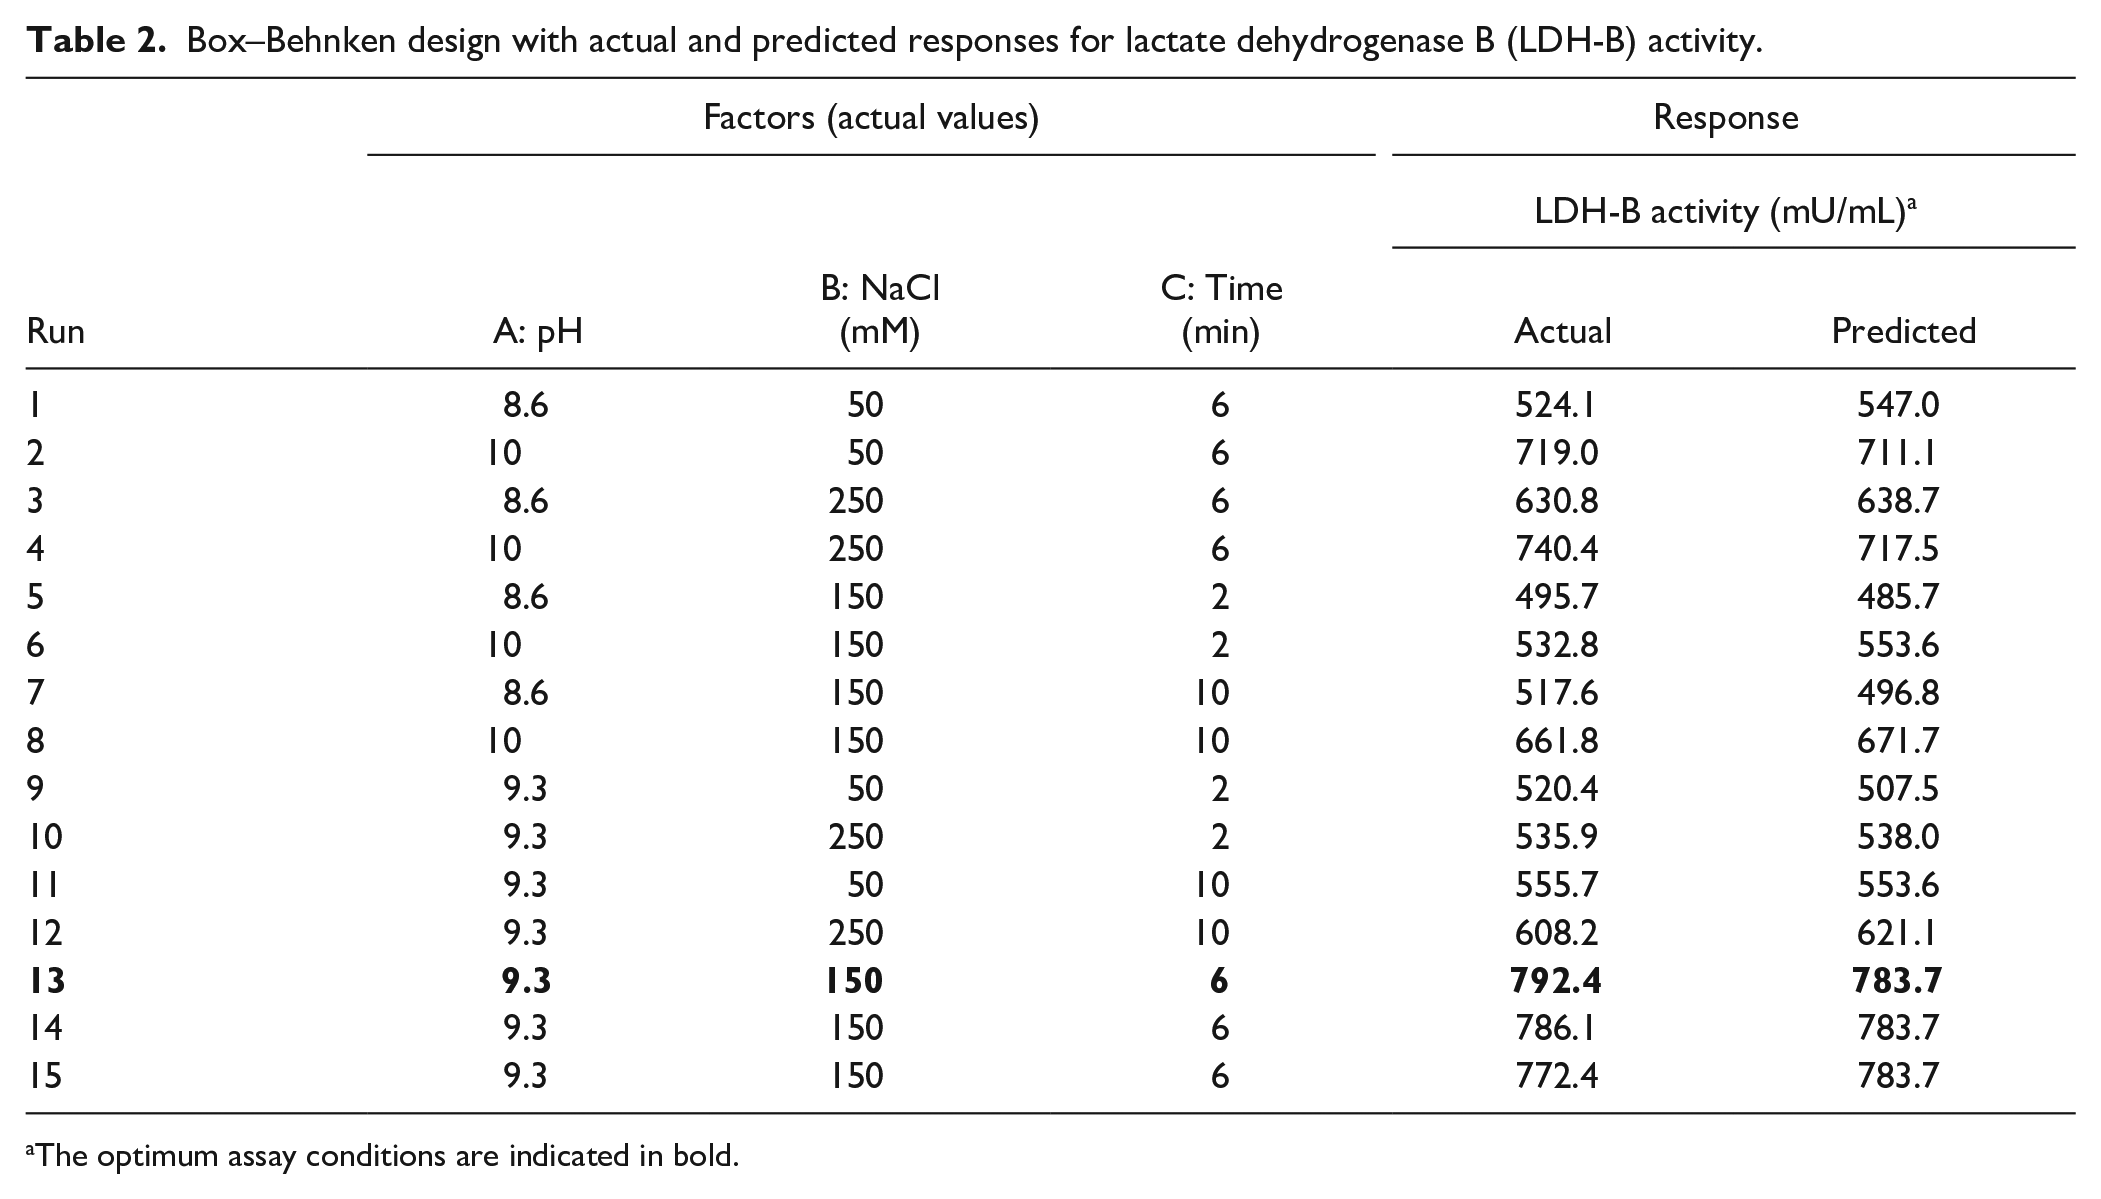
The optimum assay conditions are indicated in bold.
Incomplete factorial approach for the optimization of lactate dehydrogenase B (LDH-B) assay conditions.
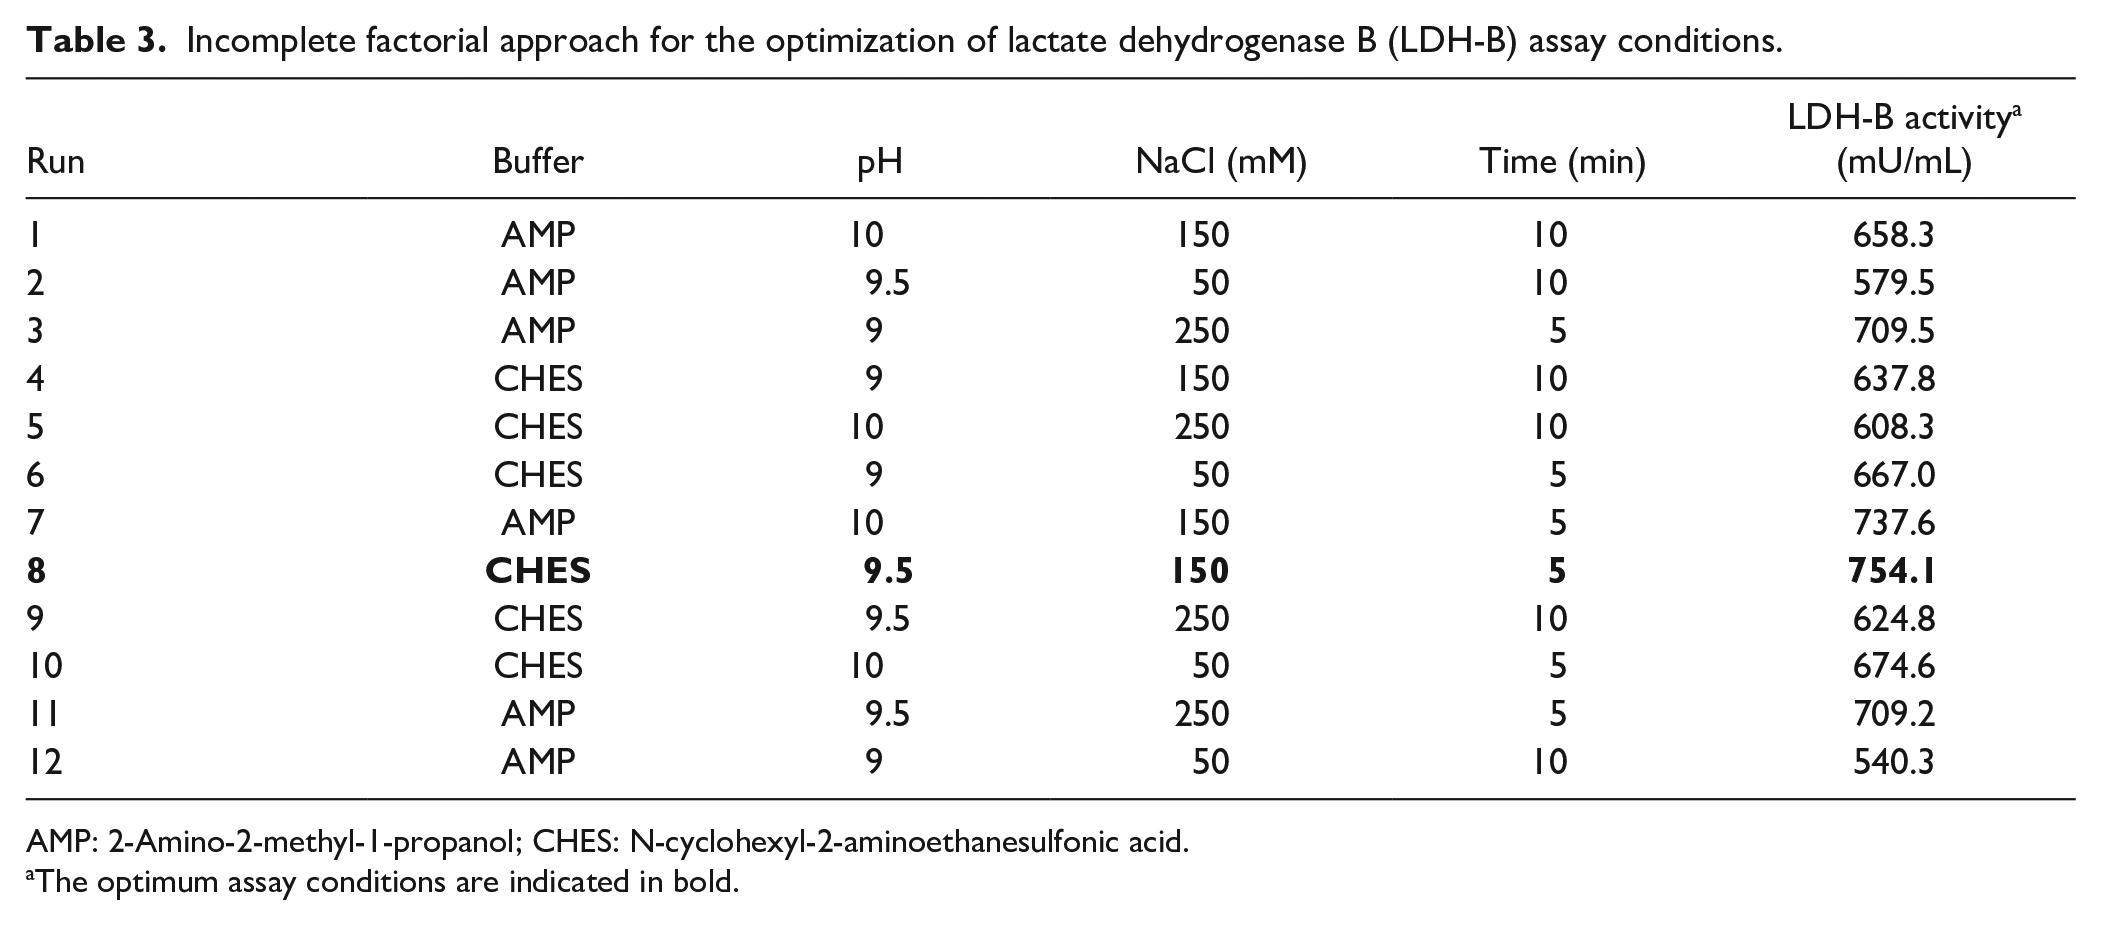
AMP: 2-Amino-2-methyl-1-propanol; CHES: N-cyclohexyl-2-aminoethanesulfonic acid.
The optimum assay conditions are indicated in bold.
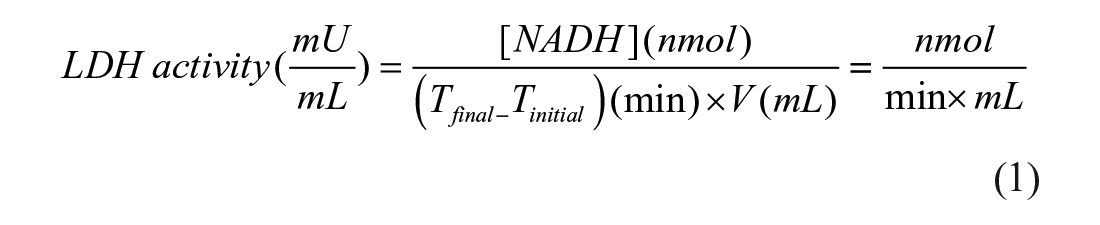
where [NADH] is the amount of NADH that is released between Tfinal and Tinitial; and V is the sample volume (LDH-B) added in each well of the 96-well plate.
Different calibration curves were obtained using NADH between 0 and 15 nmol in all the reaction buffers that were tested in a final volume of 100 µL in the wells of a 96-well microplate. The plate was incubated for 2 min at room temperature, and the sample absorbance values at 570 nm were measured in a microplate reader (PerkinElmer).
The effect of detergents commonly used in lysis buffers [i.e., Triton X100, Tween 20, Nonidet P-40 (NP-40), and sodium dodecyl sulfate (SDS)] on the formation of the blue-purple color was determined by testing three different concentrations (0.01%, 0.05%, and 0.1%) in the assay mixture (discussed further below).
LDH-B Assay in a Cuvette Format
To confirm our observations using the colorimetric assay, we determined LDH-B activity by measuring changes in absorbance at 340 nm due to NAD+ reduction (NADH formation) as previously described 31 with slight modifications. Briefly, the assay mixture was composed of 2 mL of one of the tested reaction buffers as indicated in the Results section, 0.5 mL of 6 mM NAD+, and 0.5 mL of 150 mM sodium lactate. The reaction was initiated with the addition of LDH-B (0.15 µM, final concentration). Samples were mixed and immediately loaded into a Jasco V-530 UV-Visible Spectrophotometer (Jasco, Easton, MD). Absorbance was recorded every 10 sec for a total of either 120 sec or 240 sec, and the change in absorbance (ΔA340) was determined. In the absence of LDH-B, ΔA340/min was negligible after 4 min. LDH activity was determined using an extinction coefficient for NADH equal to 6220 M−1 cm−1. LDH-B activity was determined using Equation (2):
Optimization of LDH Assay Conditions
The software Design Expert v. 7 (Stat-ease Inc.) was used to design the DoE experiments, interpret the results, perform the statistical analysis of the results, and construct the three-dimensional response surface plots.
Screening Experiments
To determine the effects of buffer additives (detergents) on the development of the blue-purple formazan using NADH in the absence of LDH-B, we made comparisons using raw absorbance data. Briefly, all reaction mixtures were directly prepared in the wells of a 96-microtiter plate. Initially, 95 µL of reaction buffer (50 mM Tris-HCl, pH 8.0 supplement with 300 µM ΝΒΤ, 30 µM PMS, and 0.13% gelatin) containing 0.01%, 0.05%, or 0.1% of one of the following detergents—SDS, Triton X-100, Tween-20, or NP-40—was added in each well. The plate was incubated for 30 sec at 25 °C in the dark, and the absorbance was measured at 570 nm
Subsequently, the effects of one categorical factor [i.e., buffer composition (50 mM Tris-HCl or bicine)] and four continuous factors (the pH value of the reaction buffer, the reaction time, and the concentrations of NaCl and DMSO in the reaction mixture) were initially evaluated using an 8-run–
Box–Behnken Design
Based on our screening experiment, three variables (the pH value of the reaction mixture, the reaction time, and the concentration of NaCl) showed a statistically significant effect on LDH-B activity (see Results). Therefore, these factors were evaluated further in a 15-run Box–Behnken design (BBD), and all factors were tested at three levels [low (−1), central (0), and high (+)] as follows: pH: 8.6, 9.3, and 10, NaCl: 50, 150, and 250 mM; and incubation time: 2, 6, and 10 min. The design matrix composed of 15 independent trials as well as the experimental and predicted values are illustrated in Table 2 . Experiments were carried out in triplicate in 50 mM N-cyclohexyl-2-aminoethanesulfonic acid (CHES) buffer of various pH values (Table 2).
Data were fitted in a second-order equation using the Design Expert software. An analysis of variance (ANOVA) test was used to evaluate both the impact of variables on LDH-B activity and the quality of the model, while a p-value less than 0.05 was considered as statistically significant. The quality of the mathematical model was initially assessed by using the R2 value, the “adjusted-R2” value, and the “lack-of-fit” test. The closer the R2 is to 1, the better the fit of experimental data is to the mathematical model. The adjusted R2 value shows the suitability of the design and increases with the addition of independent variables that are significant to the response (dependent variable). If nonsignificant variables are included in the mathematical model, then the adjusted R2 value decreases, contrary to the R2 value that increases with the addition of new variables regardless of their significance. In general, the smaller the gap between R2 and adjusted R2, the better, and it should not be higher than 0.2. 29 The “lack-of-fit” also shows whether the mathematical model fits the data well and should be insignificant (p > 0.05). The adequacy of the mathematical model was also evaluated using the normal (%) probability plot of the “Studentized” residuals, which evaluates the distribution of data, and the “predicted versus actual” plot, which shows whether the experimental data (actual values) are in agreement with the predicted (by the mathematical model) values. The significance of factors on LDH-B activity was assessed using the ANOVA F tests (F = variation between sample means/variation within the samples) as previously described.32,33 The importance of the F-value shows the significance of a variable alone or in interaction with other variables. The higher the F-value, the more significant a factor is. 34 The theory and mathematical description of ANOVAs have been extensively described elsewhere32,35 and therefore will not be discussed here.
Optimization of LDH-B Assay Conditions Using an Incomplete Factorial Approach
Optimization of conditions for LDH-B activity was also carried out using an incomplete factorial (IF) design composed of 12 combinations of, two buffers [50 mM CHES and 150 mM 2-amino-2-methyl-1-propanol (AMP)], three buffer pH values (9, 9.5, and 10), three NaCl concentrations (50, 150, and 250 mM), and two incubation times (5 and 10 min), which we called IF-BPST (Buffer/pH/Salt/Time). The experimental conditions and results are summarized in Table 3 .
Kinetic Studies
Determination of the kinetic parameters Michaelis–Menten constant (KM) and maximum velocity (Vmax) before and after optimization of the assay conditions for LDH-B, as described in the Results, was carried out using 0.15 µM LDH with increasing concentrations of (i) NAD+ (0–1200 µM) in the presence of 25 mM sodium lactate or (ii) sodium lactate (0–50 mM) using 1.2 mM of NAD+. All experiments were carried out in triplicate. The kinetic parameters KM and Vmax were calculated by fitting the data by nonlinear regression to the classical Michaelis–Menten steady-state model (Eq. 3) using the GraphPad Prism v. 7.0 software (GraphPad, San Diego, CA):

where vo is the initial velocity (nmol/mL/min), Vmax is the maximum reaction velocity (nmol/mL/min), and S is the substrate concentration (µM). The turnover number (kcat) was calculated assuming a molecular mass of 140 kDa.
Determination of the Z′-Factor and Signal-to-Noise Ratio
The statistical parameter Z-prime (Z′) was used to assess the quality of the optimized assay. 27 The Z′-factor was calculated based on Equation (4):

where σ p and σ c are the standard deviations of the positive and negative controls (n = 10 per experiment), respectively; and µ p and µ n are their respective means.
The assay was performed in a final solution of 100 µL using 0.15 µM LDH, 1 mM NAD+, and 25 mM sodium lactate (final concentrations) either in the previously described assay conditions (50 mM Tris-HCl, pH 8.0, at 25 °C for 5 min) or in the optimized conditions as described in the Results. Negative controls contained assay buffer in place of the enzyme.
The signal-to-noise ratio (S/N) was determined by dividing the mean of the positive signal from reactions containing LDH-B by the mean of the negative controls containing buffer in the place of the enzyme.
Results
The activity of several dehydrogenases is commonly measured by following the rate of NAD(P)H formation (or disappearance) at 340 nm; however, this approach cannot be used for the development of HTS assays using cell lysates because they have a moderate absorbance at 340 nm. 22 To this end, the NBT/PMS assay has been proposed as an alternative approach for the determination of various dehydrogenases in a 96-well plate format. 23
Similar to other dehydrogenases, LDH-B reduces NAD+ to NADH (during the conversion of lactate to pyruvate), and NADH reacts with NBT in the presence of PMS, resulting in the formation of a blue-purple formazan that when scanned spectrophotometrically in the range of 450–800 nm exhibits a maximum absorption at ~570 nm (data not shown). For the colorimetric assay, we used the NBT and PMS concentration proposed by Mayer and Arnold 22 (i.e., 300 µM and 30 µM, respectively); while when we used LDH and NAD+ to a final concentration of 0.15 µM and 1 mM, respectively, the assay was linear for more than 5 min. Importantly, precipitation of the blue-purple formazan was not observed, while the intensity of the blue-purple color was time-dependent and linear with the concentration (data not shown). Our preliminary results also revealed that the optimum reaction temperature is 25 °C because at higher temperatures (30 °C and higher), the rate of the blue-purple color development was too fast (<1 min) (data not shown). It has also been demonstrated that results at 37 °C are not as reliable as those at 25 °C. 36
To test whether any of the reaction mixture components have an impact on LDH-B activity, we tested each of them separately and in various combinations using 1 mM NAD+ and 25 mM sodium lactate (final concentrations). When the LDH-B activity was measured using the spectrophotometric method at 340 nm, we observed that the addition of PMS, NBT, or both did not affect the enzyme activity.
The most widely used buffer in the NBT/PMS assay for the determination of dehydrogenases activity is 50 mM Tris-HCl buffer, pH 8.0;21,37 and when we performed the assay using this buffer following incubation of the reaction mixture at 25 °C for 5 min, the activity of LDH-B was determined to be 452.5 ± 31.4 mU/mL. When we run the assay using these assay conditions, the kinetic parameters KM, Vmax, and kcat were found to be equal to (i) for NAD+: 376.3 ± 22.3 µM, 881.2 ± 44.2 nmol/min/mL, and 32.6×10⁻³ s–1, respectively; and (ii) for lactate: 23.3 ± 1.23 mM, 891.0 ± 37.5 nmol/min/mL, and 32.9 ×10⁻³ s–1; a Z′ factor of 0.75 and an S/N of 16.8 were obtained. In our laboratory, we have recently developed a DoE-based screening and optimization approach 27 to identify the best assay conditions of the human rhinovirus 3C protease (HRV-3CP). Therefore, in this study, we subsequently carried out a similar approach to examine whether alteration of assay conditions could improve the activity of LDH-B, as described in the following sections.
Optimization of Assay Conditions to Determine LDH Activity
Screening experiments
When developing an enzyme assay, the choice of enzyme and substrate form is critical, while there are other key elements (co-factors, additives, and detergents) that are essential to develop a high-quality assay. Some key elements including DMSO (all compounds are stored in DMSO), detergents, and salts cannot be avoided in HTS, and their presence may affect the results, especially in colorimetric assays focusing on the signal window as the primary measure of success. The results in colorimetric assays are evaluated based on the development of a color product. Thus, it is essential to develop an assay that can accommodate all of the key additives. In our case, if any of the additives affect the development of the blue-purple color, they could lead to false-positive or -negative results.
Therefore, before the optimization of assay conditions using DoE, we evaluated the color interference from the detergents that are commonly added to lysis buffers [e.g., radioimmunoprecipitation assay (RIPA) buffer], including SDS, Tween-20, Triton X-100, and NP-40, at final concentrations of 0.01%, 0.05%, or 0.1%. Experiments were carried using 6.25 µM NADH in the absence of LDH-B, as described in the Screening Experiments section earlier. It should be noted that we wanted to evaluate whether the assay is suitable for detecting LDH-B activity in cell lysates that are obtained using detergent-based lysis buffers. The results revealed that the presence of all detergents (SDS, Triton X-100, Tween-20, and NP-40) at all tested concentrations have a significant effect on the formation of the blue-purple formazan. In detail, when one of the non-ionic detergents (Triton X-100, Tween 20, or NP-40) was added to the reaction mixture, a two- to threefold increase of the absorbance at 570 nm was observed compared to the control sample that did not contain detergent. Moreover, the presence of SDS even at the lowest tested concentration (0.01%) inhibited the formation of the blue-purple color (data not shown).
Subsequently, a two-level fractional factorial design was used to evaluate how five important assay factors could affect the activity of LDH-B. In detail, the effects of five factors [i.e., buffer composition (Tris-HCl and bicine), pH (8 and 9), incubation time (5 and 15 min), NaCl concentration (0 and 150 mM), and DMSO concentration (0 and 5%)] on LDH-B activity were assessed using a
Initially, we assessed the effect of the five aforementioned factors on the development of the blue-purple formazan in the absence of LDH-B; in other words, the reaction mixtures contained only the buffer, substrate mix, NBT/PMS, and different concentrations of NaCl and DMSO, while the reaction mixtures were incubated at different times at 25 °C, as summarized in Table 1. The impact of the five factors on the development of the blue-purple product was assessed by comparing the absorbance intensity values at 570 nm (Table 1). The statistical significance of each variable of the five aforementioned factors on color development and LDH-B activity was assessed using two graphical tools (i.e., the half-normal plot and Pareto chart) (Fig. 1) (see Ref. 27 and references cited therein). In a half-normal plot, all significant factors are away from zero, while the nonsignificant (unimportant) factors have a normal distribution centered close to zero. Pareto plots rank the significance of factors based on the t-value of the effect at two limit lines (i.e., the Bonferroni limit line and the t limit line). If a factor has a t-value higher than the Bonferroni line, then it is considered as a “true significant,” whereas a factor that has a t-value between the Bonferroni line and t limit line is possibly significant. Factors that have t-values of effect lower than the t-limit line are unimportant (statistically insignificant) and should be excluded from the study.
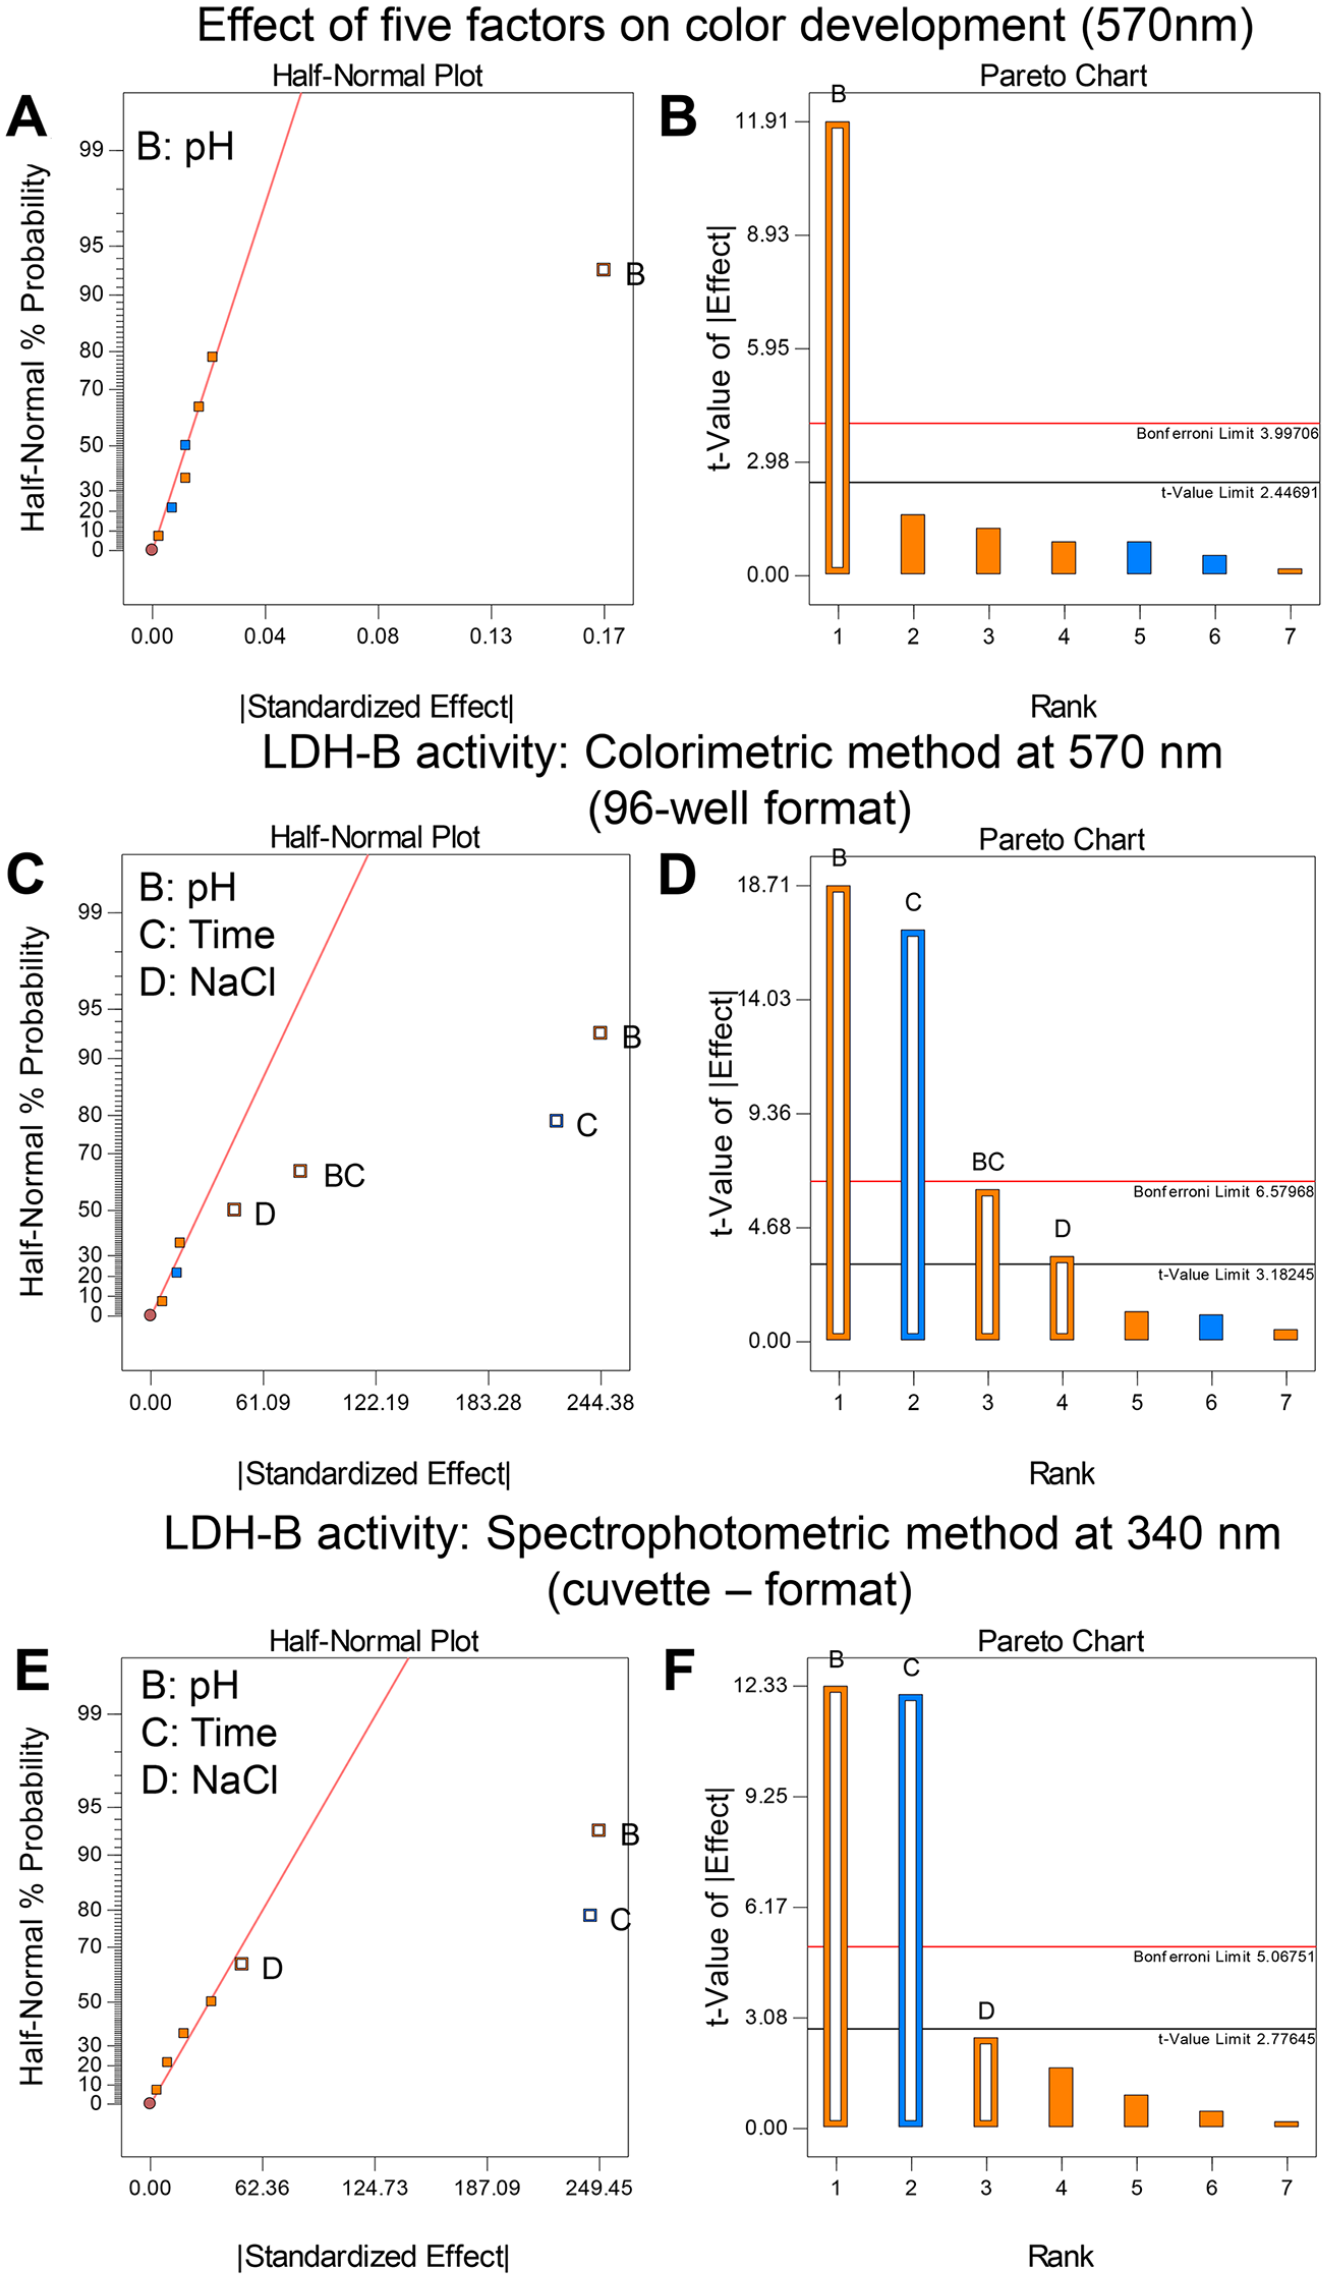
Identification of the factors with a statistically significant effect on the development of the blue-purple color and the activity of lactate dehydrogenase B (LDH-B) using the half-normal plot (
Both the half-normal plot (
Response Surface Methodology
The Box–Behnken design (BBD) is one of the most widely used RSM designs; it estimates the value of the response at intermediate levels that were not experimentally studied. In this study, a 15-run three-level BBD containing three replicates at the center points was used ( Table 2 ). Based on our preliminary experiments, buffer composition does not have an impact on LDH-B activity, while the pH value of the reaction mixture should be ≥8.5. Thus, the 15 experimental runs of the BBD were carried out in 50 mM CHES buffer of different pH values ( Table 2 ; the pH range of CHES buffer is 8.6 to 10). Our preliminary results revealed that the CHES buffer does not affect the development of the blue-purple color (data not shown). The 15 different combinations (experimental runs) of the factors used in this study and the LDH-B activity values that were (i) calculated experimentally (actual values) and (ii) predicted by the mathematical model (discussed further below) are illustrated in Table 2 .
The data (LDH-B activity) obtained under the 15 different conditions were fitted to a second-order response surface model that describes the factors and the interactions between them, and the following equation (Eq. 5; in coded form) was obtained:
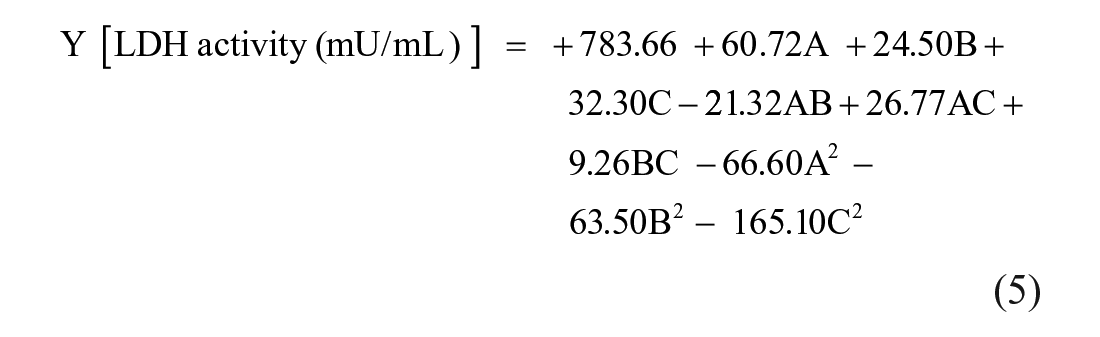
where Y is the response (i.e., LDH-B activity); and A, B, and C are the coded values of pH, incubation time, and NaCl concentration, respectively.
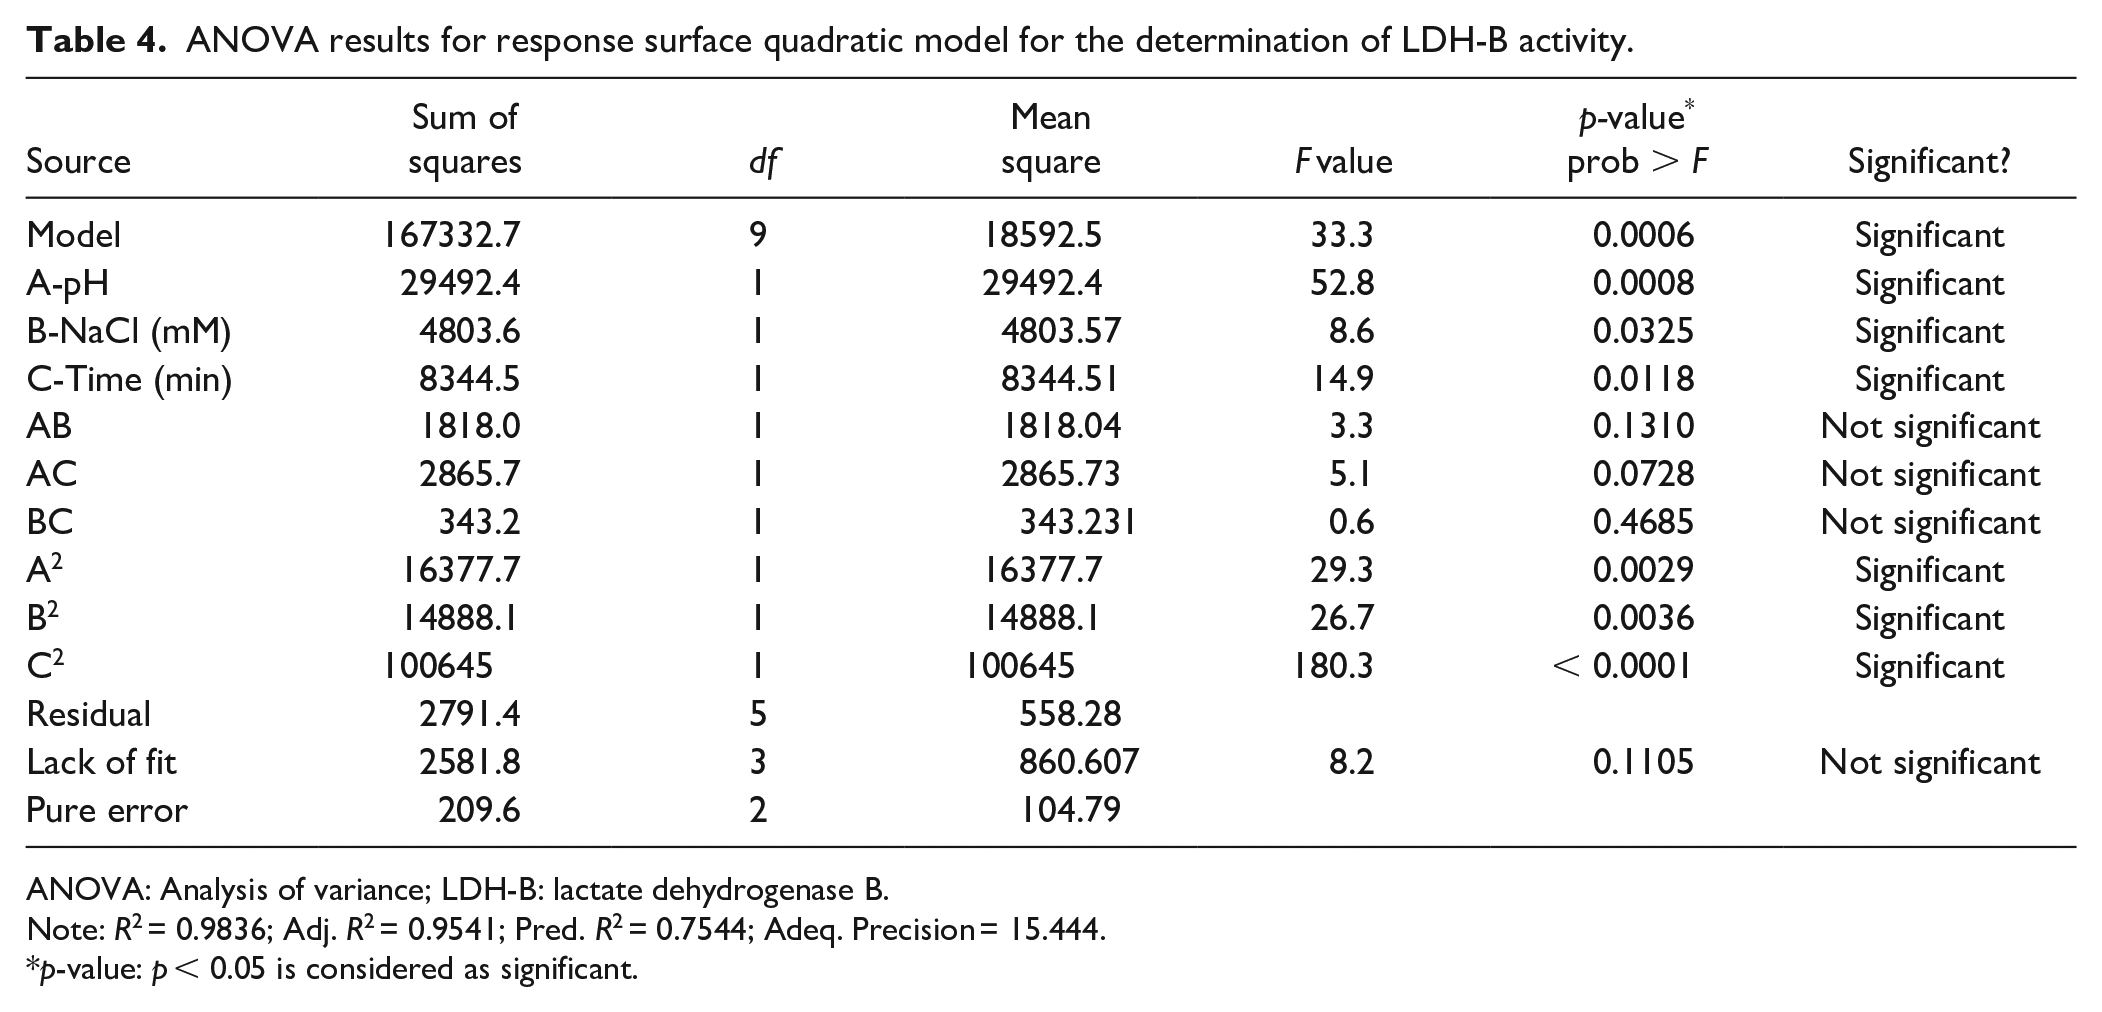
The mathematical model capability was initially assessed using the Fisher
ANOVA results for response surface quadratic model for the determination of LDH-B activity.
ANOVA: Analysis of variance; LDH-B: lactate dehydrogenase B.
Note: R2 = 0.9836; Adj. R2 = 0.9541; Pred. R2 = 0.7544; Adeq. Precision = 15.444.
p-value: p < 0.05 is considered as significant.
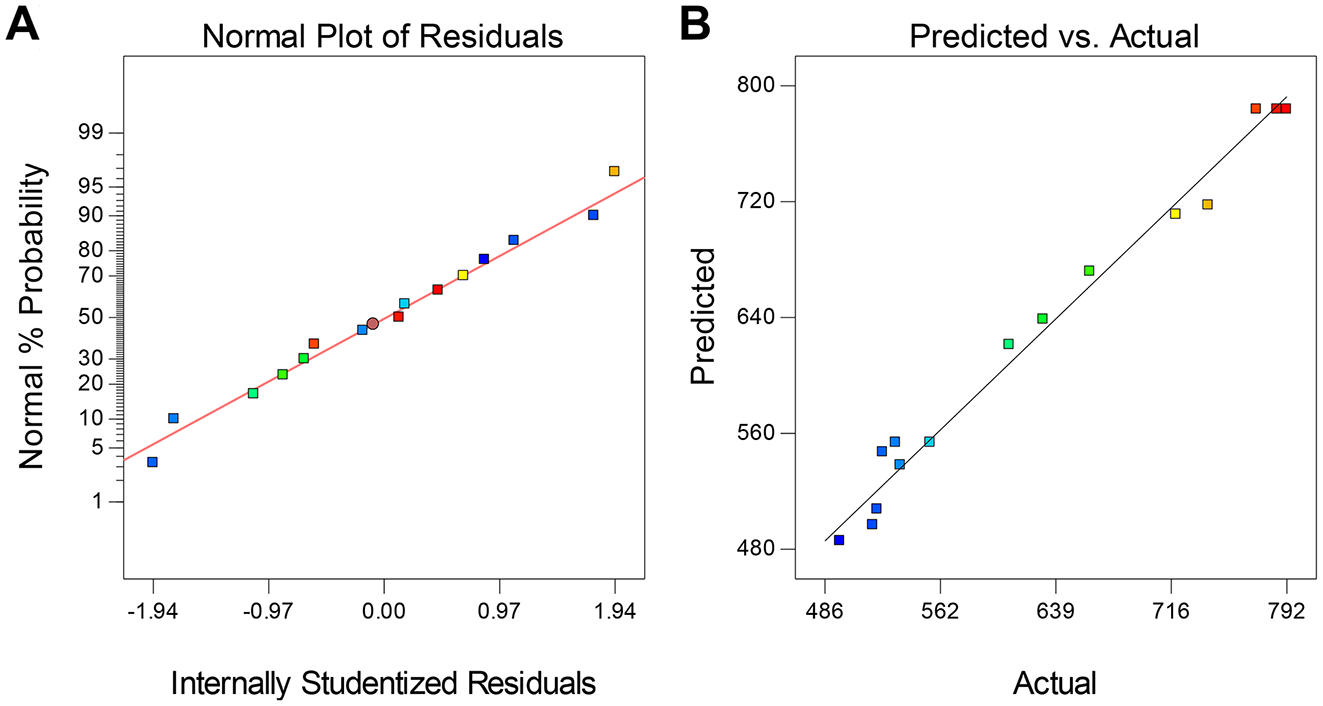
Diagnostic plots for the evaluation of the accuracy of the second-order mathematical model for lactate dehydrogenase B (LDH-B) activity. (
Design Expert software was used to create the response surface plots by setting each time as one variable of the model at its central (zero) point (e.g., for pH, time, and NaCl concentration, the central points are 9.3, 6 min, and 250 mM, respectively) and varying the values of the other two variables within the experimental region (domain). Thus, it was possible to estimate (predict) the activity of LDH-B (response) for any possible combination of two factors that are tested within the experimental region, even for those that have not been examined experimentally, and the results are presented in 3D surface plots (
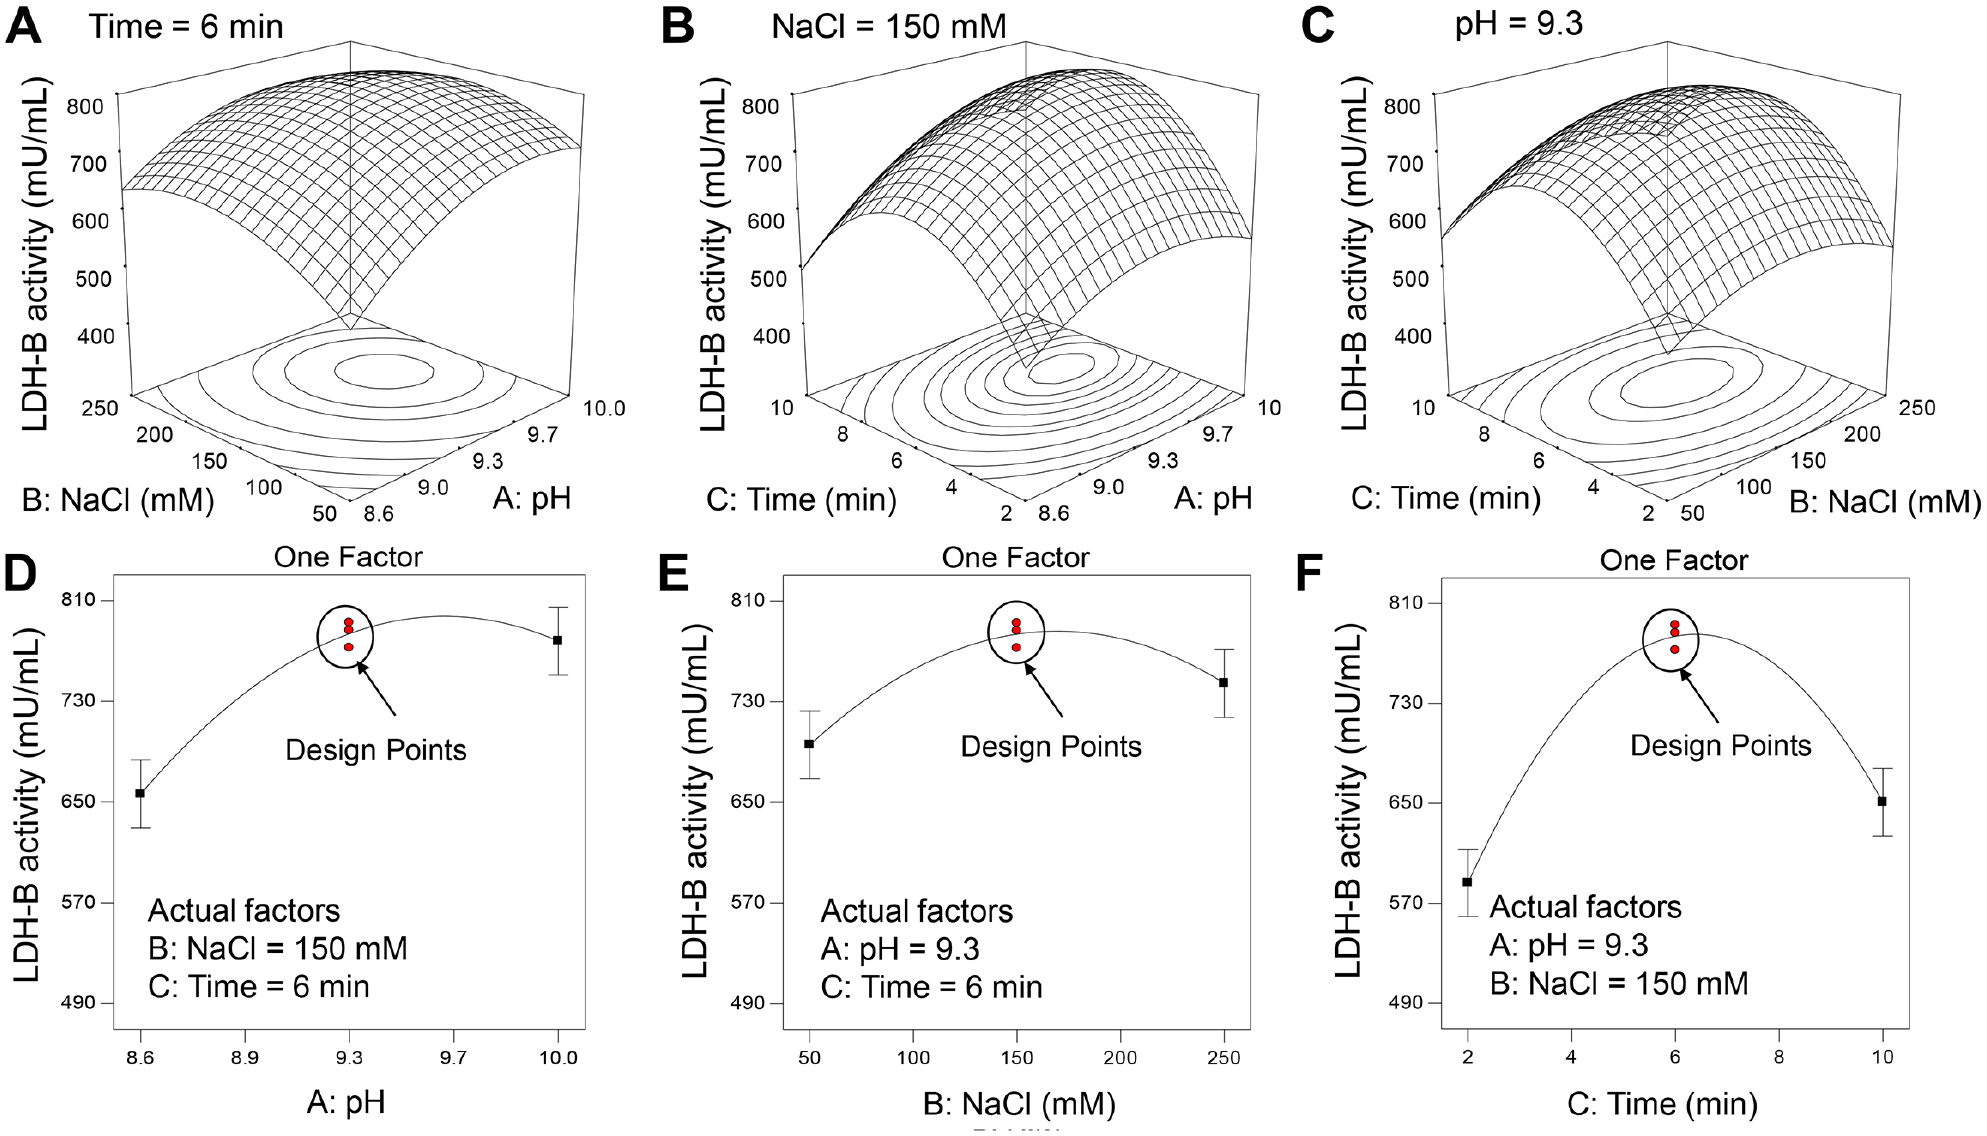
(
Subsequently, we performed a numerical optimization of the assay condition of LDH-B, 41 and a maximum activity of 801 mU/mL was predicted at the following conditions: pH value 9.6, reaction time equal to 6.5 min, and NaCl concentration of 150 mM. These assay conditions were examined experimentally, and an LDH-B activity of 793.2 ± 20.6 mU/mL was recorded that is close to the predicted one, while under these assay conditions, the kinetic parameters KM, Vmax, and kcat were found to be equal to, respectively, (i) for NAD+: 302.9 ± 20.7 µM, 1025 ± 52.6 nmol/mL/min, and 37.9 ×10⁻³ s−1; and (ii) for sodium lactate: 19.7 ± 1.1 mM, 1066 ± 52.8 nmol/mL/min, and 39.4 ×10⁻³ s−1. A Z′ factor of 0.84 was obtained, indicating good reproducibility. Moreover, an S/N of 30.5 was calculated, indicating that the optimized assay has a robust window for the determination of potential LDH-B inhibitors in future experiments.
Optimization of LDH-B Assay Conditions Using an Incomplete Factorial Approach
Even though RSM has been widely used for the optimization of several biochemical processes, including enzyme assays (see Ref. 27 and references cited therein), it becomes impractical when more than seven factors must be examined and/or when a large number of categorical factors must be included in the study. 30 Moreover, the numerical experiments used to develop the RSM design must be carefully planned to obtain useful information because even small changes in the input values significantly affect the quality of the mathematical model.
To this end, IF designs, which are developed by removing experimental conditions from a full factorial design, have been introduced to examine the effect of multiple continuous and/or categorical factors at more than two levels. 30 In our laboratory, we have successfully used IF approaches to determine the optimum conditions for the expression and purification of various recombinant proteins.41,42 Thus, in this work, we subsequently examined whether we can develop an IF approach to determine the best conditions to measure the activity of LDH-B. Our proposed method to determine LDH-B activity is composed of three different pH values (9, 9.5, and 10), three NaCl concentrations (50, 150, and 250 mM), and two incubation times (5 and 10 min), and we called the method IF-BPST (incomplete factorial−buffer/pH/salt/time). Overall, we examined 12 different combinations of the aforementioned factors (full factorial 2×3×3×2 = 36) as illustrated in Table 3 that were selected using the Samba freeware (Samba, http://www.igs.cnrs-mrs.fr/samba).
The selection of the experimental conditions is usually based on the experimenter’s experience with similar enzymes and/or published data about the same or a similar enzyme. In this study, the experimental conditions were selected as follows: It has been proposed that the lactate-to-pyruvate reaction catalyzed by LDH-B requires a pH value of ≥8.5, 40 and therefore we decided to determine the activity of the enzyme in the range of 9–10. For comparison purposes, we kept CHES buffer concentration and NaCl concentrations identical to the RSM design, while we introduced AMP as a second buffer because it is considered as a suitable assay buffer for LDH-B. 43 We slightly modified the incubation time of the reaction mixture, because based on our preliminary experiments, an incubation time of more than 4 min was required to achieve an adequate S/N (>10). Also, we kept the reaction volume and temperature identical to RSM (100 µL and 25 °C, respectively). These modifications also helped us to reduce the number of experimental runs.
The highest LDH-B activity (754.1 mU/mL) was obtained in an experiment using 50 mM CHES, pH 9.5, and 150 mM NaCl following incubation for 5 min at 25 °C buffer ( Table 3 , run 8); it was ~1.4 times higher than the lowest activity (540.3 mU/mL) obtained in an experiment using AMP buffer, pH 9.0, after incubation for 10 min at the same temperature ( Table 3 , run 12). It should be noted that even though LDH-B is most regularly assayed in AMP buffer, 43 in this study we chose CHES over AMP as the assay buffer for the determination of LDH-B activity because AMP’s preparation and handling are quite difficult. 40
A comparison between the results obtained by the IF-ΒPST approach and RSM (after applying the point optimization method of Design Expert) revealed that the maximum activity of LDH (754.1 ± 24.3 mU/mL) obtained by IF design was comparable (p > 0.05) with that obtained by RSM (793.2± 20.6 mU/mL). Moreover, under the optimum LDH assay conditions, the kinetic parameters KM, Vmax, and kcat were determined to be as follows: (i) for NAD+: 317.7 ± 15.6 µM, 1049 ± 31.6 nmol/mL/min, and 38.8 × 10⁻³ s−1, respectively; and (ii) for sodium lactate: 20.8 ± 0.9 mM, 1021 ± 47.6 nmol/mL/min, and 37.8 × 10⁻³ s−1, respectively. Also, a Z′ factor of 0.83 and an S/N equal to 29.2 were calculated.
It should be noted, however, that our proposed IF approach can be used only for enzymes for which sufficient information is available, and its applicability when studying newly discovered enzymes is probably limited (see Discussion).
Discussion
Several dehydrogenases are present in tissues of humans, microorganisms, and plants regulating several biochemical processes. Dehydrogenases belong to the class of oxidoreductases that oxidize a substrate by transferring hydrogen to an electron acceptor. Oxidoreductases use either oxidized or reduced forms of nicotinamide as a cofactor, and are usually assayed by monitoring the decrease of increase of absorbance at 340 nm of the reduced form [NAD(P)H]. 44 This approach has several limitations, however: The background absorbance of 96-well plates in the UV range is high, while plates suitable for screening in the UV range are quite expensive, and their cost is prohibitive to large screening experiments. Moreover, even though most clear plastic microtiter plates are suitable to measure at 340 nm, a major problem is that complex samples (e.g., cell lysates) give a high background absorbance. 22 The preferred method to observe an enzyme reaction can be observed by the appearance (or disappearance) of a colored compound so that it can be observed even by the eye. To this end, a colorimetric assay that couples NAD(P)H formation with NBT/PMS to produce a blue-purple formazan has been used for the determination of the activity of various dehydrogenases. 21
LDH is a tetrameric oxidoreductase that exists in different forms in different tissues; however, only two distinct subunits have been identified: LDH-A (or M isoform, for muscle) and LDH-B (or H, for heart and myocardium). The role of LDH-A in cancer metabolism (Warburg effect) has been extensively studied,13,45 and HTS assays have been reported. 46 LDH-B has been implicated in the development of certain types of cancers, such as lung and breast cancer;12,16 however, to the best of our knowledge, an HTS assay to determine the activity of LDH-B has not been reported.
Optimization of assay conditions is usually carried out using the time-consuming and ineffective OFAT approach that examines the effect of only one factor on the response in each experiment. In contrast, DoE approaches examine simultaneously the effect of multiple factors and the effect of their interactions on a response in a single experiment (for a review on the topic, see Ref. 30 ). In our laboratory, we have successfully used DoE approaches for the optimization of the expression of recombinant tumor necrosis factor, 47 receptor activator of nuclear factor κB ligand (RANKL), 48 heme oxygenase-1, 42 and HRV-3CP, 41 as well as to optimize the purification 41 and assay 27 conditions of HRV-3CP.
In this work, we use DoE approaches to identify the optimum conditions to measure the activity of LDH-B using the NBT/PMS assay. In an initial screening step, the pH of the reaction mixture, the NaCl concentration, and reaction time were identified as the factors that significantly affect the activity of LDH-B using the NBT/PMS assay, while our results were verified using the spectrometric method at 340 nm. It is well known that the buffer composition and pH, as well as the ionic strength, incubation time, and temperature, may have an impact on the activity of several enzymes. Subsequently, the best combination of these three factors that maximize the activity of LDH-B was identified using RSM as follows: pH of reaction mixture equal to 9.6, NaCl concentration equal to 150 mM, while an incubation time equal to 6.5 min is required. It should be clarified that according to the ANOVA results (
Table 4
), each factor (i.e., A: pH; B: NaCl concentration; and C: reaction time) has a significant impact on LDH-B activity, but the interactions of factors (i.e., AB, AC, and BC in
Table 4
) do not affect enzyme activity. These findings are in agreement with our screening experiments, indicating that the pH and reaction time have statistically significant effects on LDH-B activity (
After identification of the best combination of factors that maximize LDH-B activity, an approximately 75% increase of enzyme activity was achieved (LDH-B activity before and after optimization was 452.5 and 793.2 mU/mL, respectively). Moreover, kinetic studies ( Table 5 ) revealed that under optimal conditions, the affinity (reciprocal of KM) of LDH-B against NAD+, Vmax, and kcat increased by approximately 24.2%, 16.3%, and 16.2%, respectively. Likewise, the affinity, Vmax, and kcat against lactate increased by 18.3%, 19.6%, and 19.8%, respectively. Modification of the assay conditions resulted in a higher Z′ factor (0.84) compared with an assay under the previously reported conditions (Z′ factor: 0.75), indicating that the former is probably more suitable for screening of potential LDH-B inhibitors. The improvement in the Z′ factor was achieved mainly due to the increase of the S/N from 16.8 (before the optimization) to 30.5 (after the optimization). Moreover, we estimated that the conversion of the limiting reagent (NAD+) to the product (NADH) in the initial (before optimization) and final (after information) assay conditions was approximately 9% and 14%, respectively.
Comparison of kinetic parameters and Z′-factors obtained before and after the optimization of LDH-B assay conditions.
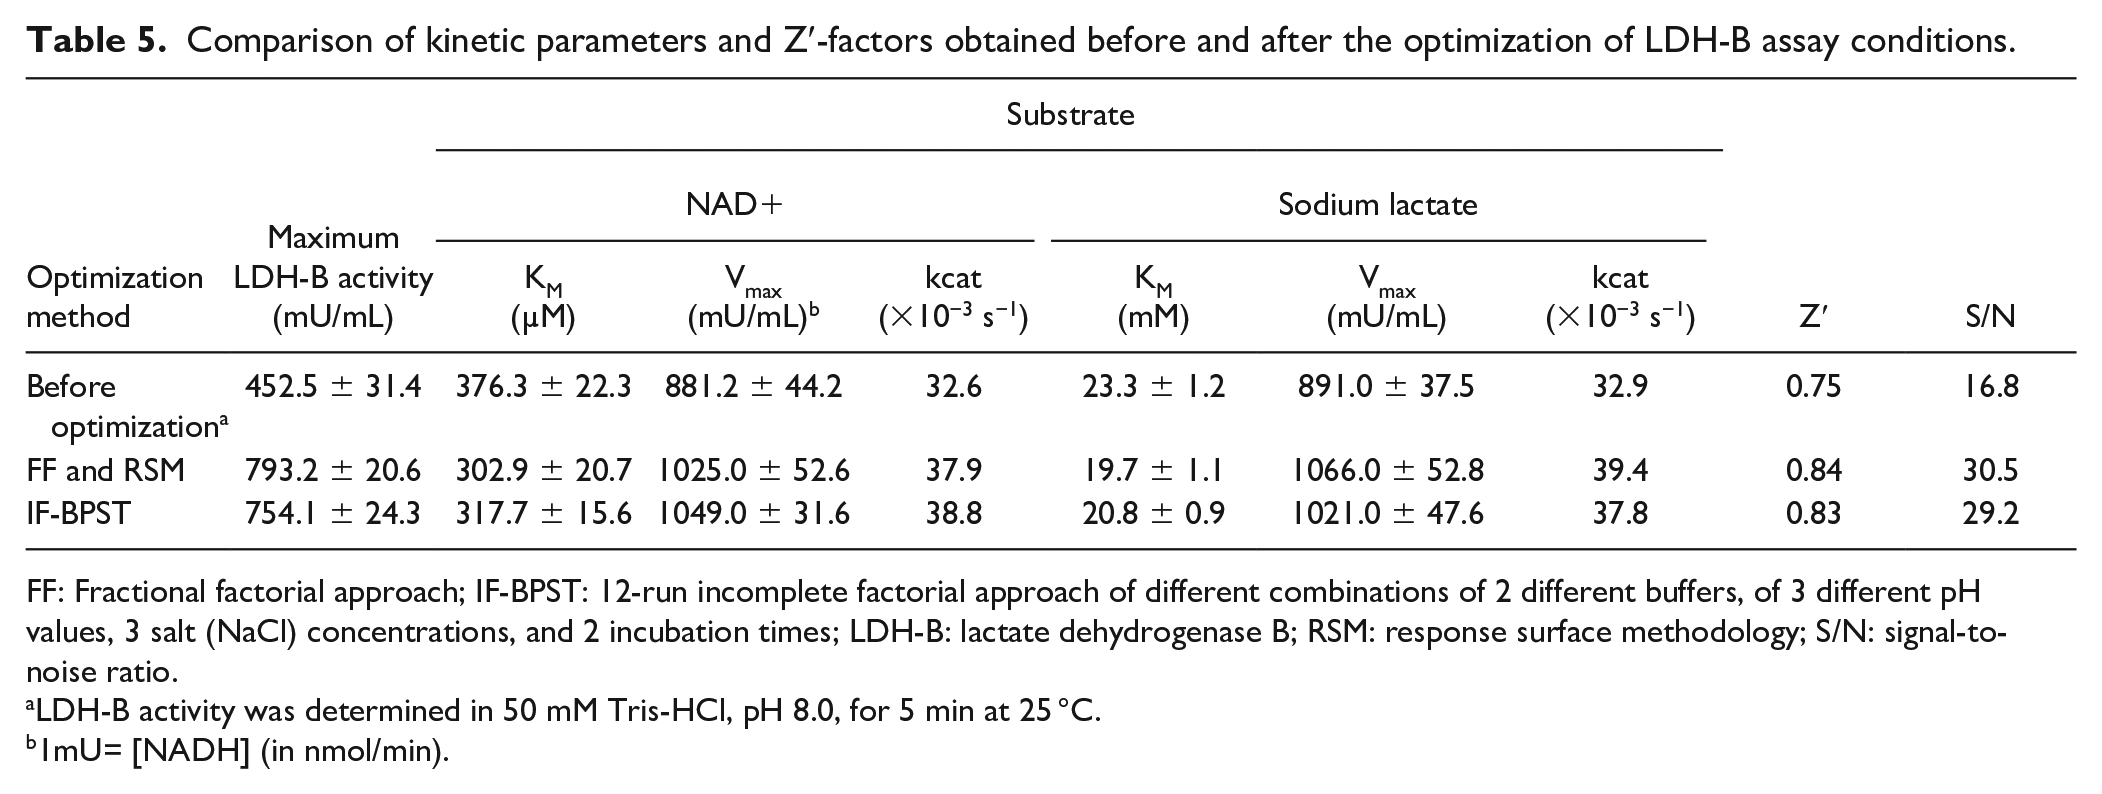
FF: Fractional factorial approach; IF-BPST: 12-run incomplete factorial approach of different combinations of 2 different buffers, of 3 different pH values, 3 salt (NaCl) concentrations, and 2 incubation times; LDH-B: lactate dehydrogenase B; RSM: response surface methodology; S/N: signal-to-noise ratio.
LDH-B activity was determined in 50 mM Tris-HCl, pH 8.0, for 5 min at 25 °C.
1mU= [NADH] (in nmol/min).
Even though RSM has been successfully used for the optimization of several processes, including various assay conditions, this method may have some limitations, especially when more than one categorical factor should be included in the design. For example, when more than one categorical factor must be included in the study, then RSM should be repeated for every combination of the categorical factor levels. For instance, if three continuous factors must be examined at three levels using a BBD, 15 experimental runs (combinations) are needed. If one categorical factor is added to the design, then at least 30 experimental runs are needed, and so on.
To this end, we propose an IF approach that examines simultaneously both categorical and continuous factors at more than two levels ( Table 3 ). We called this 12-run design IF-BPST, and it is composed of two different buffers (AMP and CHES) of three different pH values (9, 9.5, and 10), three salt concentrations (50, 150, and 250 mM), and two different incubation times (5 and 10 min). The factors were selected as follows: It is well known that the selection of buffer may have an impact on an enzyme-catalyzed reaction, while each buffer can have different and significant effects on various enzymes. Even though the majority of in vitro biochemical assays are carried out at pH values of ~7.4, however, some enzymes may act better at pH in in vitro assays. Thus, different pH values should be tested in enzymatic activity assays. 44 It has been previously proposed that LDH-B should be assayed in pH values higher than 8.5, while the AMP (pH range: 9–10.5) has been widely used as the reaction buffer in experiments for the determination of LDH-B activity.38,40,43 Thus, we introduced CHES as a second buffer (pH range: 8.6–10) in out IF design because the preparation of AMP buffers is quite difficult and time-consuming.38,40 Moreover, we decided to determine LDH-B activity in the pH range of 9 to 10. It should be noted that we initially examined whether AMP and CHES affect the formation of the blue-purple formazan, and both buffers do not interfere with the development of the colored product. The ionic strength (salt concentration) is another important factor affecting enzyme activity, and the increase of ionic strength and influence on the pH of the assay must be taken into account. In general, most enzymes required a moderate ionic strength of <0.2 M, while low ionic strength destabilizes the enzyme structure. It has been previously demonstrated that the ionic strength may alter the quaternary structure of LDH, while the enzyme has been identified in both dimeric and tetrameric active forms. Moreover, the dissociation–association of LDH may have functional importance; the dimer has a preferential role in pyruvate reduction, and the tetramer a preferred function in lactate oxidation. 49 Also, the dissociation–association of LDH tetramers and dimers is affected by enzyme concentration and by the concentration of substrates (i.e., pyruvate and/or lactate). 49 Elevated lactate concentrations promote the formation of tetramers, while high pyruvate concentrations promote the formation of dimers. The effect of ionic strength on both LDH quaternary structure and activity is currently under investigation in our laboratory.
Incubation time is another important factor influencing the activity of the enzyme and is related to the enzyme amount in the reaction mixture. As a general rule, the incubation time should be selected to be within the area of the linear progression of the velocity. 38 Even though temperature is another factor that significantly affects the activity of many enzymes, in this study we did not consider incubation temperature as a factor to be optimized because previous studies demonstrated that LDH-B should be assayed at 25 °C. 36 The results obtained with the IF-BPST were comparable with those obtained by RSM, as summarized in Table 5 . After the identification of the best assay conditions, an approximately 1.7-fold increase in LDH-B activity was achieved. Importantly, the Z′ factor was increased from 0.75 (before optimization) to 0.83 (after optimization). The main drawback of the method, however, is that previous information about the enzyme to be studied is required, and therefore it cannot be used for a newly discovered enzyme. Two major advantages of the IF-BPST method, however, are that the experimental runs (combinations of factors) were designed using the Samba freeware, and no extensive knowledge of statistics is required to interpret the results.
In several cases, especially in HTS assays, the addition of organic solvents, detergents, and other additives in the reaction mixture is required. Our results revealed that in the NBT/PMS assay, the formation of formazan changes the solution absorption spectrum from light yellow to blue-purple and is unaffected by buffer additives such as DMSO and NaCl; however, it is strongly affected by the non-ionic detergents Triton X-100, Tween 20, and NP-40 (even at concentrations as low as 0.01%), while the ionic detergent SDS negatively affects both LDH-B activity and the development of the blue-purple product. Thus, LDH-B containing lysates obtained using detergent-based lysis buffers cannot be used directly in the NBT/PMS-based assay proposed herein (e.g., for the determination of LDH-B activity in tumor samples). This issue may be overcome by precipitating the proteins in the detergent-containing solutions using the ammonium sulfate method to remove the interfering substances, and then to re-dissolve the protein pellet in an assay-compatible buffer and to carry out the assay. Our results also revealed that the NBP/PMS assay can be used in an HTS format in the early stages of the drug discovery process to identify potential small-molecule inhibitors of LDH-B. If the small molecules are fluorescent, and depending on the excitation and emission wavelengths of the compounds, then the absorbance values must be correct using the appropriate controls containing the compound(s) without the enzyme, as previously described. 39
To conclude, an important problem in the early stages of drug discovery is that DoE is not universally applied to assay development. Optimization of enzyme and non-enzyme assay conditions is usually performed by trial-and-error approaches. The main disadvantage of OFAT approaches is that they do not take into account the effect of the interactions among the factors to be tested on a process (response). DoE approaches, however, with a minimum set of experimental runs and therefore with reduced time and cost, predict the effect of each factor and the effects of their interactions on a process. Importantly, several DoE software packages are available to facilitate the experimental strategy and analysis of the results, while the Samba freeware is also available for a DoE novice. DoE approaches have been successfully used for the optimization of both enzymatic and non-enzymatic assays (see Ref. 30 and references cited therein).
Finally, we propose some recommendations for the development and/or optimization of assay conditions using DoE:
Experimenters and enzymologists should identify the optimal enzyme and substrate(s) concentration based on their previous experience with the same or similar enzymes or based on literature. For newly discovered enzymes, preliminary experiments should be carried out to identify the best concentration of enzyme and substrate, and some enzymologists include the concentration of enzyme and/or substrate as factors to be examined in their DoE design. In general, the enzyme concentration should be included in the experimental design because it is directly related to the observation time. Importantly, the time monitoring the reaction should be within the area of the initial linear progression of the velocity, while the reaction velocity can be regulated by varying the amount of enzyme.
In several cases, depending on the target enzyme, various additives including detergents (lower than their critical micelle concentration), stabilizers, reducing agents, antioxidants, protease inhibitors, complexing reagents, and so on should be added in the reaction mixture to improve the quality of the assay or because they are essential to maintain enzyme activity. The effects of all assay components, including compounds not directly involved in the reaction, must be taken into account, and their optimum concentration should be determined experimentally. Importantly, all assay components must be compatible with one another.
For colorimetric-based assays, it is essential to identify the factors (i.e., buffer additives) that interfere with the development of the color, and when possible, these factors should be excluded from the reaction mixture. Otherwise, appropriate mathematical adjustments to compensate for the negative effect of the buffer additives should be carried out.
When only limited information about the target enzyme is available, then the factors that statistically significantly affect the enzyme activity should be identified using a fractional factorial design, and subsequently RSM should be used for further optimization of assay conditions.
When sufficient information about the target enzyme (or similar enzymes) is available, then the enzymologist should begin with the reaction conditions and factors published previously. Subsequently, an in-complete factorial approach that examines simultaneously both categorical and continuous factors at multiple levels can be used to optimize the activity of the target enzyme. The selection of factors will depend on the available information and the type of enzyme.
In incomplete factorial designs, buffer additives can be examined simultaneously as categorical and continuous factors by including experimental runs that do not include a particular additive (e.g., without NaCl) and other runs that contain a different concentration of this additive (e.g., 50 and 150 mM NaCl).
Footnotes
Declaration of Conflicting Interests
The authors declared no potential conflicts of interest with respect to the research, authorship, and/or publication of this article.
Funding
The authors received no financial support for the research, authorship, and/or publication of this article.