
Abstract
There is interest in developing inhibitors of human neutral ceramidase (nCDase) because this enzyme plays a critical role in colon cancer. There are currently no potent or clinically effective inhibitors for nCDase reported to date, so we adapted a fluorescence-based enzyme activity method to a high-throughput screening format. We opted to use an assay whereby nCDase hydrolyzes the substrate RBM 14-16, and the addition of NaIO4 acts as an oxidant that releases umbelliferone, resulting in a fluorescent signal. As designed, test compounds that act as ceramidase inhibitors will prevent the hydrolysis of RBM 14-16, thereby decreasing fluorescence. This assay uses a 1536-well plate format with excitation in the blue spectrum of light energy, which could be a liability, so we incorporated a counterscreen that allows for rapid selection against fluorescence artifacts to minimize false-positive hits. The high-throughput screen of >650,000 small molecules found several lead series of hits. Multiple rounds of chemical optimization ensued with improved potency in terms of IC50 and selectivity over counterscreen assays. This study describes the first large-scale high-throughput optical screening assay for nCDase inhibitors that has resulted in leads that are now being pursued in crystal docking studies and in vitro drug metabolism and pharmacokinetics (DMPK).
Introduction
Colorectal cancer is the third most common cancer in the United States, with ~132,000 cases per year. Despite significant advances in early detection, progression to metastatic disease occurs in ~1/3 of patients, resulting in ~49,000 disease-related deaths. 1 Neutral ceramidase (nCDase) is highly expressed in colonic epithelium and converts ceramide to sphingosine. nCDase is a novel enzyme that displays no sequence or structural homology to other proteins.2,3 In intestinal tissues, nCDase is located at the brush border. 4 The enzyme is tethered to the plasma membrane by a single-pass transmembrane helix and an extended highly glycosylated 60-amino acid linker. The large, glycosylated catalytic domain is attached to this linker and hydrolyzes dietary ceramide that is solubilized in bile acid micelles passing through the intestinal system. 4 The ability of nCDase to hydrolyze ceramide in the outer leaflet of the plasma membrane is not known. nCDase is a lipid amidase and has no activity toward peptide bonds. Furthermore, the substrate specificity has been well defined. nCDase is very specific for the endogenous stereoisomer of ceramide and cannot accommodate alterations to the terminal hydroxyl group of ceramide or alterations to the sphingoid backbone.5 –7 The balance between pro-apoptotic ceramide and pro-proliferative sphingosine-1-phosphate (S1P) has emerged as a critical node in neoplastic transformation. Although nCDase has emerged as a therapeutic target, we currently lack pharmacological nCDase inhibitors for this unique lipid amidase suitable for in vivo studies.
nCDase is the one of the three families of ceramidases that are distinguished by their pH optima, subcellular localization, primary structure, mechanism, and function. 8 The major ceramidase in intestinal tissues is nCDase. 9 Ceramidases are lipid amidases that hydrolyze the amide bond of ceramide to generate sphingosine. In turn, sphingosine can be converted to S1P catalyzed by sphingosine kinases (SKs). Ceramide and S1P are bioactive lipids that are involved in the sphingolipid metabolism pathway. Sphingolipid metabolism is complex but summarized in several review articles.10 –12 Sphingolipids are a family of membrane lipids that play an important role in transducing cellular signaling processes,10,13 including promoting migration, cell proliferation, senescence, and apoptosis. The defining chemical feature of sphingolipids is an amide bond, which is formed by the N-acetylation of the sphingoid base backbone to form ceramide. Ceramide and S1P are critical molecules in colon cancer development, promoting cell proliferation, survival, and angiogenesis.14 –16 S1P has relatively low levels compared with other sphingolipids and acts through five distinct G-protein-coupled receptors (GPCRs). Redundancy in signaling between the five S1P receptors has impeded use of receptor antagonists for cancer indications. S1P is generated from sphingosine by sphingosine kinase 1 (SK1) in colon tissues. 17 Critically, both SK1 and S1P are significantly elevated in colon cancer tissues compared with normal mucosal tissues in the azoxymethane-induced mouse model, 17 and genetic deletion of SK1 can reduce the formation of aberrant crypt foci (ACFs) and progression to adenocarcinomas. 18 Consistent with this, SK1 deletion in the APC-deficient mouse reduces adenoma formation. 19 Importantly, 89% of human colon cancer samples demonstrated upregulation of SK1. Taken together, there is substantial evidence that increased SK1 and S1P levels contribute to colon carcinogenesis.
In contrast to the function of S1P, ceramide stimulates apoptosis, induces senescence, and inhibits cell proliferation. This is dependent on the stimulus, cell/tissue type, specific pathway of ceramide generation, and specific molecular species of ceramide.10,20 –22 In the intestine, ceramide is generated by alkaline sphingomyelinase (alkSMase), which hydrolyzes dietary sphingomyelin (SM) to form ceramide and phosphoryl-choline.23,24 Ceramide is further metabolized by nCDase to form sphingosine. 4 In human colon cancer tissue, there is a 50% reduction in ceramide levels compared with normal mucosa. 25 Interestingly, several studies have looked at and found that dietary SM, which is converted to ceramide in the intestine, can inhibit colon cancer formation in animal models.26,27 Overall, the association between decreased ceramide levels and increased S1P levels implicates sphingolipid metabolism as a novel target for colon cancer therapy. 9
Armed with this information, our strategy was to focus on the development of pharmacological inhibitors of nCDase with properties suitable for in vivo modeling, which is not possible with the current biochemical ceramidase inhibitors. The assay principle is based on the reaction between nCDase, a substrate, and sodium periodate (NaIO4), which results in a fluorescent signal. 28 In order to perform large-scale screening, we miniaturized and optimized this assay to a 1536-well format. The assay was tested against 666,120 compounds from the Scripps Drug Discovery Library (SDDL) and the results are described herein.
Materials and Methods
Assay Reagents
Human nCDase was purified from Sf9 cells at Stony Brook University. 29 The assay used 0.5 µg/mL of nCDase in phosphate-buffered saline (PBS; Life Technologies, Carlsbad, CA). Final concentrations of 20 µM RBM 14–16 and sodium periodate (NalO4; Sigma, St. Louis, MO) were used as a substrate. Two types of buffers, reaction buffer and glycine buffer, were used in this assay. The reaction buffer contains 0.6% Triton-100 (Sigma), 150 mM NaCl (Sigma), and 25 mM phosphate (9.7 mM NaH2PO4 and 15.3 mM Na2HPO4; Sigma), and the pH was adjusted to 7.4. The glycine buffer contains 100 mM glycine (Sigma) and the pH was adjusted to 10.6. Sodium periodate (2.5 mg/mL; Sigma) was prepared fresh in glycine buffer on the day of the experiment. C6-urea-ceramide (Avanti, Polar Lipids, Alabaster, AL) was used as a pharmacological control for the high-throughput screening (HTS) campaign.
Compounds
The SDDL currently consists of 666,120 compounds, representing a diversity of druglike compound scaffolds targeted to traditional and nontraditional drug discovery biological targets. The SDDL has been curated from more than 20 commercial and academic sources and contains more than 40,000 compounds unique to Scripps. It is important to note that the SDDL also has minimum overlap (<14%) with any other known large compound library. The SDDL compounds were selected based on scaffold novelty, physical properties, and spatial connectivity. By design, the diversity of the SDDL mimics that of much larger collections found at major pharmaceutical companies yet is responsive to lessons learned from successful drug discovery efforts and emerging trends in HTS library construction.30 –34 In its current state, the SDDL has several focused sublibraries for screening popular drug discovery target classes (e.g., kinases/transferases, GPCRs, ion channels, nuclear receptors, hydrolases, transporters, and structure–activity relationships [SARs]), as well as diverse chemistries (e.g., click chemistry, PAINS-free, Fsp3 enriched, and natural product collections) and those based on physical properties (“rule of five,” “rule of three,” polar surface area, etc.).
A 1536-Well Assay protocol
This assay is performed by incubating 2 µL/well of nCDase (final concentration: 0.5 µg/mL in PBS) with 50 nL/well compound and 2 µL/well RBM 14-16 (final concentration: 20 µM in reaction buffer) for 3 h at 37 °C. This is followed by the addition of 2 µL/well sodium periodate (NaIO4 in glycine buffer) and centrifugation (1000 RPM for 5 min), followed by the measurement of fluorescence using the PerkinElmer ViewLux (excitation 360 nm; emission 460 nm). Ceramidase hydrolyzes RBM 14-16, and the addition of NaIO4 acts as an oxidant that releases umbelliferone, resulting in a fluorescent signal. As designed, test compounds that act as nCDase inhibitors will prevent the hydrolysis of RBM 14-16, thereby decreasing well fluorescence.
Data Acquisition and Analysis
Raw assay data were imported into the Scripps corporate database and subsequently analyzed using Symyx software. The activity of each compound was calculated on a per-plate basis using the following equation:
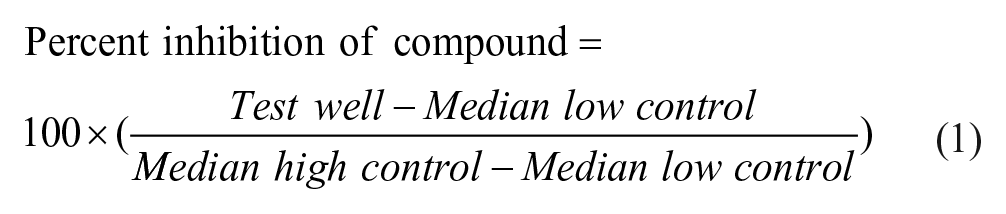
where “high control” represents wells containing DMSO and substrate (RBM 14-16) and “low control” represents wells containing DMSO, substrate (RBM 14-16), and nCDase. The assay robustness was calculated on a per-plate basis using Z′ analysis generated using the high and low controls (N = 24 each per plate). Each plate must have scored a Z′ of >0.5 in order to be accepted for further analysis. If not, it was rescheduled and tested until we achieved the proper Z′. 35 A mathematical algorithm was used to determine active compounds, which we refer to as an interval-based hit cutoff, which allows us to retain more hits than when we use a standard hit cutoff. Four values were calculated: (1) the average percent inhibition of all high controls tested plus three times the standard deviation of the high controls, (2) the average percent inhibition of all low controls tested minus three times the standard deviation of the low controls, (3) the average percent inhibition of all compounds tested between values 1 and 2, and (4) three times their standard deviation. The sum of two of these values, 3 and 4, was used as a cutoff parameter; that is, any compound that exhibited greater percent inhibition than the cutoff parameter was declared active and that percent inhibition value is referred to as the “hit cutoff.”
Counterscreen
To identify compounds that may act as quenchers or artifacts that optically interfere with fluorescence, a counterscreen was performed. For this screen, a “post-assay-pinning” method was employed. This assay was performed in format similar to that of the nCDase inhibitory assay, but compounds were transferred after the addition of NaIO4.
Secondary and Tertiary nCDase Assays
Two assays were used to further validate HTS hits and further remove fluorescence interfering compounds from consideration. C12-NBD-ceramide (Cayman Chemical, Ann Arbor, MI) was used as a fluorescent nCDase substrate and reaction products were separated by reverse-phase high-performance liquid chromatography (HPLC). The reaction conditions were 20 µM substrate, 1 nM nCDase in 75 mM NaCl, 25 mM HEPES (pH 8.0), and 0.4% Triton X-100, for 2 h at 37°C in a final volume of 100 µL. Samples were extracted with 1:1 chloroform-methanol (Sigma), dried under nitrogen gas, and resuspended in 60 µL of HPLC mobile phase B. Reaction products were separated by reverse-phase HPLC using a Spectra 3µm C8SR column (3 μm particle, 3.0 × 150 mm; Peeke Scientific, Novato, CA). Mobile phase A contained 0.2% formic acid and 1 mM ammonium formate in HPLC-grade water (Sigma). Mobile phase B contained 0.2% formic acid (Fisher Scientific, Hanover Park, IL) and 1 mM ammonium formate (Sigma) in HPLC-grade methanol (Sigma). All enzyme assays were technically and experimentally duplicated. A Förster resonance energy transfer (FRET)-based assay 36 was performed using 20 µM substrate ES.173.cds, 36 50 ng of nCDase, 75 mM NaCl, 15 mM sodium phosphate (pH 7.4), and 0.3% Triton X-100 for 3 h in 96 black well plates. The excitation wavelength was 347 nm, the emission was measured at 430 nm and 530 nm, and a ratio of 430/530 nm was generated.
Results
The 96-well format nCDase inhibitor fluorescence assay28,37 was miniaturized and optimized in the 1536-well format for HTS. The modification of assay conditions, including incubation times and reagent concentrations, was based on increasing the Z′ value and reproducibility of the assay. The Km (Michaelis constant) of this assay for its substrate is 0.84 mol%. The assay kinetics were linear with respect to time (r2 = 0.96) and enzyme concentration (r2 = 0.99). The enzyme was found to be stable for 1 week at room temperature. During the 1536-well implementation, most changes to the 96-well format were well tolerated, but we observed two issues that we overcame. The first was that the NaIO4 was perceived to quench the enzyme turnover. However, this was not the case and the assay proceeded even after its addition. The solution was to automate the assay completely, which essentially controlled for the exact timing for each step in the protocol, especially considering the endpoint read. We also observed bubble formation after adding NaIO4. This caused excessive variability in the fluorescent reads on a well-to-well basis, which we ameliorated using an angle solenoid valve tip dispense with reduced pressure (10 psi to 6 psi) to allow for gentler addition of the reagent to all wells. We also implemented centrifugation after addition of NaIO4. Both steps afforded us with excellent well-to-well uniformity.
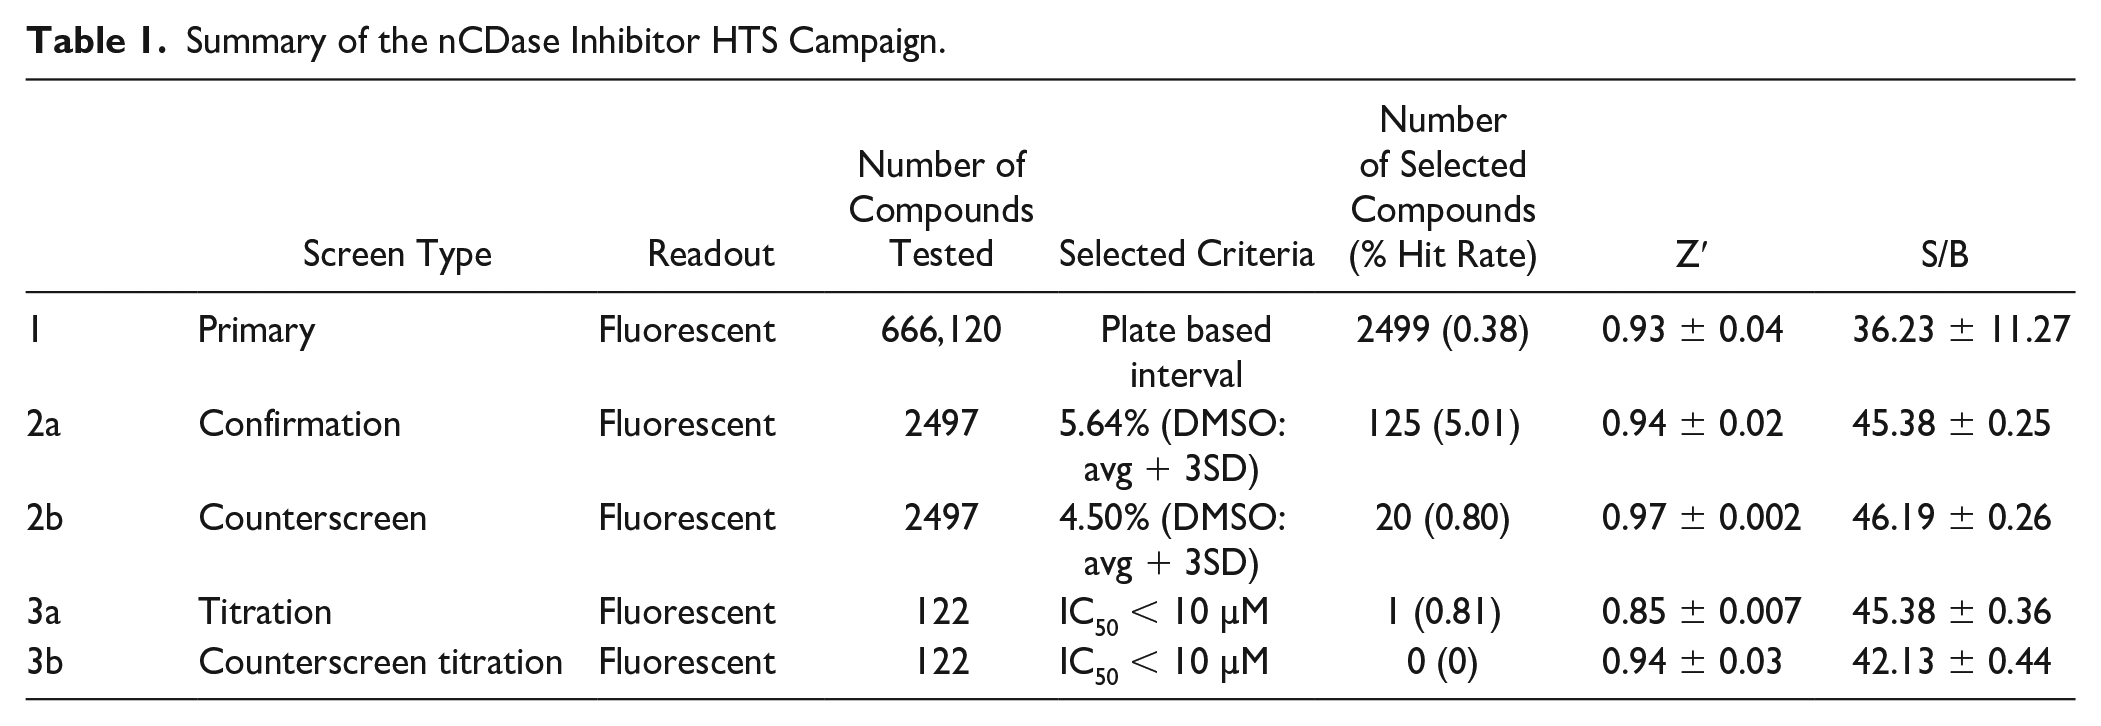
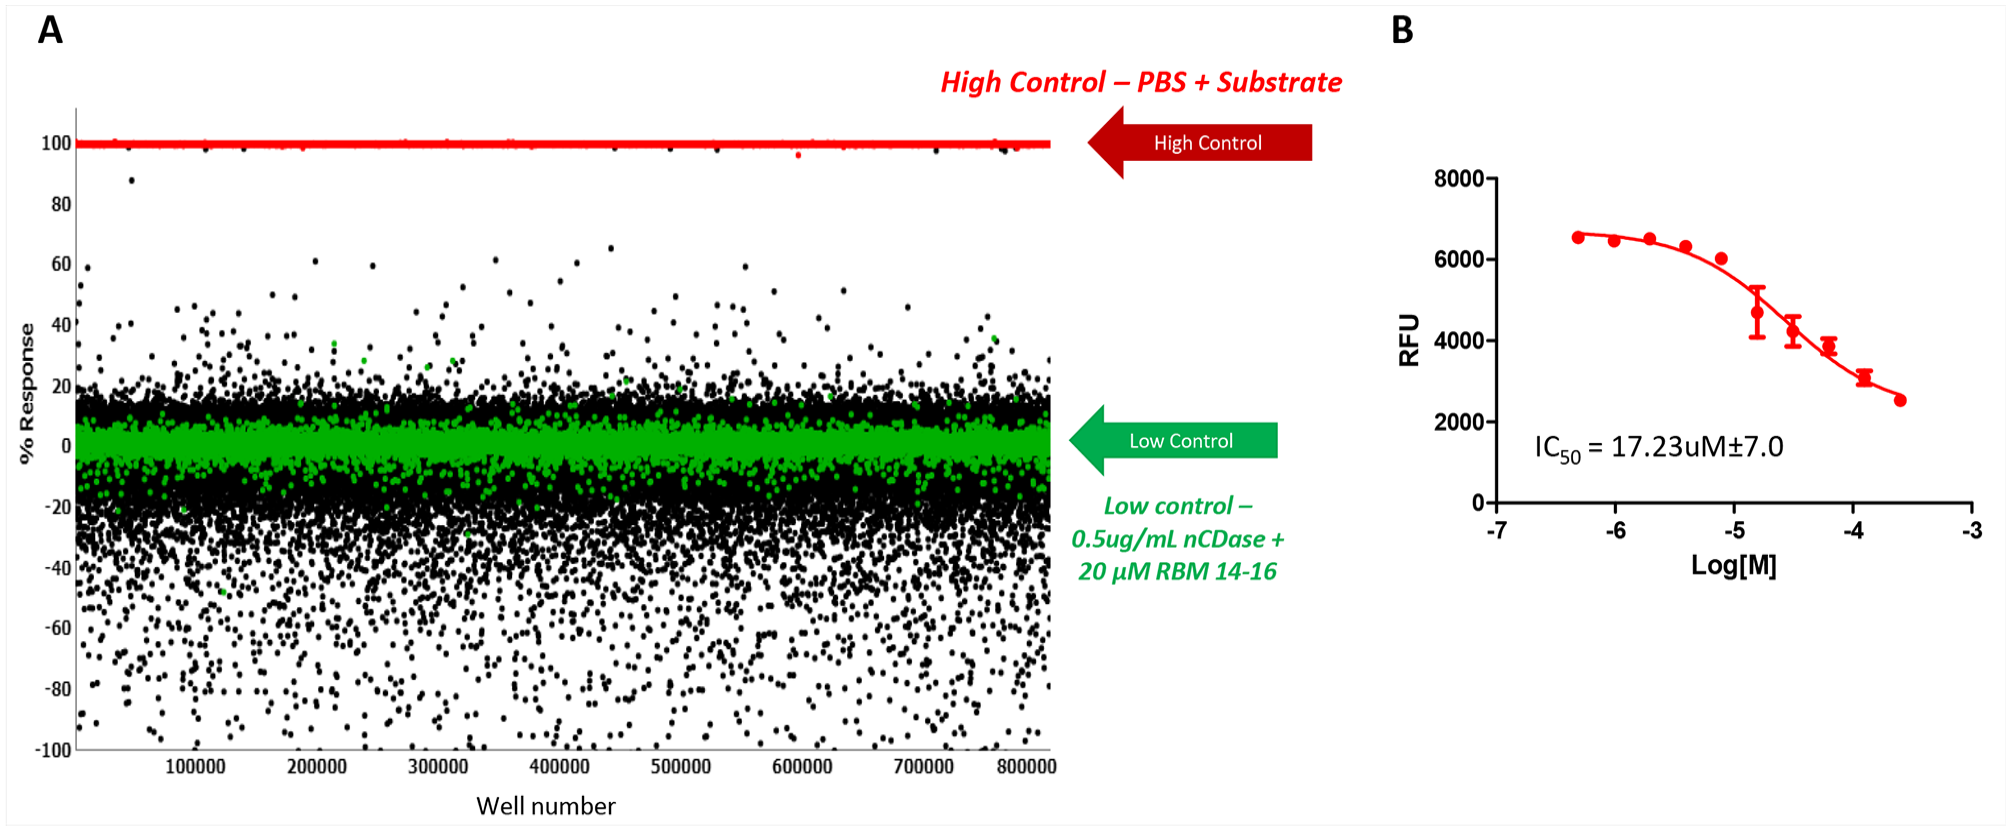
The first step of the HTS campaign was screening the nCDase inhibitor fluorescence assay against the 666,120 compounds of the SDDL. In this primary screen, compounds were tested at a single concentration in singlicate at a final nominal concentration of 17.4 µM. Assay performance was excellent, with an average Z′ of 0.93 ± 0.04 and an average signal-to-background ratio (S/B) of 36.23 ± 11.27 (n = 536 plates). A summary of the results of the primary screening assay is shown in Table 1 and Figure 1 . The ceramidase C6-urea-ceramide inhibitor was used as a pharmacological control for the assay, and the primary screen yielded an IC50 value of 17.23 ± 7.0 µM, which was an expected range. A plate-based interval cutoff was used to identify active compounds, and the primary screen yielded 2499 hits (hit rate: 0.38%). From the list of hits, 2497 compounds were available to test in the confirmation screen.
Summary of the nCDase Inhibitor HTS Campaign.
(
After completion of cherry-picking of the selected compounds, the confirmation screen was run. This assay utilized the same reagents and detection system as the primary screen, but the selected compounds were tested at a nominal concentration of 17.4 µM, in triplicate. The confirmation assay performance yielded an average Z′ of 0.94 ± 0.02 and an S/B of 45.38 ± 0.25 (n = 12 plates) (
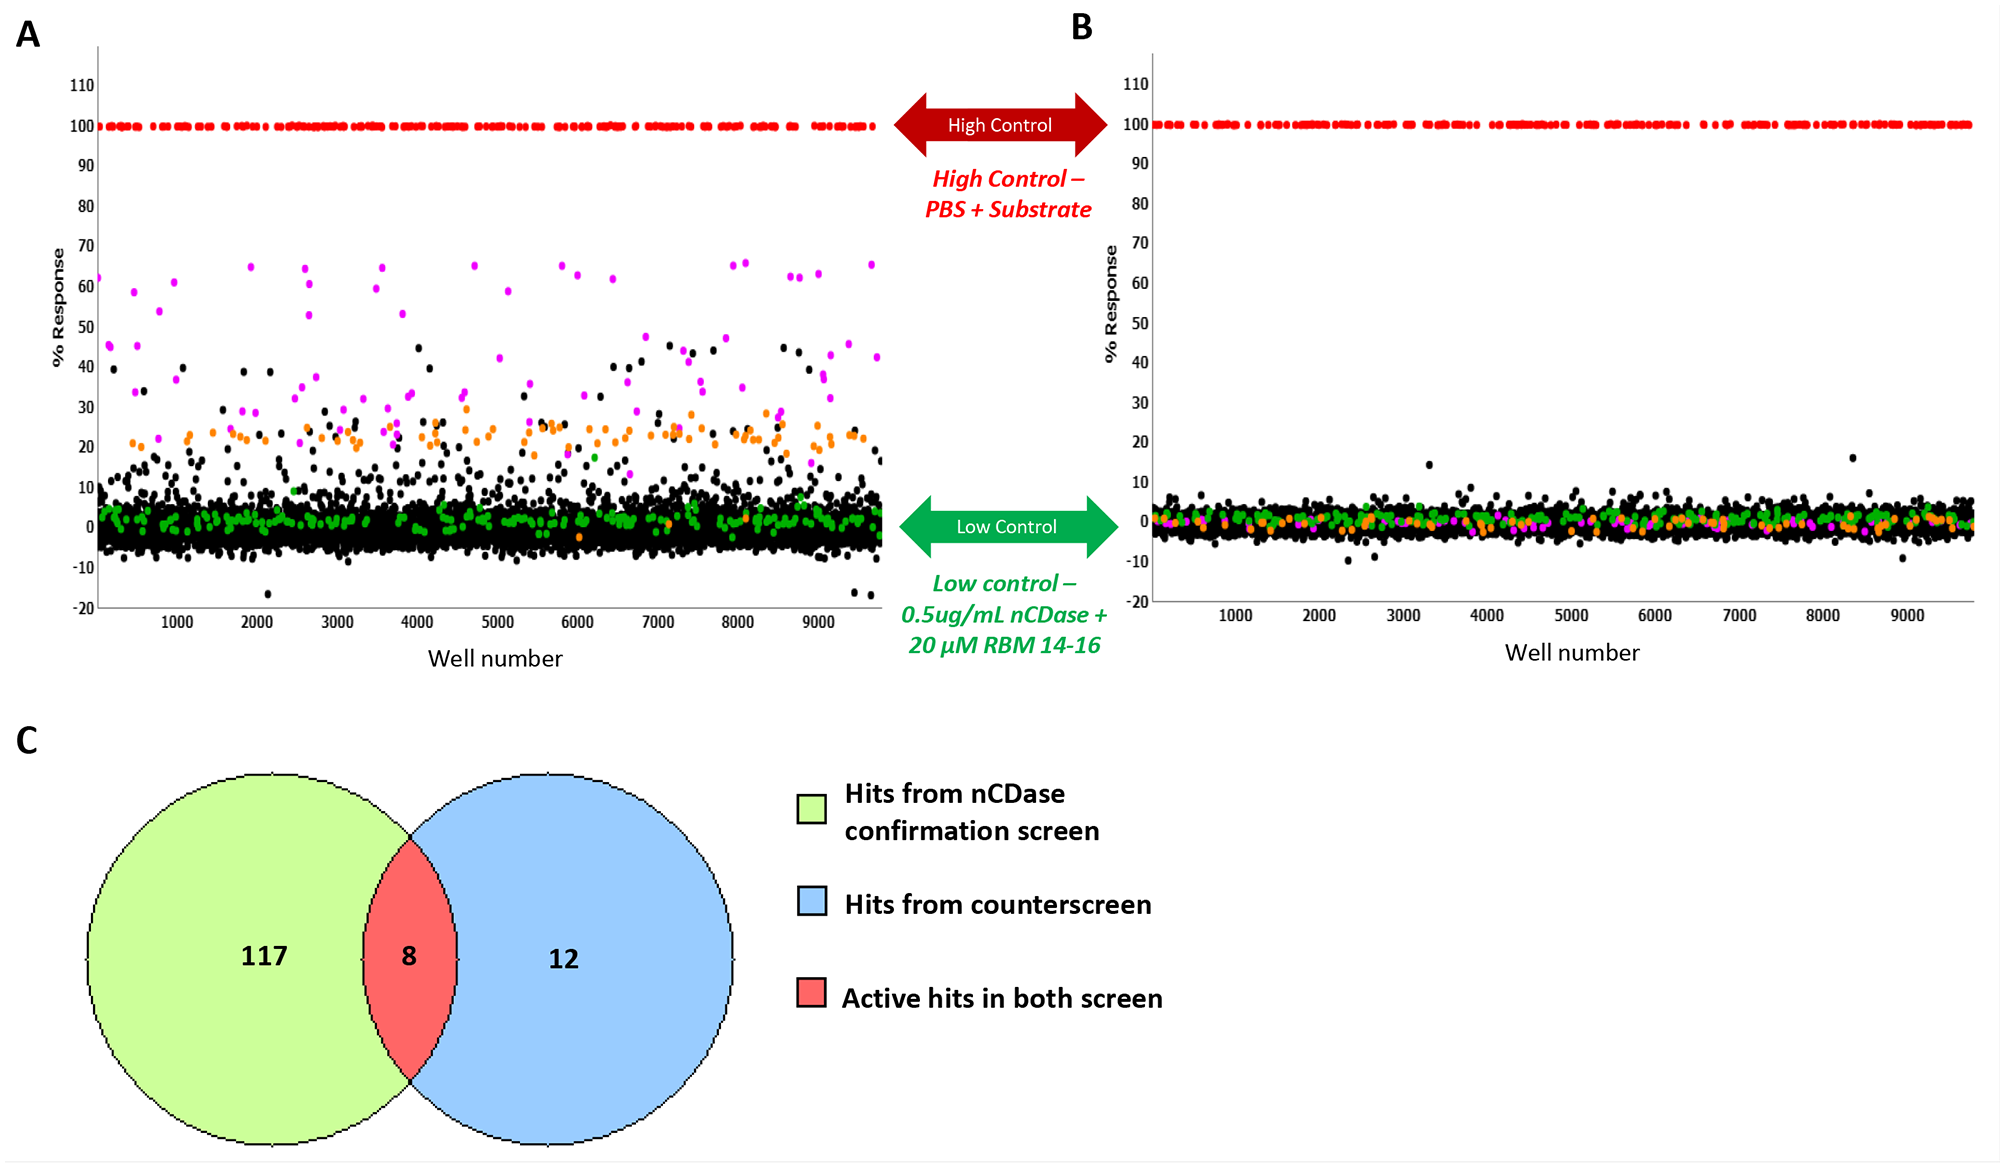
(
For the titration assay, each of the 122 compounds was tested as 10-point dose–response titrations (threefold dilutions) in triplicate. The nCDase inhibitor titration assay performance was consistent, with an average Z′ of 0.85 ± 0.007 and an S/B of 45.38 ± 0.36 (
Table 1
). For each test compound, the percent inhibition was plotted against the compound concentration. A four-parameter equation describing a sigmoidal dose–response curve was then fitted with an adjustable baseline using Assay Explorer software (Symyx Technologies Inc.). The reported IC50 values were generated from fitted curves by solving for the X-intercept value at the 50% activation level of the Y-intercept value. The following rule was used to declare a compound as “active” or “inactive”: compounds with no response were considered inactive. For this assay, 49 compounds had a response of >50% and 4 compounds and one analog showed high activity with an IC50 of <10 µM (
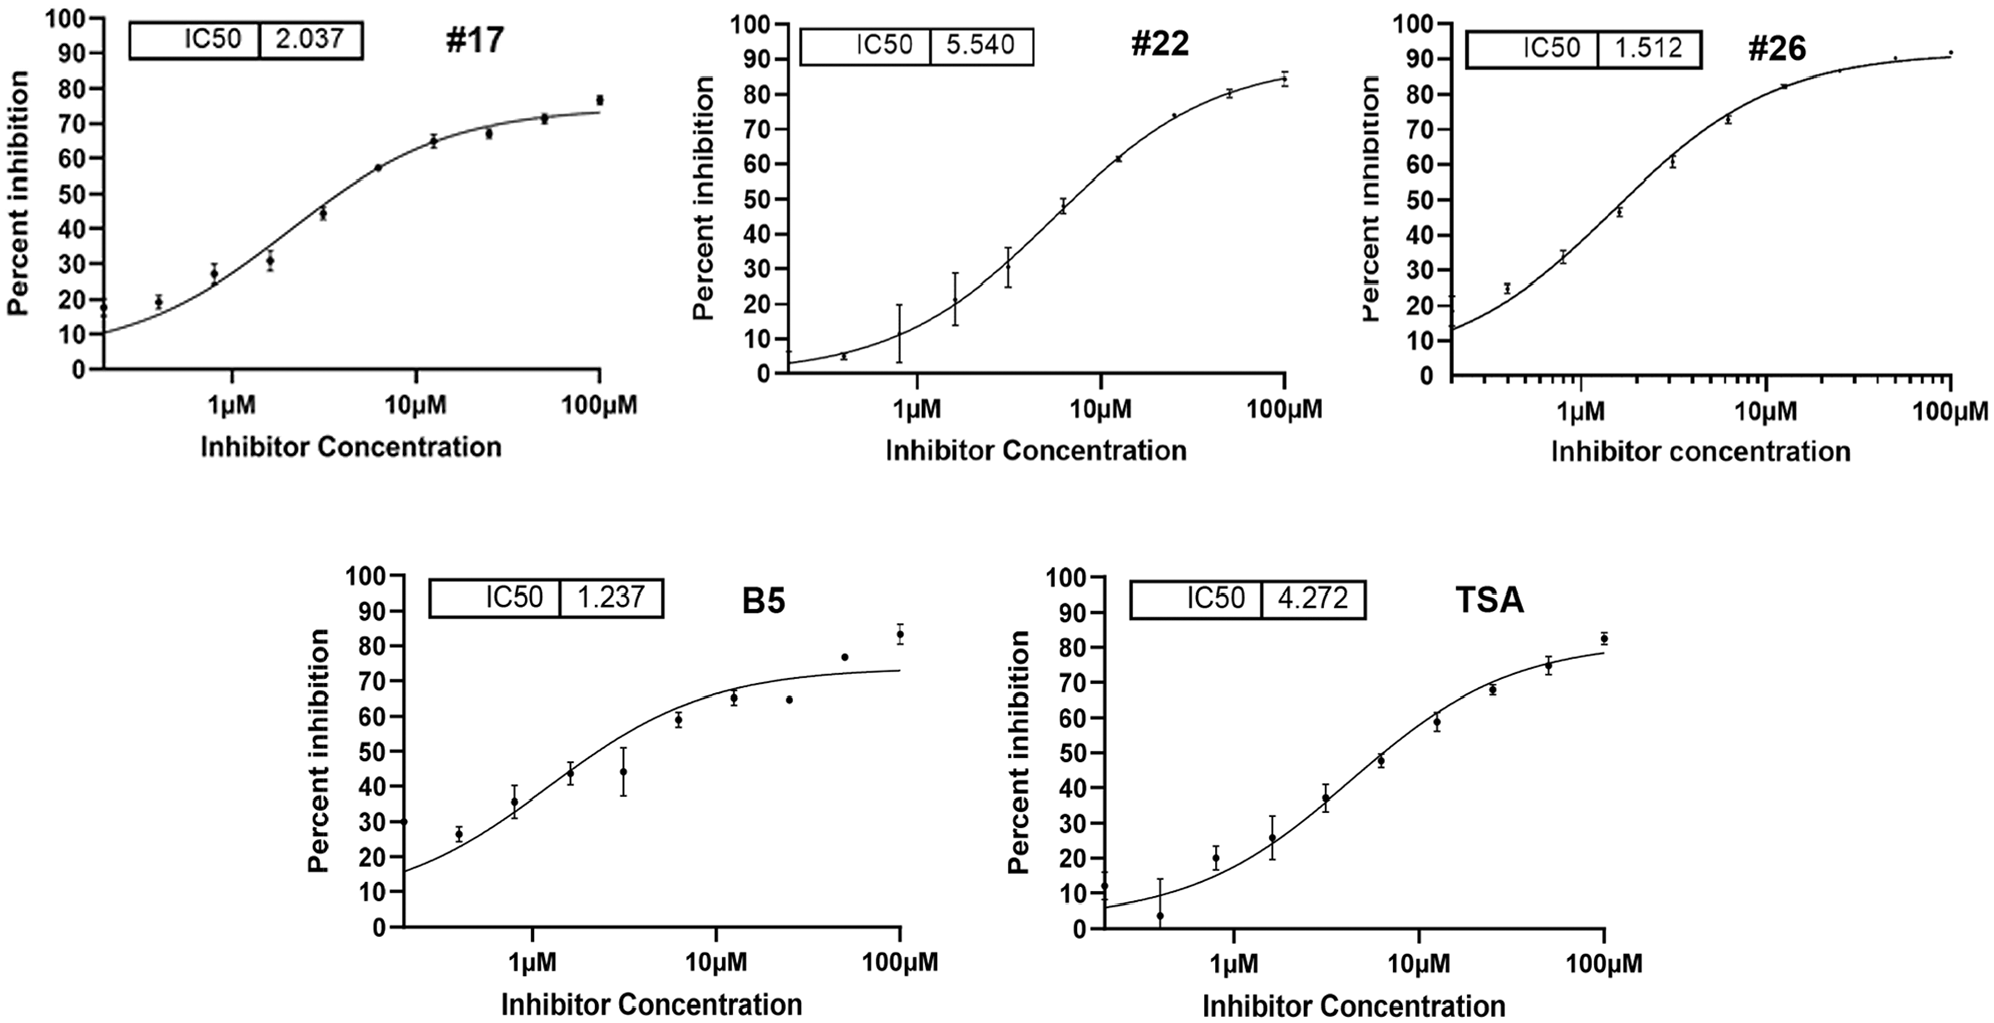
Active compound potency and efficacy. Active compounds from screening (17, 22, and B5; control TSA) and an analog of compound 22 (compound 26) were dose titrated using the RBM-ceramide assay to establish IC50 potency and percent maximal inhibition efficacy. The IC50 is shown in micromolar concentration for each.
Following the HTS campaign, the four analogs were expanded on via medicinal chemistry approaches to select for modifications that retain favorable druglike properties (compliant with rule of five) and are also anticipated to contribute a meaningful direction to SAR. Fresh powders of the initial analogs as well as expansion set were either obtained from chemical vendors or synthesized in-house. Hit validation was performed by comparison of manual RBM-ceramide, FRET ceramide, and NBD-ceramide-HPLC assays. FRET ceramide and NBD-ceramide-HPLC assays were included to overcome the sensitivity of the RBM-ceramide assay to compound fluorescence. In total, 678 compounds and analogs were selected from the RBM HTS assay and DOCK screening, which was preformed using the crystal structure of nCDase and predicted binding pose of ceramide within the active site. These selected compounds and analogs were screened at a fixed dose (435 compounds) or full 10-point IC50 (243 compounds). Twenty-two compounds were prioritized with an IC50 of <50 µM and percent inhibition of >70. Five chemical compound classes were identified with an IC50 of <20 µM. Several series were selected for further characterization using RBM-ceramide, FRET, and NBD-ceramide HPLC assays: manual RBM-ceramide assays were performed with fresh compounds showing IC50 values in the low micromolar range. Trichostatin A (TSA), a class I HDAC inhibitor, was identified in pilot screening and has served as a benchmark compound showing an IC50 value of 4 µM, while for comparison C6-urea-ceramide typically shows IC50 values of ~20 µM (data not shown). Screening hits 17, 22, and B5 showed IC50 values ranging from 1 to 6 µM. A close analog of compound 22, compound 26 showed improved potency with an IC50 of 1.5 µM. These data are shown in Figure 3 .
Compounds 17 and 22 were further tested using FRET probes for ceramidases 36 using C6-urea as a positive control. Two doses were tested with maximal activity at 30 µM. Compounds 17 and 22 showed nCDase inhibitions of ~67% and 88%, respectively ( Fig. 4A ).
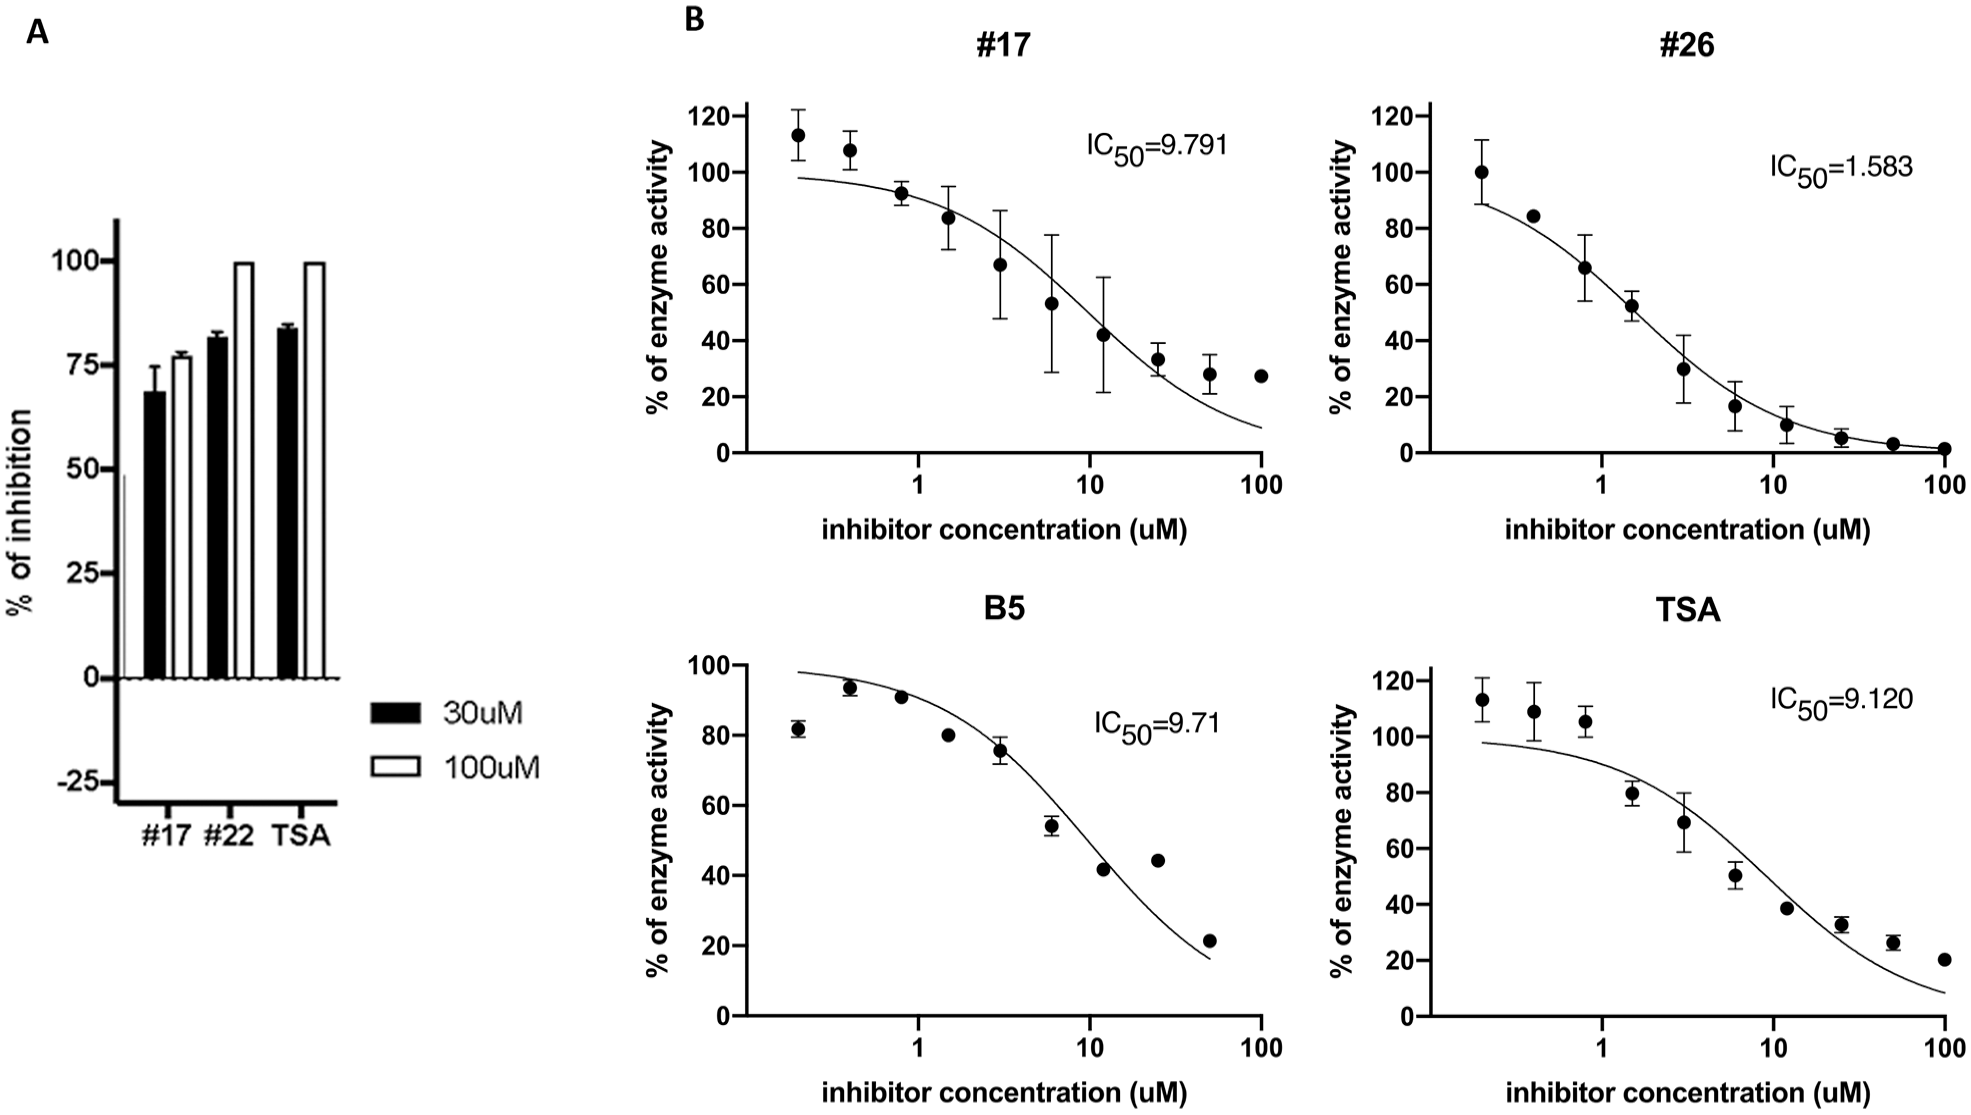
Confirmation of active compound potency and efficacy using orthogonal FRET and NBD-ceramide HPLC assays. (
The NBD-ceramide follow-up assay was performed to further validate test compounds and remove potential fluorescence interference. Initial NBD-ceramide assays on 22 HTS hits (data not shown) prioritized compounds 17 and 22. IC50 determinations on compounds 17, 26 (a compound 22 analog), and B5 were performed using TSA as a positive control. IC50 values of <10 µM were observed, with compound 26 showing a best potency with an IC50 of 1.6 µM (
Discussion
In this study, we applied large-scale HTS to find pharmacological inhibitors of nCDase, which is a therapeutic target for colorectal cancer. The primary screen against 666,120 compounds from SDDL resulted in 2499 hits with great plate statistics. The hit rate for this screening was 0.38%, which is in line with expectations based on pilot screening initiatives and the active site of the enzyme, which is somewhat predicted to be difficult to target.
The crystal structure of nCDase has revealed that the active site is accessed via a ~20 A hydrophobic channel with more polar lipid head group interactions in the base of the active site. 29 The hydrophobic channel provides an interaction surface holding ceramide in place for cleavage and release of the sphingoid tail. Active site chemical inhibitors need to be able to traverse the channel and make more electrostatic head group interactions at the catalytic site. On this basis, a relatively low hit rate was predicted.
From the 2497 compounds, we further narrowed them down to 49 compounds that showed a response of >50% in the titration assay, and of those, 4 compounds had an IC50 of <10 µM. All the assays were performed with exceptionally good Z′ scores ( Table 1 ), providing robustness in the outcomes.
In order to obtain optimum assay conditions in the 1536-well format, we tested multiple variables, including plate type, titration of nCDase and substrates, and adjustment in incubation times. The timing for reading after the addition of NalO4 was modified once we learned that the reaction between nCDase and substrate (RBM 14-16) did not stop after the addition of NalO4. The addition of NalO4 also caused bubble formation that resulted in decreased well fluorescence, and thus caused a false positive. This problem was resolved by using an angled tip for dispensing NalO4 and increasing the speed of centrifugation after addition.
For each assay, as a pharmacological inhibitor control, we used C6-urea-ceramide, which is a unique ceramide-based inhibitor 7 and the first specific inhibitor of nCDase. 38 However C6-urea-ceramide is an unstable molecule and lost its activity about 1 month later, which forced re-creation of fresh source plates using C6-urea-ceramide obtained as powder. This is something to keep in mind for longer HTS campaigns. In follow-up assays, we moved to TSA as a more stable and potent positive control.
In this HTS campaign, we used “post-assay-pinning” as counterscreening, which eliminated false positives caused by compound interference. To further validate and characterize compound potency and efficacy, we performed secondary FRET-based and tertiary NBD-ceramide HPLC separation-based confirmation assays. These assays confirm the findings of the HTS campaign. We have identified several chemical classes with potency ranges of 1–10 µM and maximal percent inhibitions of 70%– 95%. Initial SAR relationships have been observed and further compound class and singleton analogs are being evaluated. Diverse, active compounds will be used for co-crystal studies to inform chemical optimization.
In summary, we have thus far identified and confirmed multiple active compound classes using the HTS strategy described. Chemical optimization, pharmacokinetic evaluation, and biological characterization efforts are underway.
Footnotes
Acknowledgements
We thank Pierre Baillargeon and Lina DeLuca (Scripps Florida) for compound management. We thank Michael Simoes and Amalia Saleh (Stony Brook University) for assisting with follow-up compound evaluation. This work was supported using the ChemAxon software tools which have been provided free of charge.
Declaration of Conflicting Interests
The authors declared no potential conflicts of interest with respect to the research, authorship, and/or publication of this article.
Funding
The authors disclosed receipt of the following financial support for the research, authorship, and/or publication of this article: The studies were funded by the Stony Brook Cancer Center and by the National Cancer Institute (R01CA221948) as part of a joint collaboration between Scripps Florida and Stony Brook University Cancer Center.