
Abstract
Cell-to-cell variation of protein expression in genetically homogeneous populations is a common biological trait often neglected during analysis of high-throughput (HT) screens and is rarely used as a metric to characterize chemicals. We have captured single-cell distributions of androgen receptor (AR) nuclear levels after perturbations as a means to evaluate assay reproducibility and characterize a small subset of chemicals. AR, a member of the nuclear receptor family of transcription factors, is the central regulator of male reproduction and is involved in many pathophysiological processes. AR protein levels and nuclear localization often increase following ligand binding, with dihydrotestosterone (DHT) being the natural agonist. HT AR immunofluorescence imaging was used in multiple cell lines to define single-cell nuclear values extracted from thousands of cells per condition treated with DHT or DMSO (control). Analysis of numerous biological replicates led to a quality control metric that takes into account the distribution of single-cell data, and how it changes upon treatments. Dose–response experiments across several cell lines showed a large range of sensitivity to DHT, prompting us to treat selected cell lines with 45 Environmental Protection Agency (EPA)-provided chemicals that include many endocrine-disrupting chemicals (EDCs); data from six of the compounds were then integrated with orthogonal assays. Our comprehensive results indicate that quantitative single-cell distribution analysis of AR protein levels is a valid method to detect the potential androgenic and antiandrogenic actions of environmentally relevant chemicals in a sensitive and reproducible manner.
Introduction
The need for high-throughput screening (HTS) assays in environmental toxicology has spurred worldwide efforts geared toward the identification and quantification of potential toxicant effects of thousands of chemicals and, more recently, complex mixtures, in a variety of systems and pathways. One of the largest efforts to date has been the U.S. Environmental Protection Agency’s (EPA) Endocrine Disruptor Screening Program (EDSP), which aimed to combine HTS with computational analyses to characterize chemicals that interfere with endocrine hormones, focusing on three nuclear receptors pathways: estrogen (ER), androgen (AR), and thyroid (TR) receptors. 1 Through the extensive efforts of the Tox21/ToxCast initiatives, via testing hundreds of chemicals in more than a hundred high-throughput (HT) assays, the National Institute of Environmental Health Sciences (NIEHS) and EPA curated sets of reference chemicals for the ER, AR, and TR pathways2–4 that are relevant to in vivo animal studies, which have included the development of computational models for quantifying activity on ER and AR.3,5,6
Many studies, including several from our group,7–11 have described the development of HT high-content assays (HCAs) using the AR as a model system (reviewed in Campana et al. 12 ). However, the vast majority of efforts have been concentrated on nonnative and/or cell-free assays that measured several characteristics of the AR pathway, including ligand binding (e.g., NVS_NR_hAR in ToxCast), coregulator recruitment (via protein complementation assay, OT_AR_ARSRC1), reporter gene activation (Tox21_AR_Luc_MDAKB2, etc.), and nuclear translocation (GFP-AR8,9,13). More uniquely, we recently showed the novelty and usefulness of measuring endogenous AR levels across several 2D models, using HT microscopy (HTM) to characterize effects of EDCs, and identified bisphenol AP (BPAP) as a cell-line-specific AR downregulator. 11 In this study, we continued investigating the use of endogenous AR nuclear levels to analyze effects of chemicals with potential endocrine disruptor activity. When observing AR immunofluorescence images, the marked cell-to-cell variation in nuclear levels is obvious, especially following hormone treatment, a metric that was not considered in previous studies. Here, we use single-cell analysis metrics for quality control to describe the distribution of AR nuclear levels, and to measure changes in such distribution by modulating time, dose, and chemicals across several cell models.
Materials and Methods
Cell Culture and Treatments
Cell lines (MCF-7, T47D, BT474, MDA-MB-453, UMUC3, and A549) were obtained from the BCM Cell Culture Core, which routinely validates their identity by genotyping, or directly acquired from the American Type Culture Collection (ATCC, Manassas, VA). All cell lines were constantly tested for the absence of mycoplasma using DNA (DAPI) staining. Cell lines were routinely maintained in their standard media, as recommended by ATCC, except in phenol red-free conditions. Three days prior to experiments, cells were plated in media containing 5% charcoal-dextran stripped and dialyzed fetal bovine serum (FBS)-containing media. For all experiments, cells were plated at 3000 cells/well in Aurora Microplates (Whitefish, MT) 384-well microplates. Treatments were performed by adding a 2× solution of each chemical in media with final a DMSO concentration of <0.5%.
Chemicals
The EPA 45 reference plate 2 was kindly provided by Dr. Keith Houck (NIEHS).
Immunofluorescence
Immunofluorescence experiments were completed as previously described.
11
Briefly, cells were fixed in 4% formaldehyde in PBS and permeabilized with 0.5% Triton X-100 for 30 min. Cells were incubated at room temperature in blotto for 1 h, and then primary antibody (mouse monoclonal AR-441, 1:500, obtained from the Protein and Monoclonal Antibody Production Core, Baylor College of Medicine; or AR (N-20), 1:500, from Santa Cruz Biotechnologies, Dallas, TX) was added overnight at 4 °C prior to 1 h of secondary antibody (AlexaFluor conjugates; Molecular Probes, Eugene, OR) and DAPI staining. The AR N-20 antibody was used to create all the figures, while AR-441 was used in a third of the experiments (
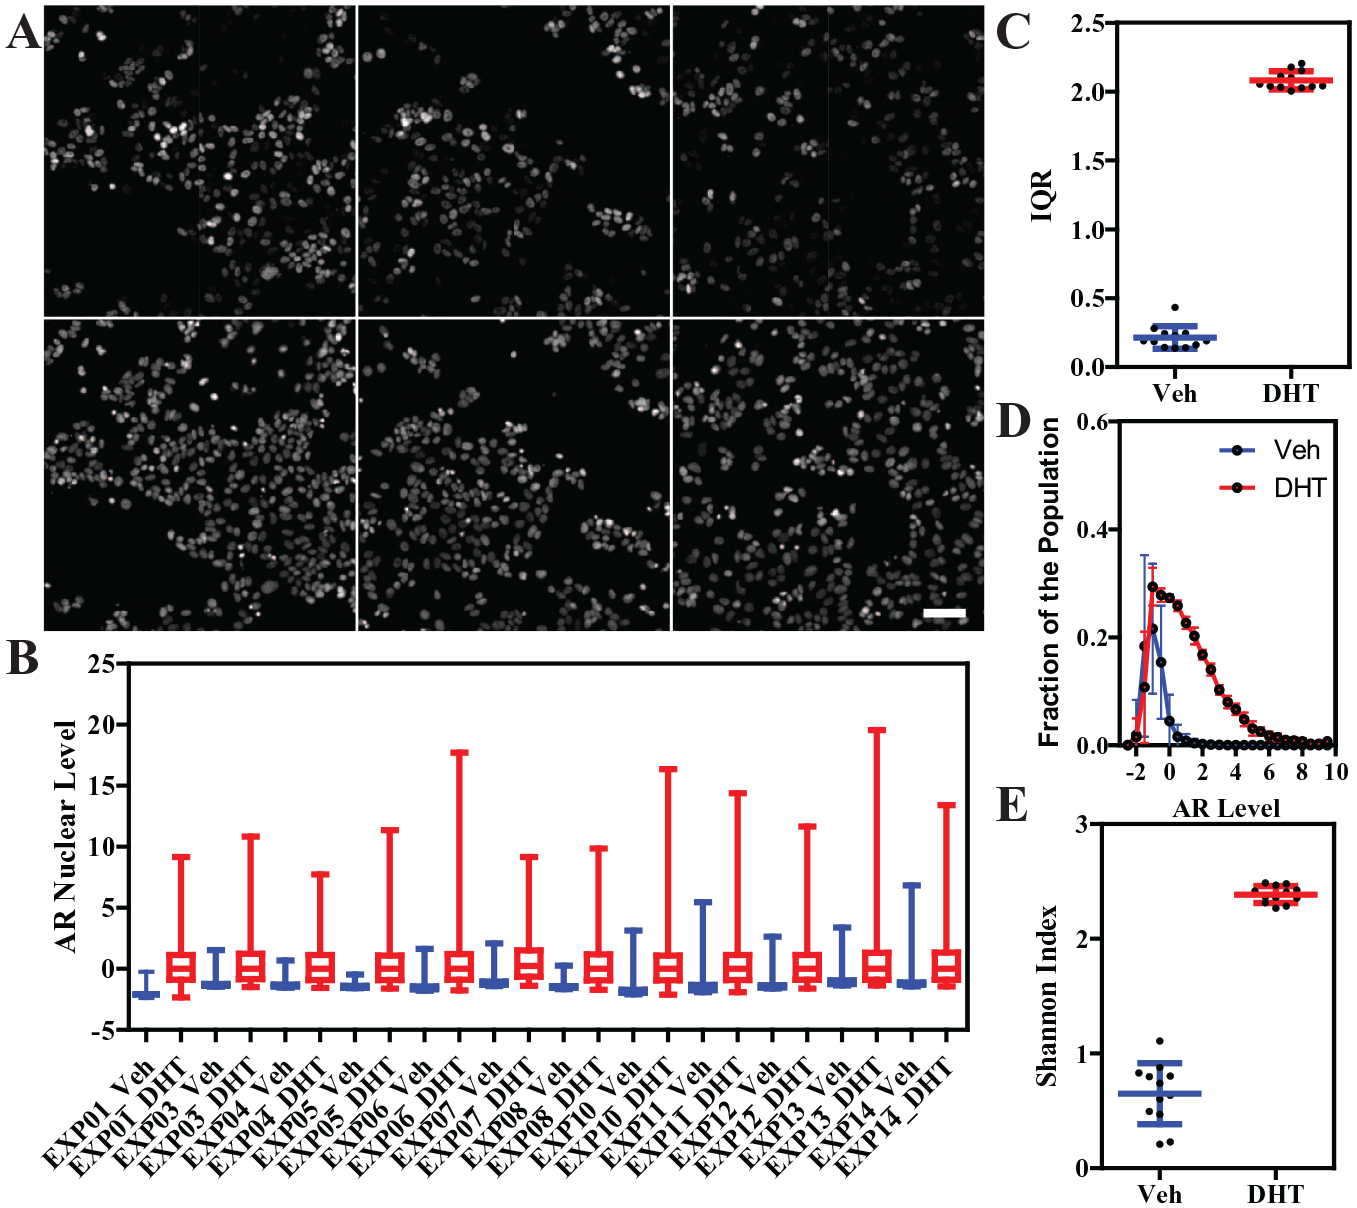
Variation in AR nuclear levels in MCF-7 cells. (
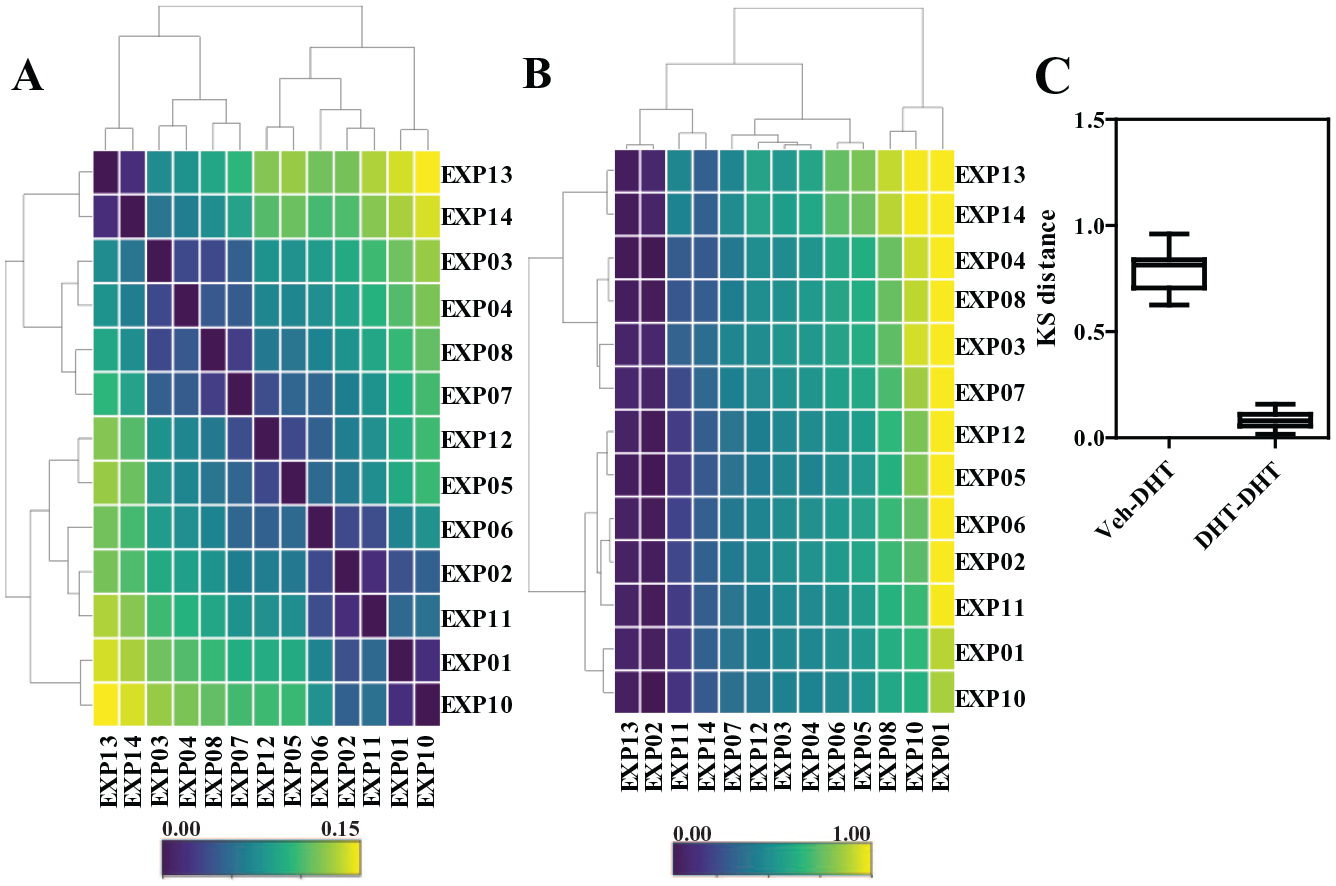
Kolmogorov-Smirnov (KS) test as a metric of quality control for nuclear AR distributions across independent experiments. (
High-Throughput Microscopy
Imaging (four fields per well) was performed on a Vala Sciences IC-200 (San Diego, CA) automated HT image cytometer with a 20×/0.75 objective and a standard filter set (DAPI/FITC/TRITC/Cy5). A 10 µm z-stack was acquired at 2 µm z-steps and max projected. The IC-200 is equipped with a solid-state light engine and an sCMOS camera. Excitation light intensity and exposure times were set in each experiment to fill ~70% of the dynamic range of the camera and were set based on the DHT-treated control wells, which are expected to be the brightest in the plate.
Image Analysis
Sixteen-bit grayscale TIFFs were imported into our custom, PipelinePilot-based software mIA (MyImageAnalysis) 14 for automated image analysis. Briefly, background subtraction was performed using a rolling ball algorithm, and nuclei segmented off the DAPI channel and filtered based on size and intensity to eliminate mitotic and dead cells and cellular debris. Mean pixel intensity values for the AR channel were then extracted and used for subsequent analysis (labeled as “Nuclear AR levels” in the figures).
Data Analysis and Statistics
Single-cell data were first median and then median absolute deviation (MAD) normalized based on DHT 100 nM samples (selected as positive control treatment), as the AR distribution is nonnormal. For histogram and calculation of the Shannon index, 27 the data were divided into 25 bins, based on the square root of the smallest number of experimental observations. To measure the distance between experimental distributions across replicates, a two-sample Kolmogorov–Smirnov (KS) test was applied. Heatmaps were generated in Python and Orange. 15 Graphs and curve fitting were created in GraphPad Prism (San Diego, CA). ToxPi 16 was used to calculate ToxPi scores, after range normalization, and to generate pie charts. We performed a minimum of two biological replicates (i.e., for the EPA 45 compounds screen) with at least four technical replicates per treatment.
Results
Analysis of AR Nongenetic Heterogeneity by HT Imaging
Based on our previous study,
11
AR immunofluorescence of MCF-7 cells revealed that DHT treatment for 24 h resulted in a marked increase of the mean nuclear levels of AR; moreover, the cell-to-cell variation was very high (up to two logs), representing a good example of nongenetic or phenotypic heterogeneity in the steroid hormone field. (
To directly compare and quantify the distance between distributions of DHT-treated AR cells across multiple experiments (13 independent biological replicates, each with a minimum of 4 technical replicates per treatment), we employed a pairwise two-sample KS test (
The KS test metric thus can then be used as a quality control method to classify whether or not experiments/wells/treatments are good or bad, for example, when the KS value exceeds three times the standard deviation of the mean value from good experiments. Alternative QC methods could also be employed, as shown by Gough et al.17–19 and by other novel pipelines in development (Stossi et al., manuscript in preparation).
AR Single-Cell Distribution across Multiple Cell Models
As AR is expressed in many models from different tissues of origin, we performed AR immunofluorescence in 384-well plates on five additional cell lines: three from breast cancer subtypes (T47D, BT474, and MDA-MB-453), one from lung cancer (A549), and one from bladder cancer (UMUC3). Images from 24 h DHT-treated cells’ AR immunofluorescence are shown in
Figure 3A
, along with DAPI staining for reference, and the distribution of AR levels across the population of vehicle versus DHT-treated cells (100 nM) is shown in
Figure 3B
. Apart from MCF-7 cells (
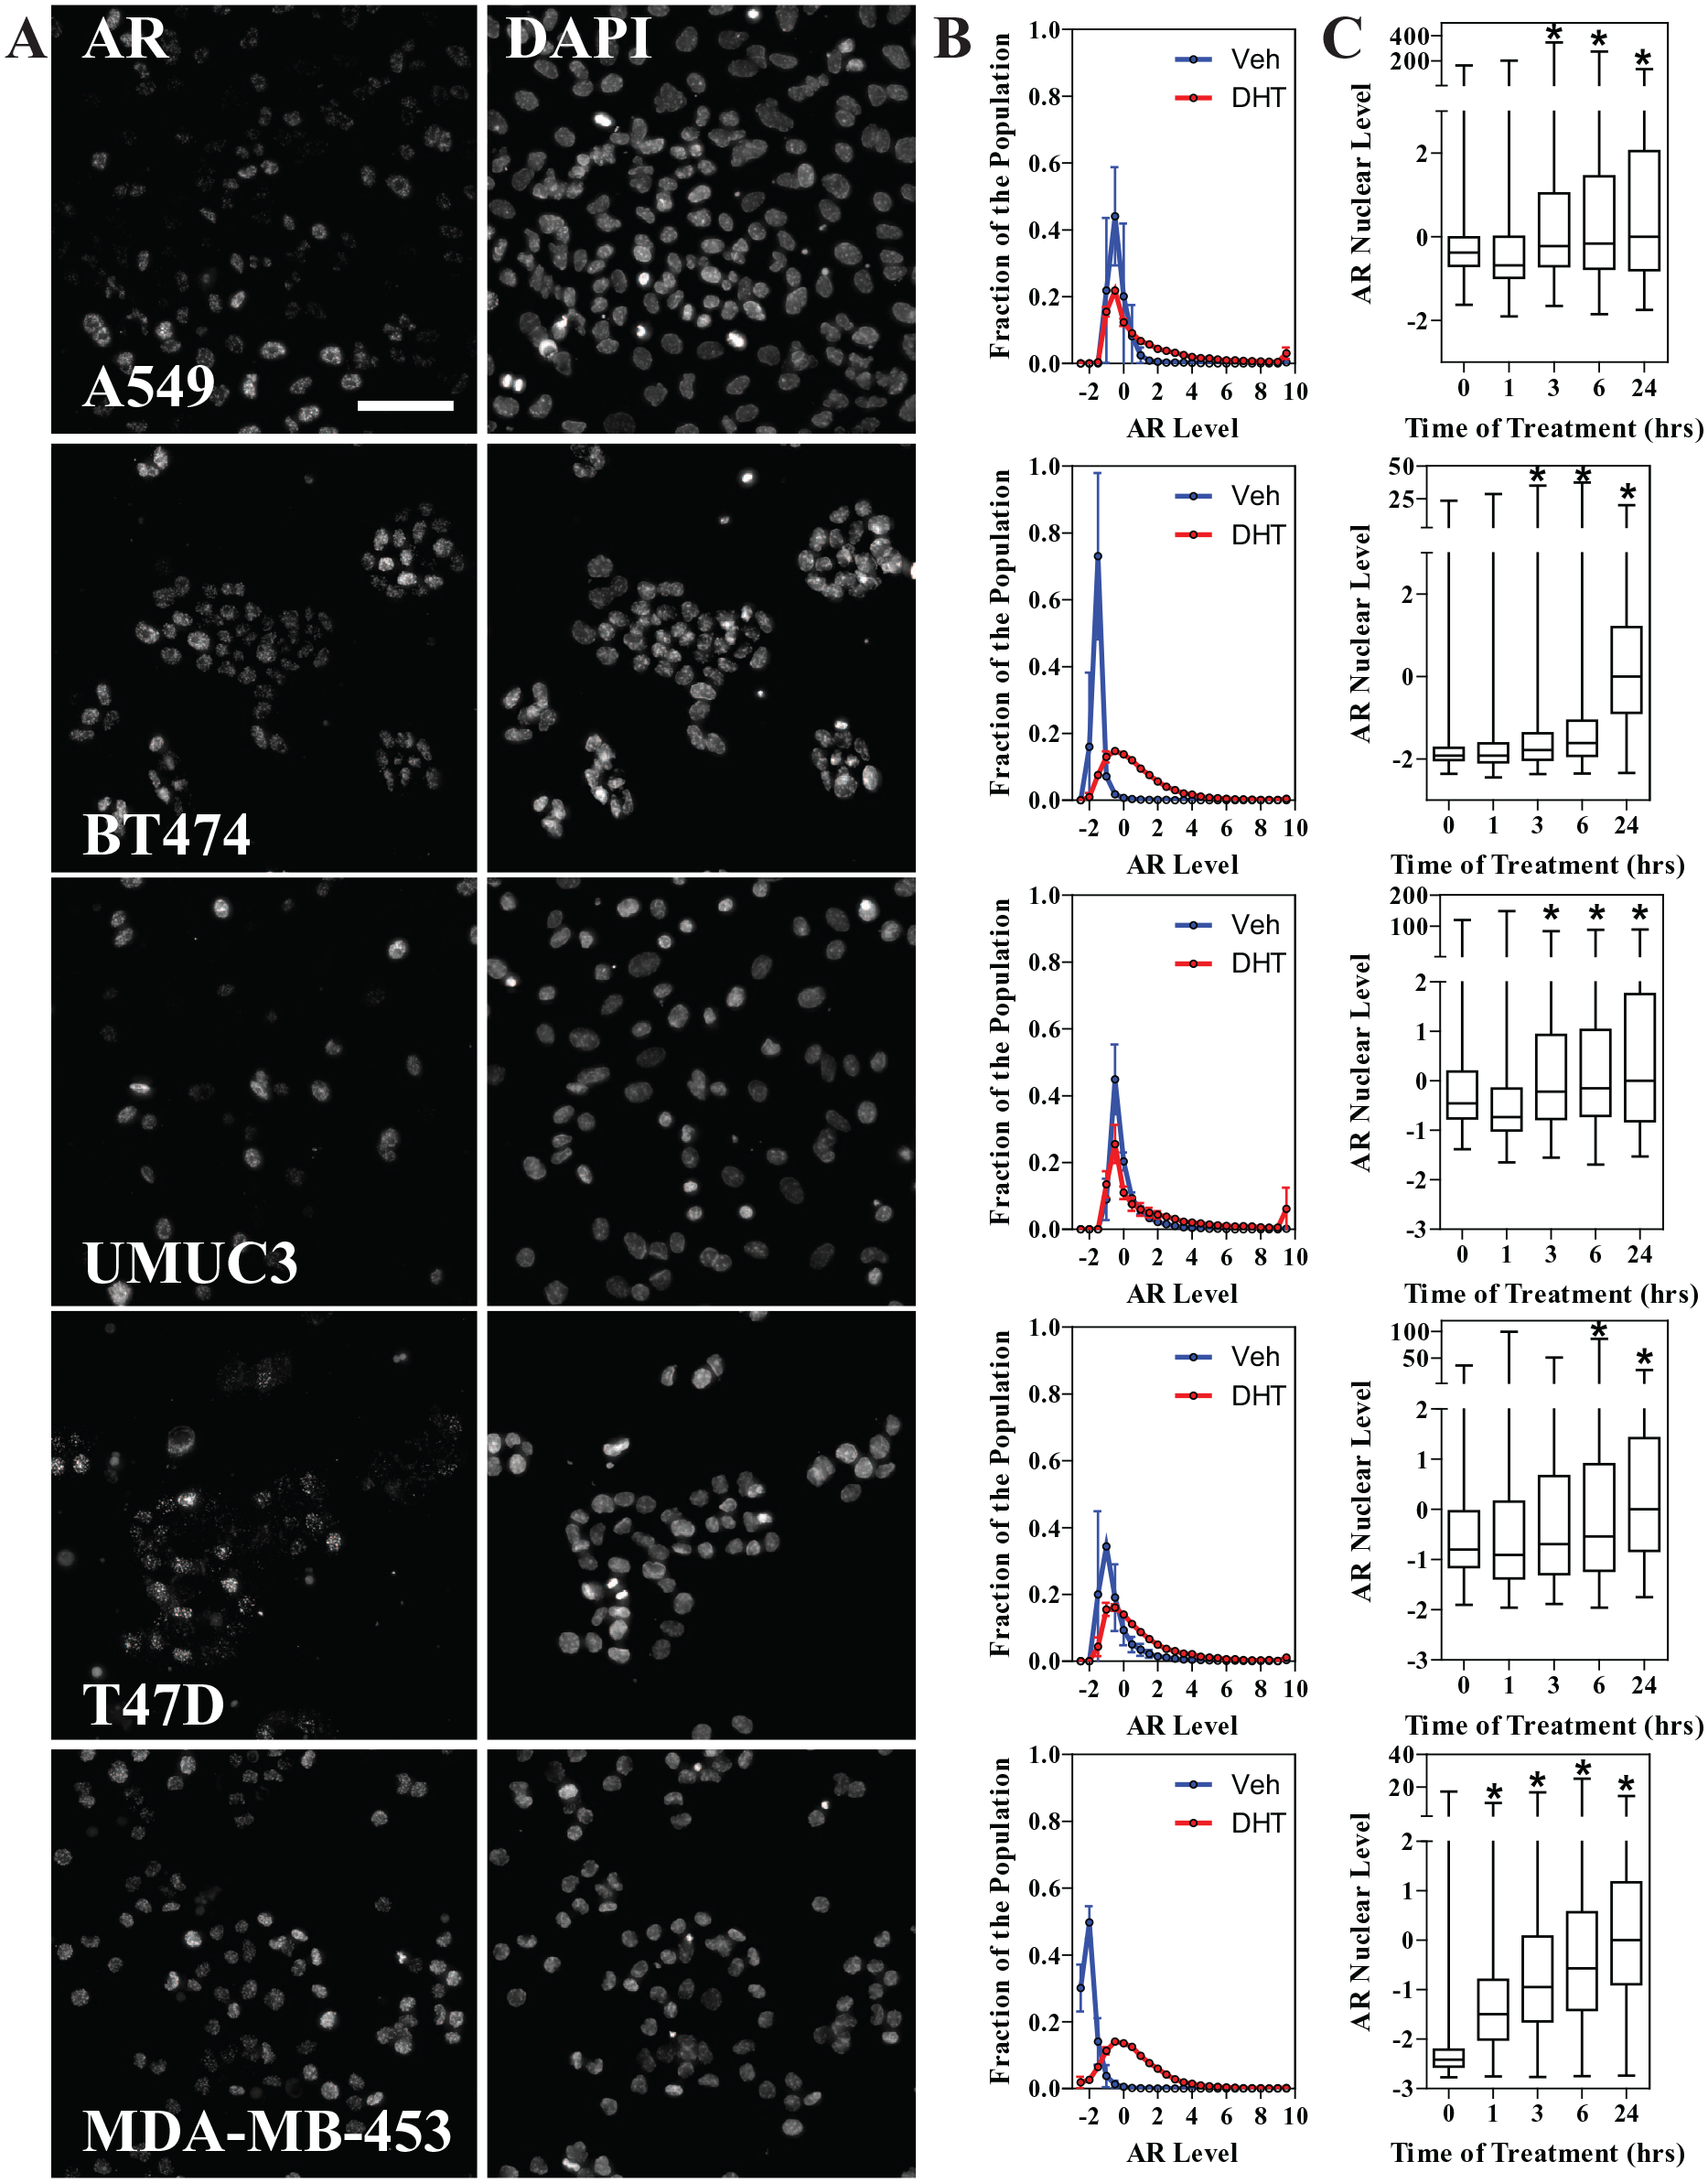
Single-cell AR distribution in other cell models. (
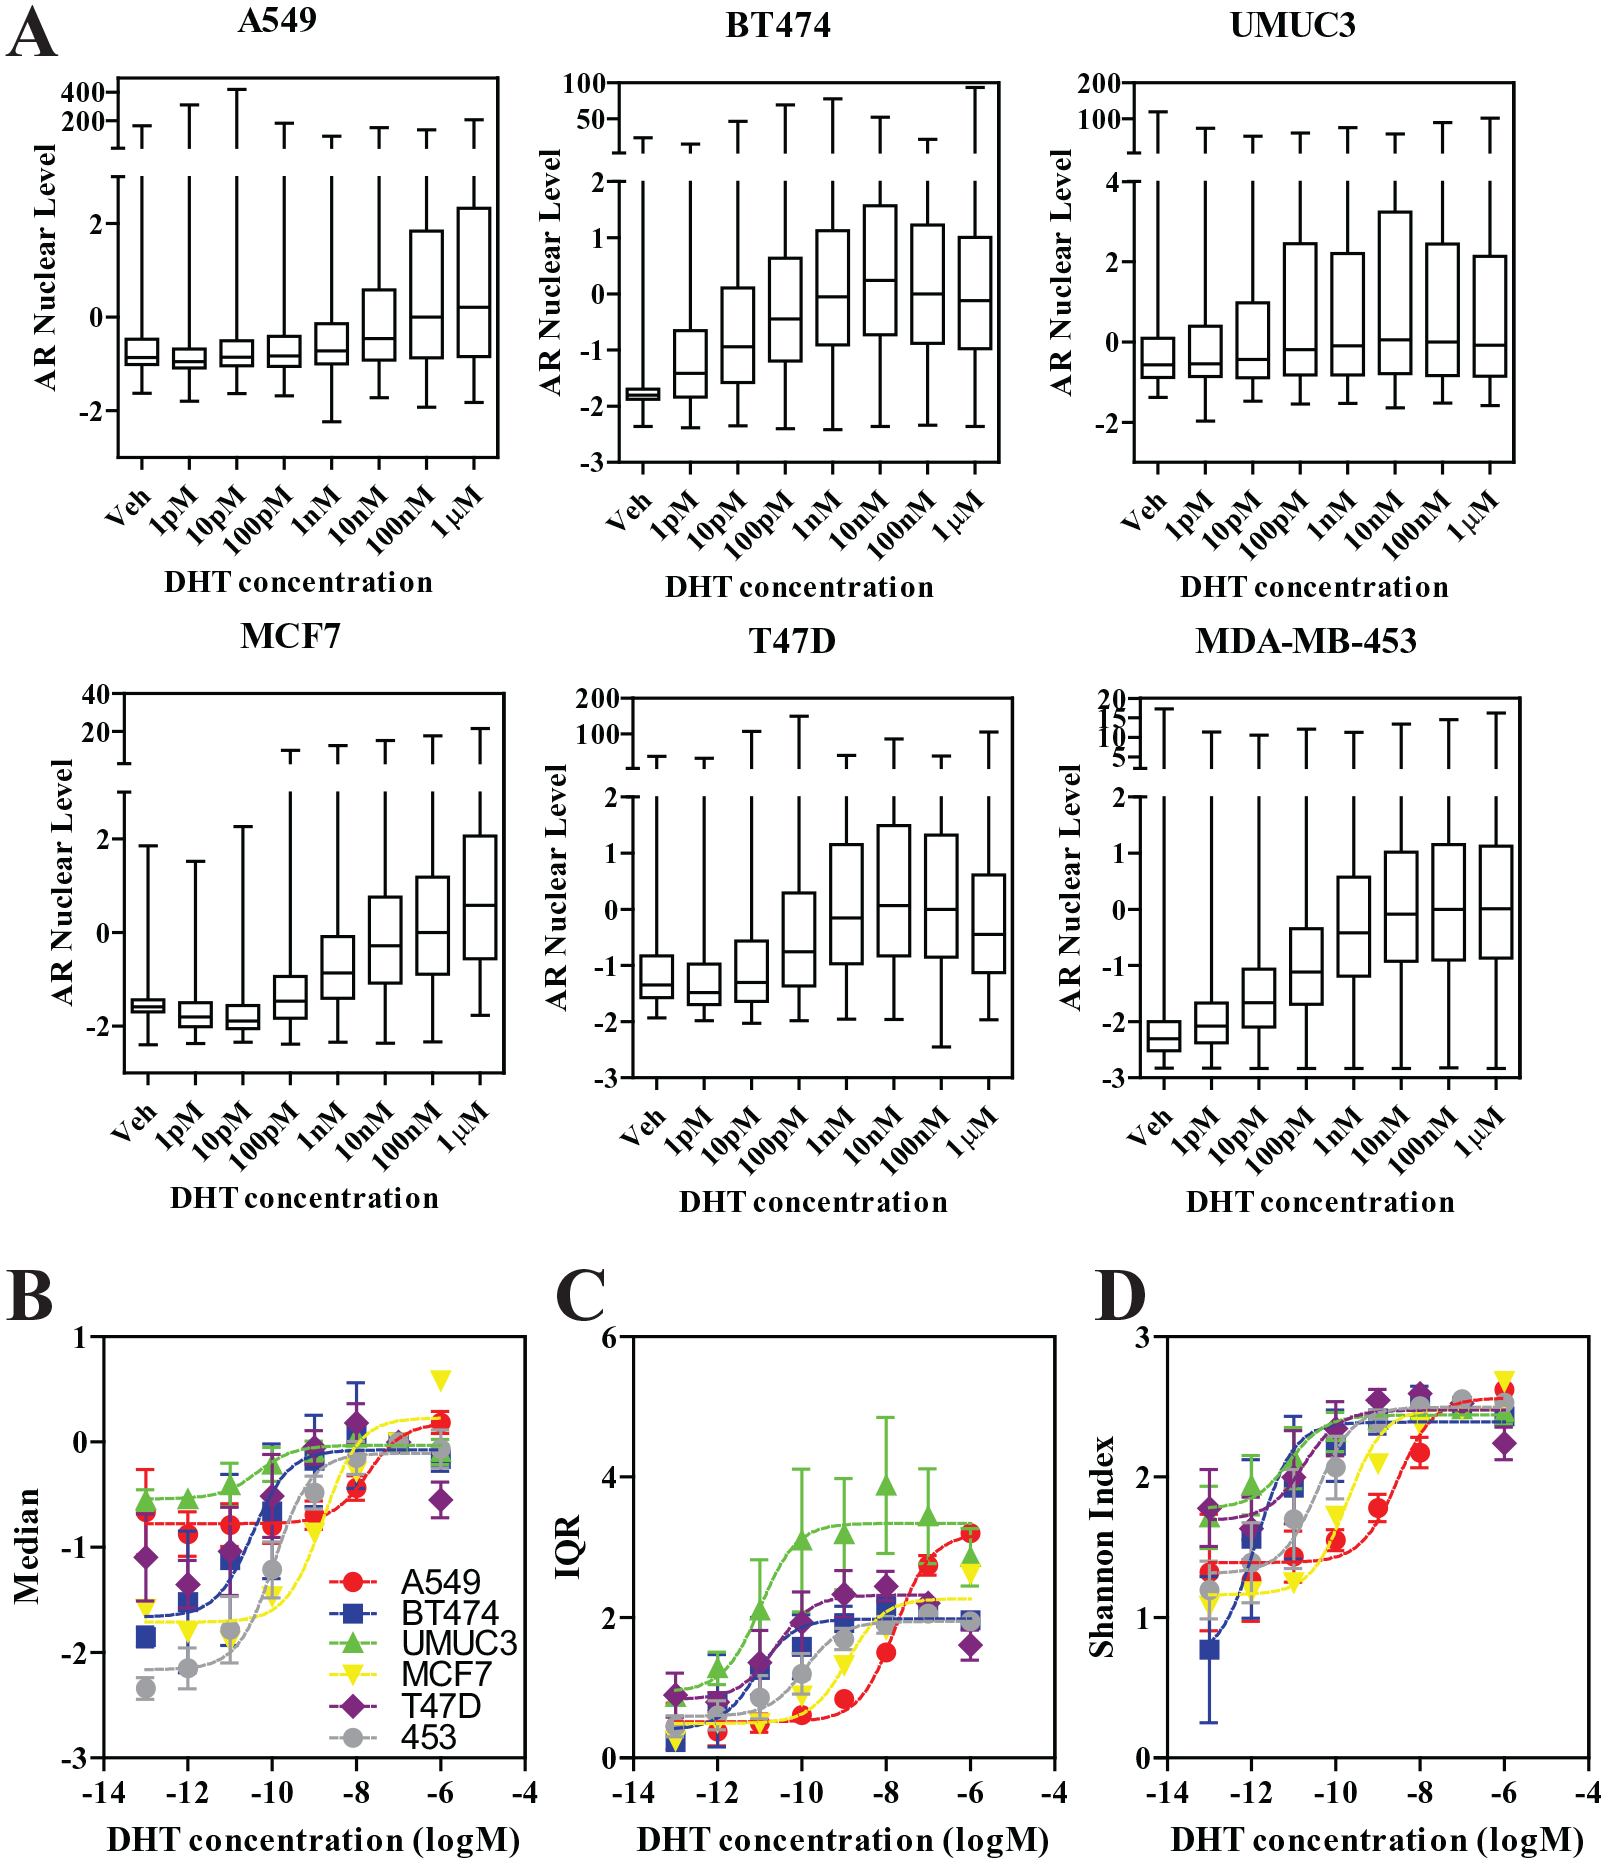
Various cell lines’ sensitivity to DHT as measured by single-cell AR levels. Seven-point DHT dose–response was performed in all cell lines at the 24 h time point. Data are shown as (
AR Changes upon a Set of Potential Endocrine Disruptor Chemicals
To determine if the described pipeline can be used to identify and quantify the effects of potential endocrine disruptor chemicals on the AR system, we tested a battery of 45 chemicals obtained from the EPA, and previously used as a benchmarking test for the ER (
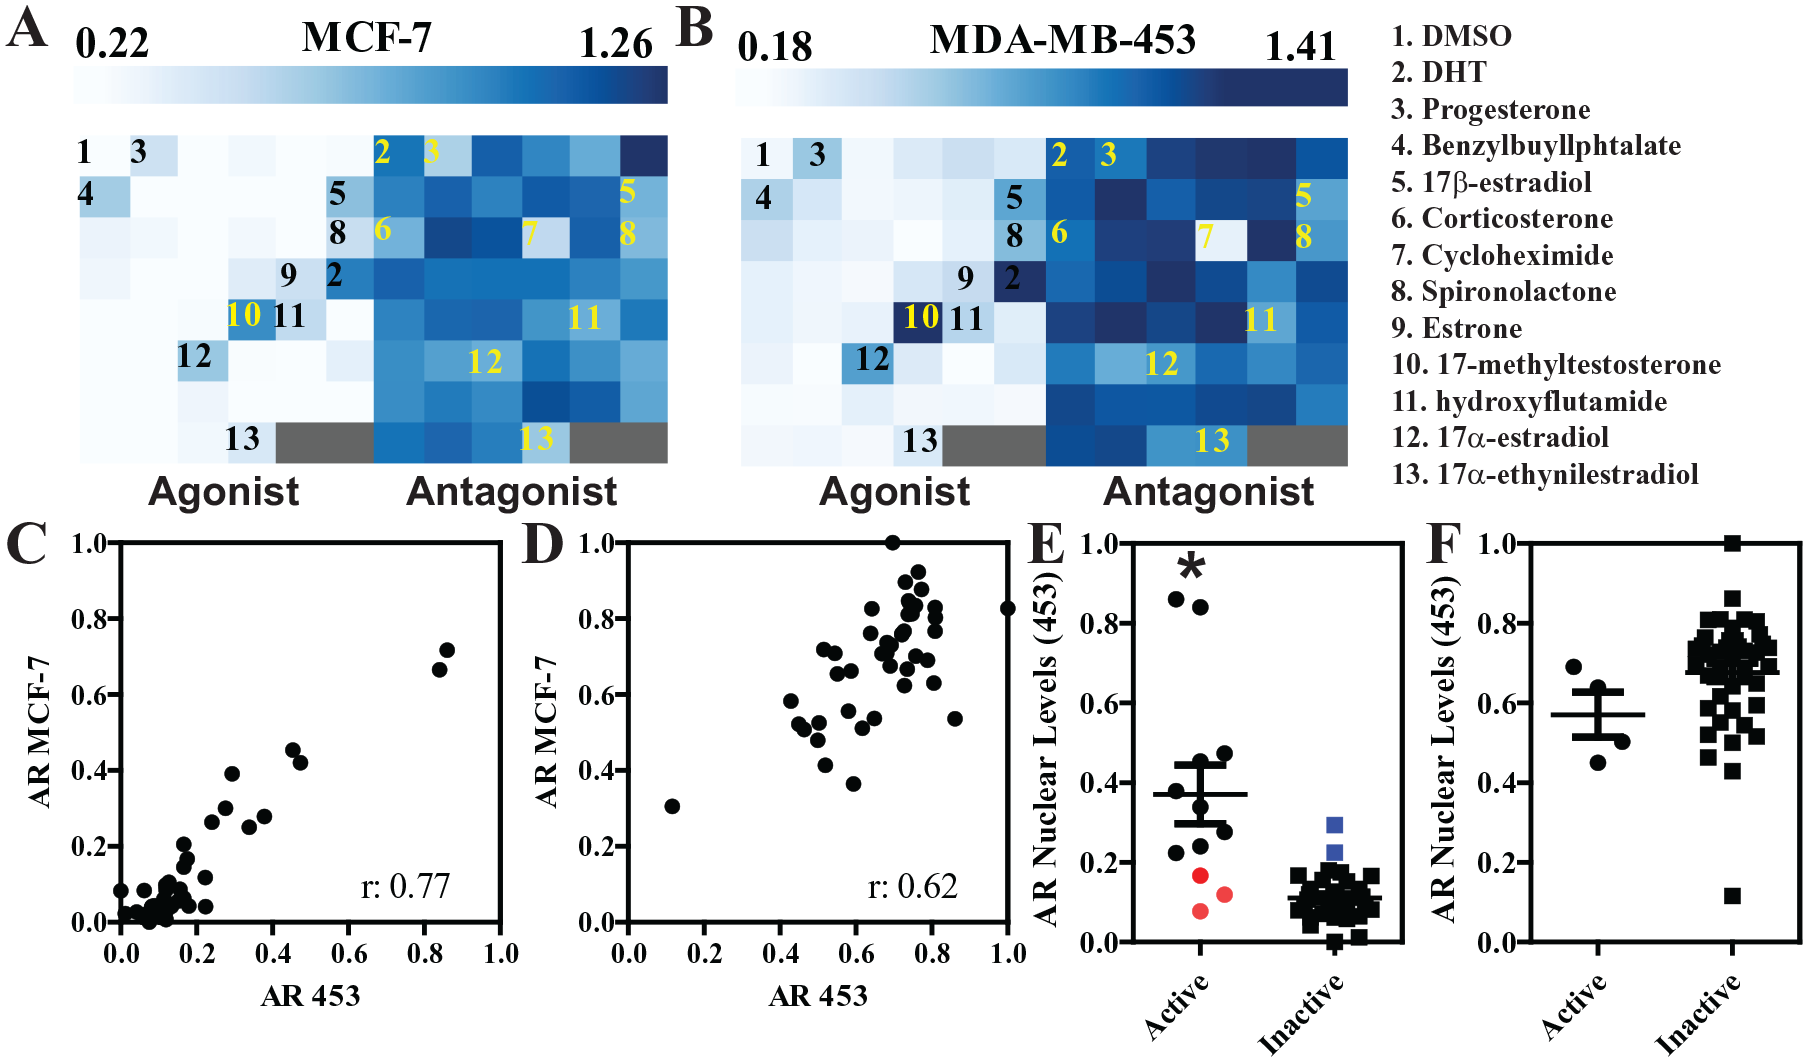
Changes in AR levels upon treatment with a panel of reference compounds. (
We then selected six of the potential hits (progesterone, 17-methyltestosterone, 17α-estradiol, benzylbutylphtalate, procymidone, and hydroxyflutamide) out of the 45 compounds for a more detailed dose–response analysis in MDA-MB-453.
Figure 6A
shows the dose–response curves for the three indexes used above (median AR level, IQR, and Shannon index) for the compounds treated either alone (blue dots) or together with DHT 100 nM (red dots) for 24 h. Four out of the six increased AR nuclear levels: 17-methyltestosterone reached similar effects as DHT, even when used at nanomolar levels, while other compounds had smaller effects (micromolar range). Perhaps interestingly, all six compounds showed antagonism of 100 nM DHT, some not effectively (e.g., 17β-estradiol and progesterone) and others being more active (e.g., hydroxyflutamide and procymidone).
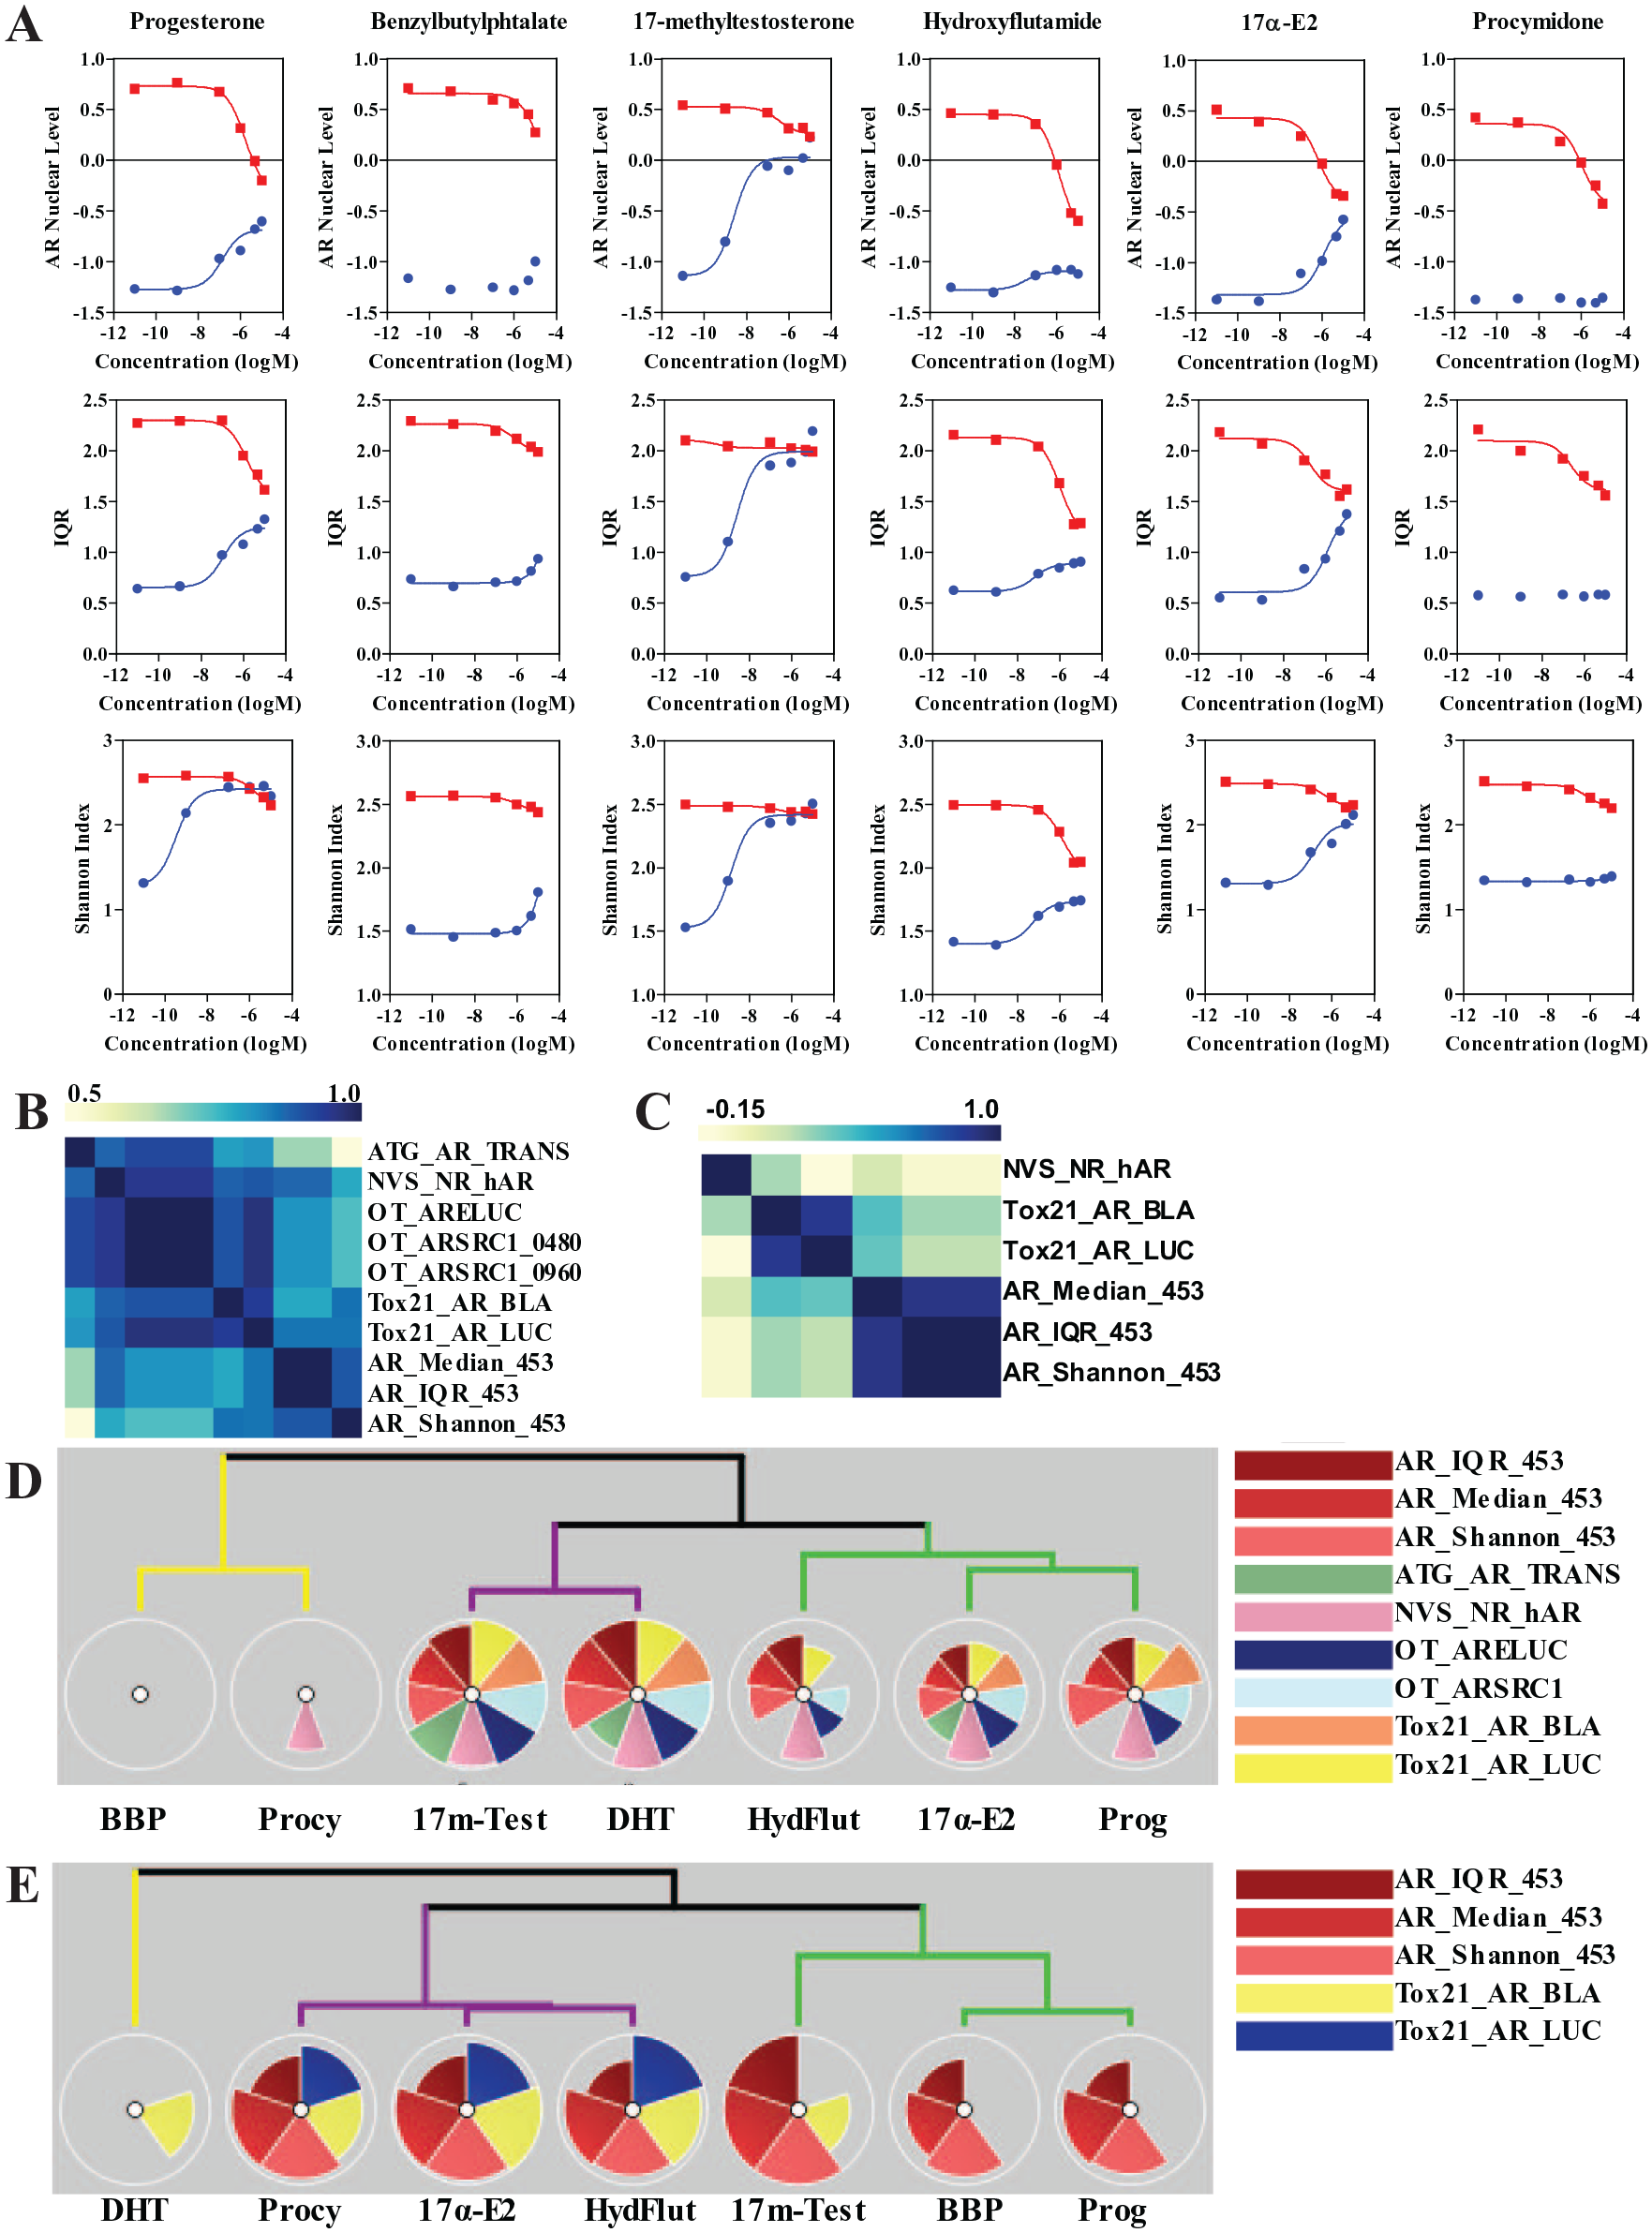
Characterization of six compounds affecting AR levels. (
We then used the ToxPi approach (toxpi.org
16
) to represent and cluster effects of the six compounds, as determined by the logEC50. ToxPi was developed for data integration and visualization of complex toxicological endpoints. Here we used it to integrate the data from the ToxCast initiative, which contains the indicated disparate assays, with our single-cell data.
Figure 6D
shows the clustering of the compounds when treated alone, which separates them into three groups: (1) compounds strongly active in all assays (DHT and 17-methyltestosterone), (2) less active compounds across most assays (hydroxyflutamide, 17α E2, and progesterone), and (3) largely inactive compounds (procymidone and BBP). The same was true in the antagonism mode (
Discussion
Endocrine-disrupting chemicals (EDCs) are a subclass of toxicants present in the environment that interfere with the action of endogenous hormones affecting central physiological pathways that can cause defects in, for example, reproduction and metabolism. While many efforts are in progress to define and classify potential EDCs, both computationally and experimentally, the universe of chemicals and their metabolites and mixtures remains a vast and untested black box. The ToxCast and Tox21 efforts, for example, spearheaded by the EPA and the National Toxicology Program (NTP), were designed to develop and qualify a large number of HT assays to test chemicals that cover a large set of biological pathways.1,23–26 One focus, in particular, has been to study three hormone nuclear receptors—ER, AR, and TR—which participate as transcription regulators in many essential physiological and pathological roles. Recently, computational frameworks obtained from the ToxCast datasets have been built for all three receptors and the in vitro to in vivo data revealed, at least for ER, that a set of in vitro assays can serve as a substitute for more expensive and time-taking in vivo assays.2,4,20 Perhaps one of the drawbacks of most current efforts is that the HT assays are largely out of context, meaning they are performed in test tubes (i.e., ligand binding assays) or using engineered cell models (i.e., luciferase assays or GFP-tagged proteins) that, inarguably, do not fully recapitulate the inherent complexity of endogenous systems. One such complexity, often ignored, is the intrinsic cell-to-cell variation in genetically homogeneous populations (phenotypic heterogeneity), a metric that is rarely used in HT assays17–19 and, to our knowledge, has never been used to assess EDC effects on nuclear receptors. In this study, we used the AR as a test case, following our previous observation that mean levels of AR per well were useful in identifying active agonists and antagonists; 11 here, however, we elected to extract and analyze single-cell data. First, we focused on MCF-7 breast cancer cells, where DHT treatment causes a large response in terms of increased nuclear AR levels, to determine whether or not single-cell distributions were reproducible across multiple experiments to the degree that we could use them as a metric when monitoring the effects of perturbagens. Indeed, using KS statistics, we showed that the distribution of AR levels in a cell population is quite reproducible across many biological replicates and distribution metrics can be described using the IQR and Shannon index. We then expanded our HT single-cell analysis to five additional cell lines of different origin and evaluated their DHT time- and dose-dependent changes in AR levels within the population. Perhaps not surprisingly, we found that the magnitude and sensitivity of response to DHT were cell line specific, spanning two orders of magnitude, highlighting how model choice and testing multiple models might prove beneficial to characterize perturbagens by single-cell analyses. We further tested this notion by treating two cell lines with a small library of 45 EPA-curated perturbagens that have been used in ToxCast analysis to build nuclear receptor models, which included several validated chemicals that are agonists and antagonists to many NRs. 2 We performed experiments in both agonist (compounds alone) and antagonist (compounds plus DHT) modes and identified several known androgens and antiandrogens. Because one of the cell lines we used (MDA-MB-453) was also part of the ToxCast effort,20,13 where it was engineered to contain an ARE-driven luciferase reporter gene, we could compare AR levels with an activity metric (e.g., gene expression). Overall, we found AR levels are quite well correlated with agonist responses, although they are not informative in terms of antagonism. Another important point, as in all HT screens, assay interference is a problem that is likely exacerbated in endogenous systems where more confounding events can, and do, experimentally occur—that is, modulating receptor levels due to stimulation of unrelated pathways (e.g., protein translation, gene transcription, protein degradation, and intracellular pathways). A clear example in this study is cycloheximide, a universal inhibitor of protein translation. While this can be seen as a drawback, it is also a more integrated way to identify effects of the target protein, and assay interference hits can be easily filtered out by combining endogenous with orthogonal assays, including those in ToxCast. In fact, we have shown here how the integration of single-cell metrics with orthogonal assays can be used to improve clustering of AR perturbagens. While this approach has been specific to an AR model, we anticipate that the quality control metrics of this approach have wide applicability to other single-cell-oriented HT HCAs designed to measure the effects of many types of perturbagens (ligands, small-molecule inhibitors, RNAi, etc.).
Supplemental Material
Supplemental_Material_Stossi_Resubmission – Supplemental material for Single-Cell Distribution Analysis of AR Levels by High-Throughput Microscopy in Cell Models: Application for Testing Endocrine-Disrupting Chemicals
Supplemental material, Supplemental_Material_Stossi_Resubmission for Single-Cell Distribution Analysis of AR Levels by High-Throughput Microscopy in Cell Models: Application for Testing Endocrine-Disrupting Chemicals by Fabio Stossi, Ragini M. Mistry, Pankaj K. Singh, Hannah L. Johnson, Maureen G. Mancini, Adam T. Szafran and Michael A. Mancini in SLAS Discovery
Footnotes
Supplemental material is available online with this article.
Declaration of Conflicting Interests
The authors declared no potential conflicts of interest with respect to the research, authorship, and/or publication of this article.
Funding
The authors disclosed receipt of the following financial support for the research, authorship, and/or publication of this article: M.A.M., F.S., M.G.M., and A.T.S. are funded by Project 4 as part of a NIEHS Superfund Research Program (P42ES027704; PI, Rusyn). M.A.M., F.S., H.L.J., R.M.M., M.G.M., and P.K.S. are supported via the CPRIT-funded GCC Center for Advanced Microscopy and Image Informatics (RP170719; PI, Mancini). M.A.M is also supported by NIEHS P42ES030285 (PI, Walker).Imaging is also supported by the Integrated Microscopy Core at Baylor College of Medicine with funding from NIH (DK56338 and CA125123), CPRIT (RP150578), the Dan L. Duncan Comprehensive Cancer Center, and the John S. Dunn Gulf Coast Consortium for Chemical Genomics.
References
Supplementary Material
Please find the following supplemental material available below.
For Open Access articles published under a Creative Commons License, all supplemental material carries the same license as the article it is associated with.
For non-Open Access articles published, all supplemental material carries a non-exclusive license, and permission requests for re-use of supplemental material or any part of supplemental material shall be sent directly to the copyright owner as specified in the copyright notice associated with the article.