
Abstract
Metabolomics is increasingly applied to investigate different individuals and time-dependent responses to environmental stimuli. Rapid data acquisition and improved detection limits of direct infusion mass spectrometry (DIMS) are paving the way for applications of metabolomics in preclinical screening, opening new opportunities in drug discovery and personalized medicine. Three-dimensional (3D) cell culture systems, which mimic the in vivo cell microenvironment, are well recognized as tissue and organ substitutes.
Here, we investigated cell viability and induction of reactive oxygen species (ROS) in stromal cells cultured in various 3D systems as well as the standard monolayer culture to evaluate which system provides the most favorable growing conditions. The selected 3D system was then tested for use in 3D co-culture of leukemia and stromal cells for DIMS-based high-throughput/high-content metabolic drug screens.
The NanobioMatrix–poly(ε-caprolactone) (NBM–PCL) scaffold resulted in the lowest ROS production, supported rapid cell proliferation, and was suitable for the 96- and 384-well plate formats. Doxorubicin treatment in leukemia co-cultured with stromal cells induced some unique metabolic responses that drastically differed from those observed in leukemia cells alone. The DIMS results also showed that the drug-induced metabolic modulations in both normal and cancer cells were weakened by co-culturing even at high treatment doses, thereby demonstrating the value of the 3D co-culture high-content metabolic drug screen. In conclusion, we optimized a high sample throughput method for 3D co-culture with a DIMS-based high-content metabolic drug screen and drug development.
Introduction
The drug discovery field is hindered by the unsuitability of animal models for large-scale screening. Furthermore, animal models may not adequately predict the clinical efficacy of therapeutics in humans. These limitations motivated researchers to develop new three-dimensional (3D) in vitro models to better mimic the in vivo microenvironment. 1 Many studies have been performed to compare the differences between two-dimensional (2D) and 3D culture systems, and have shown unique features of cells in 3D, including elevated differentiation potential, 2 increased drug resistance, 3 and remarkable genomic and transcriptomic phenotypes. 4
In an effort to model the bone marrow microenvironment for in vitro leukemia studies, stiff and porous scaffolds, as well as gels, have been used.5–10 Blanco et al. 7 compared acute myeloid leukemia (AML) cell growth on polymeric scaffolds made from different materials, and showed efficient cell expansion in collagen-coated scaffolds. Researchers have also tested scaffolds5,9,11–13 and gels8,14 to support the proliferation of bone marrow normal and stem cells, to mimic part of the bone marrow niche. More recently, researchers aimed to increase the complexity of the modeled microenvironment by co-culturing different cell types, and they focused on the protective effect that normal cells can exert on leukemia cells in 3D culture systems. Aljitawi et al. 5 co-cultured leukemia cells with mesenchymal stem cells on a polymer disc, and demonstrated the chemoresistance of cancer cells in 3D compared to those in 2D, in which scaffolds facilitate adequate interactions between cell types. Bray et al. 10 co-seeded endothelial and mesenchymal stromal cells with AML cells in matrix metalloproteinase–sensitive hydrogels, allowing for leukemic-vascular interactions. Other sophisticated and up-to-date models, such as the perfused 3D bone marrow analog 15 and chip-based biomimetic device, 16 have been studied, although the primary application of the latter one is in vivo engineering of the bone marrow.
While numerous 3D models have become commercially available, comparisons among these various 3D culture methods have been a neglected area of research. Some examples include the study by Cuddihy et al. 17 to replicate the bone marrow differentiation niche and compare the effects of three different gels on the growth of hematopoietic stem cells. Luckert et al. 18 compared HepG2 cells growing on three different 3D systems, but the main focus of the study was the increased metabolic competence on prolonged cultivation rather than a comparison of 3D culture systems. Among the disparate 3D models available, several can be scaled down to high-throughput formats for screening purposes, 19 thereby allowing to test a large number of compounds for improved drug discovery in a system that better mimics the specific microenvironment in the tissue of interest, including the concurrent presence of multiple cell types.
The role of cell metabolism in the mechanisms of response to drug treatment and the outcome of therapy has been increasingly recognized. 20 Therefore, an important aspect of drug discovery deals with the metabolic response induced in the cells by the compounds being developed. Along with the development of novel, economical high-throughput analytical methods, direct infusion nanoelectrospray high-resolution mass spectrometry (DI-nESI-HRMS) methods facilitate the characterization of metabolic phenotypes for assessment of systemic modulations. 21 Due to its high screening capability, fast analysis, and wider untargeted metabolite coverage than liquid chromatography–mass spectrometry (LCMS), direct infusion mass spectrometry (DIMS) represents a fast diagnostic tool. In this regard, instead of screening large libraries of chemicals for a particular biological activity in high-throughput assays, metabolomic assays can now be performed, providing a multifaceted understanding of the drug–cell interactions. 22 This enables the identification of potential biomarkers and may lead to a paradigm shift for the identification of drug candidates. In recent years, several drug discovery studies used omics techniques, 23 including small-scale metabolomics studies.24–26 Jie et al. 26 discussed the capability of a microfluidic chip with a mass spectrometer collection port that can be used for high-throughput, real-time metabolomic profiling, based on the analysis of the extracellular metabolites. Herman et al. 25 performed an LCMS-based metabolomics study in cells exposed to 27 chemicals, which can be used to build up data-processing pipelines for larger scale analysis. Thus, there is a need to test the efficacy of DIMS for characterizing the molecular responses of cell models in vitro on drug library inductions.
In this study, we have tested and compared several 3D culture systems to determine the best-suited support to obtain optimal cell growth based on cell viability (high) and induction of oxidative stress (low) in human bone marrow stromal HS5 cells. After selecting the 3D culture system that provided the best growing conditions for stromal cells and also was amenable to high-throughput formats (e.g., 96- and 384-well plates), we evaluated the feasibility of performing high-throughput/high-content metabolic drug screens in 3D co-culture systems coupling the stromal cells grown in 3D and leukemia cells, and we used DIMS to test drug response. As proof of principle of the applicability of DIMS metabolomics for high-throughput/high-content screens, we focused on a single drug (doxorubicin, a chemotherapy medication for treating leukemia) and showed that our methodology is able to acquire and quickly analyze robust metabolic data for high-content drug screening in 3D co-culture.
Materials and Methods
Reagents and Materials
Roswell Park Memorial Institute (RPMI) 1640 medium, fetal bovine serum (FBS), phosphate-buffered saline (PBS), L-glutamine, sodium chloride, DMSO, Hoechst 33342, and an ultra-low attachment plate (Nunclon Sphera Microplate) were purchased from Thermo Fisher Scientific (Waltham, MA). Allophycocyanin (APC) mouse antihuman CD90 and fluorescein isothiocyanate (FITC) mouse antihuman CD45 were bought from BD Biosciences (San Jose, CA). Polymer discs, including BiostructureMatrix (BSM; 2 mm thickness, 5 mm diameter, and randomly aligned fiber) and NanobioMatrix (NBM; 500 µm thickness, 5 mm diameter, and randomly aligned fiber), and 96-well scaffold plates (50 µm thickness scaffold, randomly aligned fiber, and low attachment bottom) were purchased from Synthecon (Houston, TX). The enhanced attachment microcarriers were from Corning (Corning, NY). Fibrinogen and thrombin from human plasma, calcium chloride, sodium hydroxide, and Eppendorf LoBind twin.tec PCR Plates were purchased from Sigma-Aldrich (St. Louis, MO). The PEGylation agent (SUNBRIGHT DE-034GS) was from NOF America (White Plains, NY). The Cultrex 3D Culture Matrix Rat Collagen I was bought from Trevigen (Gaithersburg, MD). CellTiter-Glo 2.0 Assay, ROS-Glo H2O2 Assay, and CellTiter-Glo 3D Cell Viability Assay were bought from Promega (Fitchburg, WI). AcroPrep 96-well filter plates [350 µL, 0.45 µm GHP (GH Polypro, a hydrophilic polypropylene) membrane] were purchased from Pall (Port Washington, NY). Doxorubicin was bought from Cayman (Ann Arbor, MI).
All chemicals for mass spectrometry (MS) were high-performance liquid chromatography (HPLC) grade, and all the aqueous solutions were prepared using ultrapure water (Milli-Q system; Millipore, Billerica, MA). Acetonitrile (ACN; ≥99.9%) and methanol (MeOH; ≥99.9%) were from Thermo Fisher Scientific (Pittsburgh, PA); MS calibration mixtures (Pierce LTQ Velos ESI Positive and Negative Ion calibration solutions) were also purchased from Thermo Fisher Scientific. Compounds for customized calibration, including pyruvic acid, sodium taurocholate, n-butylamine, and Met-Arg-Phe-Ala pentapeptide (MRFA), were purchased from Sigma-Aldrich. Water-soluble internal standards (ISs), including fumaric acid (2,3-D2, 98%), DL-glutamic acid (2,4,4-D3, 98%), tryptophan-d5 indole, d4 cystine, succinic acid (D4, 98%), D-glucose (1-13C, 98–99%), L-alanine (2,3,3,3-D4, 98%), L-aspartic acid (2,3,3-D3, 98%), citric acid (2,2,4,4-D4, 98%), L-glutamine (2,3,3,4,4-D5, 97%), glycine (2,2-D2, 98%), DL-malic acid (2,3,3-D3, 98%), L-serine (2,3,3-D3, 98%), and L-lysine (4,4,5,5-D4, 96–98%), were from Cambridge Isotope Laboratories (Tewksbury, MA).
Cell Lines, and 2D and 3D Culture Conditions
Human bone marrow stromal HS5 (American Type Culture Collection, Manassas, VA) and leukemia OCI-AML3 cell lines were maintained in exponential proliferation in RPMI 1640 supplemented with 10% FBS and 1% L-glutamine inside a 5% CO2 and 37 °C chamber. For the growth curve experiments, HS5 cells (2×10⁴ cells/well and three biological replicates) were seeded onto 2D and various 3D systems (listed in Table 1 ) in 96-well plates, and cultured for 7 days. Half of the medium in each well was removed and replaced with fresh medium every 24 h.
A List of 3D Culture Systems with Materials Indicated.
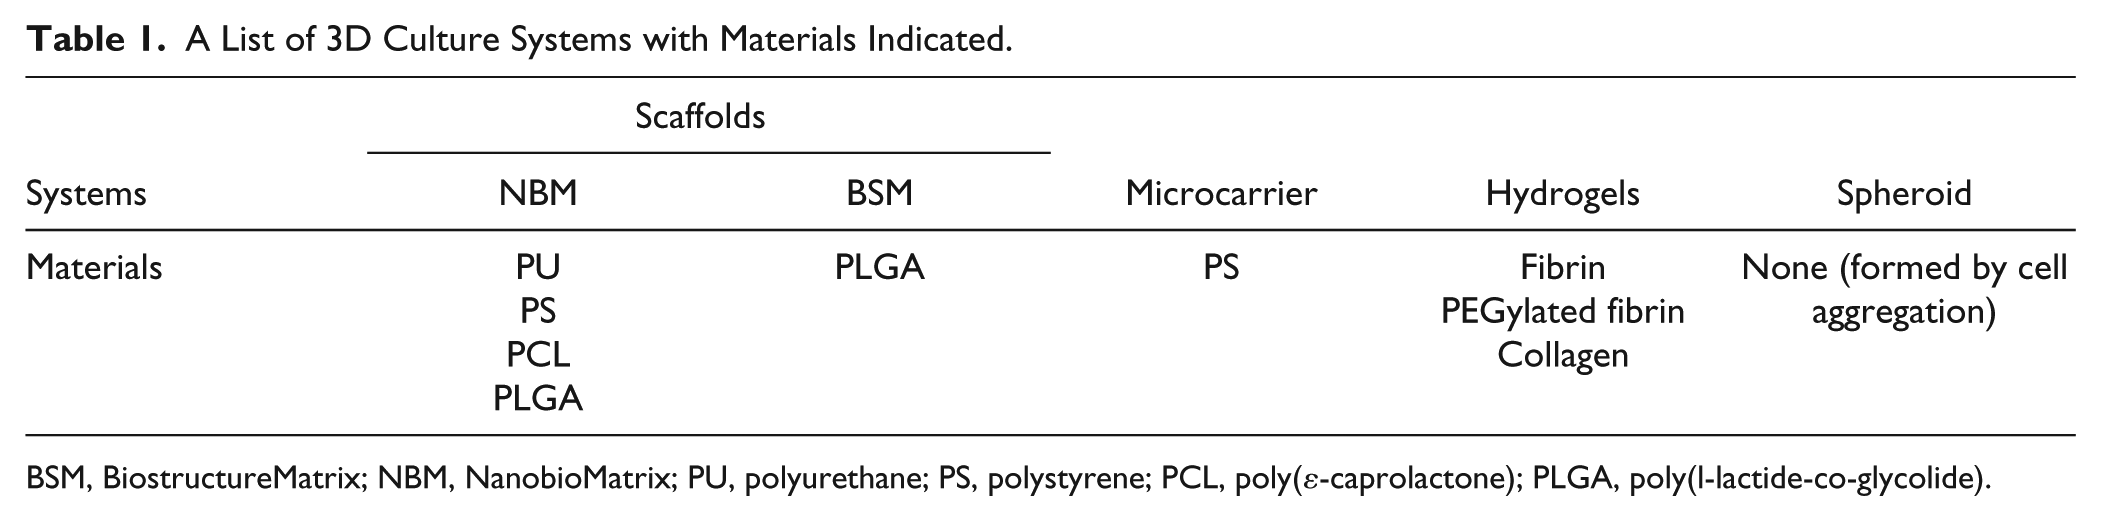
BSM, BiostructureMatrix; NBM, NanobioMatrix; PU, polyurethane; PS, polystyrene; PCL, poly(ε-caprolactone); PLGA, poly(l-lactide-co-glycolide).
Prior to cell seeding, all polymer discs [BSM–poly(l-lactide-co-glycolide) (PLGA), NBM–polyurethane (PU), NBM–polystyrene (PS), NBM–poly(ε-caprolactone) (PCL), and NBM–PLGA] were sterilized in 70% ethanol for 4 h, thoroughly rinsed in PBS twice and medium once, and then soaked in fresh medium overnight. Finally, before seeding HS5 cells onto the scaffolds, all the medium was aspirated thoroughly, and the cell suspension in the medium was added to the scaffolds. For cells growing on beads, microcarriers were added to a cell suspension in medium to make the final attachment area at 18 cm2/ml. All the gel-based systems (including fibrin, PEGylated fibrin, and collagen) were prepared according to protocols kindly provided by Laura Suggs’ laboratory (The University of Texas at Austin, TX), as previously described. 27 To induce the formation of spheroids, cells were placed in ultra-low attachment plates. Also, the cells cultured in all the 3D systems were seeded in ultra-low attachment plates to eliminate the possibility of cells attaching to the plate and expanding in 2D.
Confocal Microscopy
Cells in 3D culture were carefully washed with PBS and then incubated with pre-mixed antibodies (FITC-CD45, 1:40, BD Biosciences no. 561865; APC-90, 1:200, BD Biosciences no. 561971; and Hoechst, 1.5µg/ml, Thermo Fisher Scientific) in the dark for 30 min on a shaker. The cell culture was then transferred to a glass-bottom dish and put on the stage on an inverted Leica SP5 white light laser confocal microscope for imaging. All the high-resolution images were taken with either 40× (1.25 NA) or 63× (1.4 NA) oil objective, except the NBM–PCL with a 20× (0.7 NA) dry objective.
Cell Viability and Redox Status
The cell viability and redox status of HS5 stromal cells were assessed daily throughout a 7-day growth period, using multiplexed CellTiter-Glo 3D Cell Viability Assay and ROS-Glo H2O2 Assay, according to the manufacturer’s protocol. Briefly, 6 hours prior to each time point, 20 µl of the H2O2 substrate solution was added to the cells in the different culture systems, and then the cells were placed back into the incubator. For reactive oxygen species (ROS) measurement, prior to each measurement, 100 µl of media from each well was mixed with 100 µl ROS detection solution in a separate 96-well plate (opaque), and equilibrated for 20 min before measuring luminescence. For adenosine triphosphate (ATP) measurement, after withdrawing the media for the ROS reading, 100 µl ATP detection solution was added to each well of the original cell culture plate and mixed on an orbital shaker at 700 rpm for 2 min. After 10 min, 100 µl of the mixture from each well was transferred to another 96-well plate (opaque) for the luminescence measurement. Cell viability (ATP measurement) and oxidative stress rates (ROS measurement) were reported with significance from a two-sample Student’s t test set at p-value <0.05.
Sample Preparation for DIMS-Based Metabolic Analysis
Prior to performing the DIMS-based metabolomic analysis on cells co-cultured on the 3D scaffold, the cell-washing and sample preparation procedures were optimized. Two cell-washing solutions, saline and PBS, were compared to check their effects on the sensitivity of the DIMS experiments. OCI-AML3 cells were cultured in a standard 96-well plate in complete medium. Cells were then harvested and washed twice on a 96-well filter plate (350 µL, 0.45 µm GHP membrane) with either cold saline or cold PBS. Cells were then extracted according to the procedure described below.
For the metabolic analysis of treated cells co-cultured in 3D, HS5 cells were seeded on the NBM–PCL scaffold (50 µm thickness) in a 96-well format, at a density of 50,000 cells/well. Cells were cultured for 24 h before adding 100,000 OCI-AML3 cells/well together with fresh medium. Cells were treated with DMSO (0.1%) as solvent control, or with various doses (100 nM, 200 nM, or 300 nM) of doxorubicin for 24 h (four replicates each). At the end of treatment, suspension cells (OCI-AML3) were aspirated out with all the medium, and washed on 96-well filter plates (350 µL, 0.45 µm GHP membrane) with cold saline (pH 7.4) twice by centrifugation, while adherent cells were washed twice in the original wells. Two blanks were included.
In all cases, harvested cells were extracted in 50 µL of 2:2:1 ACN/MeOH/H2O (spiked with ISs) and filtered to a PCR plate at 100×g for 1 min. During the entire harvesting and extraction procedure, samples were maintained at 4 °C or on ice. Quality controls (QCs) were generated prior to heat-sealing for 2 s. Samples were stored at −80 °C until metabolomics analyses.
DIMS-Based Metabolomics Analyses
The sample plates were thawed on ice and then centrifuged at 2500×g for 10 min (4 °C) before injection. The analyses were performed on a Q Exactive Hybrid Quadrupole-Orbitrap Mass Spectrometer equipped with an automated chip-based nanoelectrospray ionization (nESI) source (TriVersa NanoMate, Advion, Ithaca, NY). Nanoelectrospray conditions comprised 30 s acquisition time per ionization mode, 5 µL injection volume, 0.4 psi gas pressure, and 1.3 kV voltage controlled by ChipSoft software (version 8.3.3; Advion). MS was operated in positive and then negative full-MS modes under the following parameters: capillary temperature, 250 °C; microscans, 1; automatic gain control (AGC) target, 1e6; mass resolution, 70,000; and mass-to-charge ratio (m/z) range, 50–750. Calibration of the mass spectrometer was achieved as previously described. 28 Blanks were run before and after the whole acquisition, and one QC sample was injected every six samples. Tandem mass spectrometry (MS/MS) data were acquired on a QC sample for metabolite identification. Samples were kept at 4 °C during the entire sequence.
Statistical Analyses of DIMS Data
Raw data from DIMS were converted into mzXML files by MSConvert 29 and processed by in-house MATLAB scripts. Detected mass features were putatively assigned by comparing to accurate mass databases, including an in-house spectral library [IROA 300, Mass Spectrometry Metabolite Library of Standards (MSMLS); IROA Technologies, Bolton, MA]. To visually verify that metabolic changes were in fact induced and detected in the cells following treatment, all putatively assigned features with a coefficient of variation (CV) lower than 25% in the QC samples were used to perform an unsupervised multivariate analysis (principal component analysis, or PCA) using PLS-Toolbox (Eigenvector Research, Manson, WA) after log transform.
For a more in-depth metabolic analysis, among the putatively assigned features with a CV <25%, those associated with a Kyoto Encyclopedia of Genes and Genomes identification (KEGG ID) and having at least one treatment significantly different (based on Student’s t test, p < 0.05) from the corresponding control (in any cell type or any culture condition) were considered further for the metabolic analysis. To maintain a relatively high sample throughput also in the data analysis, no additional assigned metabolites were excluded from the analysis.
Results
Selection of the 3D Culture System Providing Optimal Growth Conditions for Stromal Cells
Commercially available 3D culture systems were picked for evaluation and compared to the monolayer 2D culture based on their suitability for high-throughput format. We investigated the geometry and material associated with the highest growth rate and the lowest induction of ROS in HS5 stromal cells. To achieve this, HS5 cells were cultured in 2D and various 3D systems (listed in
Table 1
). Confocal microscopy images were captured at representative layers, following staining with Hoechst and CD90-APC, to assess the morphology of cells grown in 3D using different methods and supports (
ATP bioluminescence and ROS production assays were performed to assess cell viability and redox status, respectively. Both ATP and ROS were measured daily for 7 days. The results throughout the 7-day growth period are shown in
Figure 1
. The ATP bioluminescence level increased at the fastest rate in HS5 cells cultured as a monolayer (2D) and started to approach a plateau at day 5, due to cell confluency. Throughout the experimental window, cells growing as spheroids resulted in almost unchanged or slightly decreased ATP levels as well as extremely high ROS readings, indicating that HS5 cells did not grow well in the form of spheroids (in agreement with previous reports
30
). The ATP bioluminescence levels increased relatively steadily for HS5 cells expanding on the surface of microcarrier beads, while the ROS readings progressively decreased. Among the gel-based 3D systems, the collagen gel produced extremely low ATP bioluminescence readings [close to zero, compared to values typically in the order of 105 relative luminometer units (RLU); data not shown], which could be due to halted cell growth. Concurrently, a very high level of ROS production was detected (data not shown). HS5 cells seeded in the fibrin or PEGylated fibrin gels grew at relatively steady rates through the 7-day monitoring period, and at a similar level as the cells on microcarriers. Simultaneously, the level of ROS also closely resembled the progressive decrease observed for cells on microcarriers. The fibrin gel started to coagulate at day 5, however, while the PEGylated fibrin remained stable until the end of the 7-day experiment. In addition to the spheroids, microcarrier beads, and gel systems for culture of cells in 3D, we looked at various more recently marketed scaffolds characterized by different structures (NBM versus BSM) and materials [polyurethane (PU), polystyrene (PS), poly(ε-caprolactone) (PCL), and poly(l-lactide-co-glycolide) (PLGA)]. After remaining mostly stable, if not slightly decreased, during the first 2–3 culture days, all the scaffolds except the NBM–PLGA resulted in larger increases in ATP bioluminescence by the end of the 7-day experimental period than the spheroids, microcarrier, and gel 3D systems. The increase did not, however, match the larger increase observed for cells grown in monolayer (2D). Moreover, among the scaffolds inducing the largest increases in ATP bioluminescence, NBM–PU and NBM–PCL produced the lowest ROS levels throughout the 7-day experiment (
Fig. 1
). Notably, the ATP/ROS ratio ranks highest on days 5–7 in NBM–PCL (
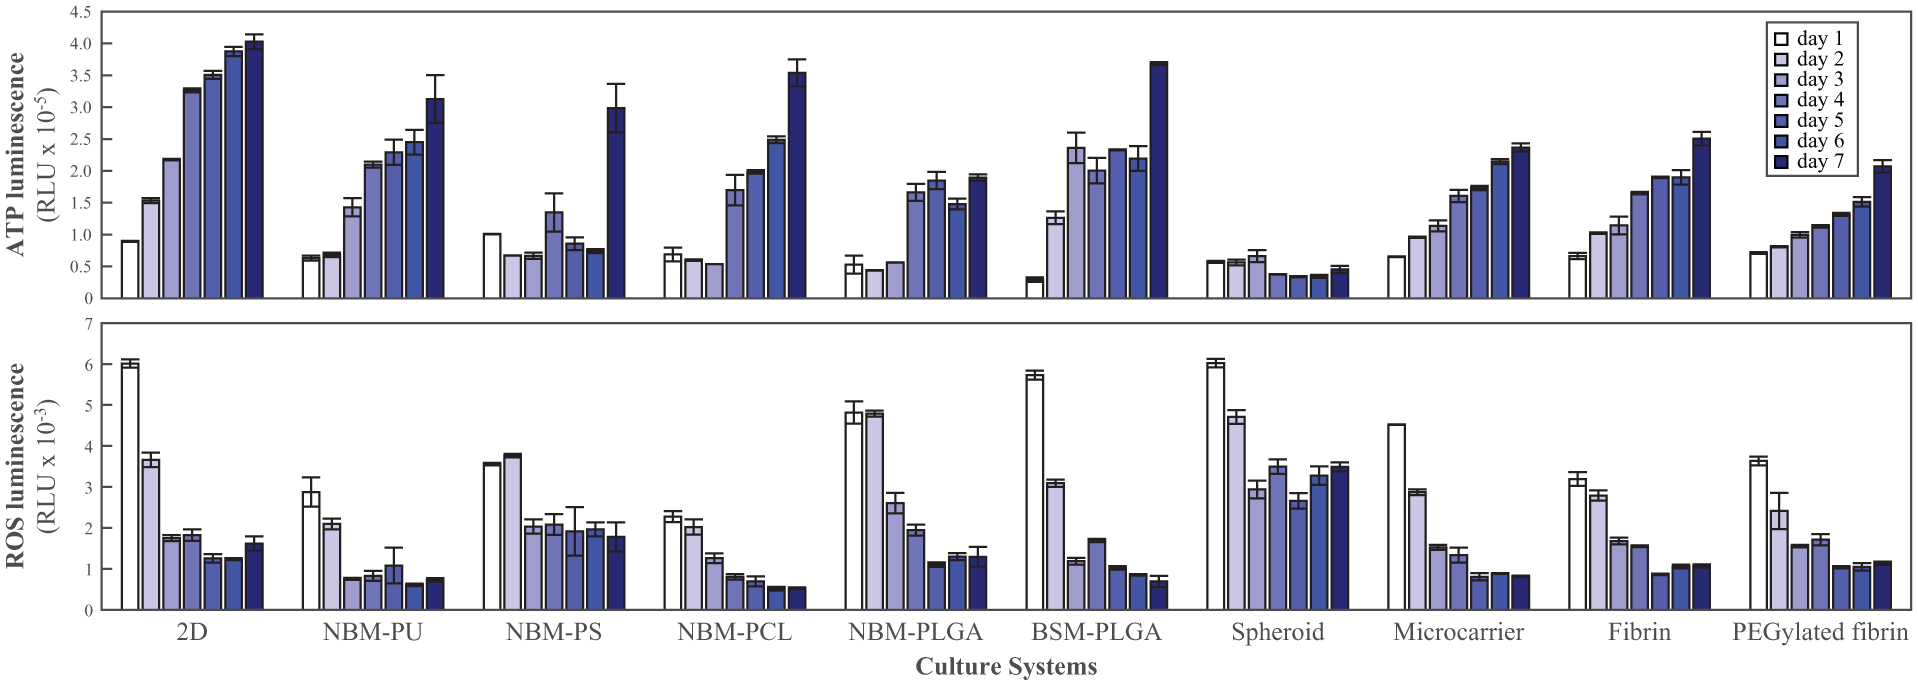
Cell viability [adenosine triphosphate (ATP) bioluminescence] and redox status [reactive oxygen species (ROS) production] by human bone marrow stromal (HS5) cells during 7 days of culture in a two-dimensional (2D) system, NanobioMatrix–polyurethane/polystyrene/poly(ε-caprolactone)/poly(l-lactide-co-glycolide) (NBM–PU/PS/PCL/PLGA), BiostructureMatrix (BSM)–PLGA, spheroid, microcarrier, fibrin, and PEGylated fibrin. RLU, Relative luminometer units.
The steady ATP level during the first 2–3 days would indicate very limited cell growth at the early stages of the experiment, likely as a result of a long initial lag period associated with the very low cell density (relative to the large surface area available for growth). Consequently, we increased the seeding density from 2×10⁴ to either 5×10⁴ or 1×10⁵ cells per well to evaluate whether, under these conditions, HS5 cell growth improves at the early stages of the experiment. ATP and ROS bioluminescence were measured again in all systems after 24, 48 and 72 h, and the results are shown in Figure 2 .
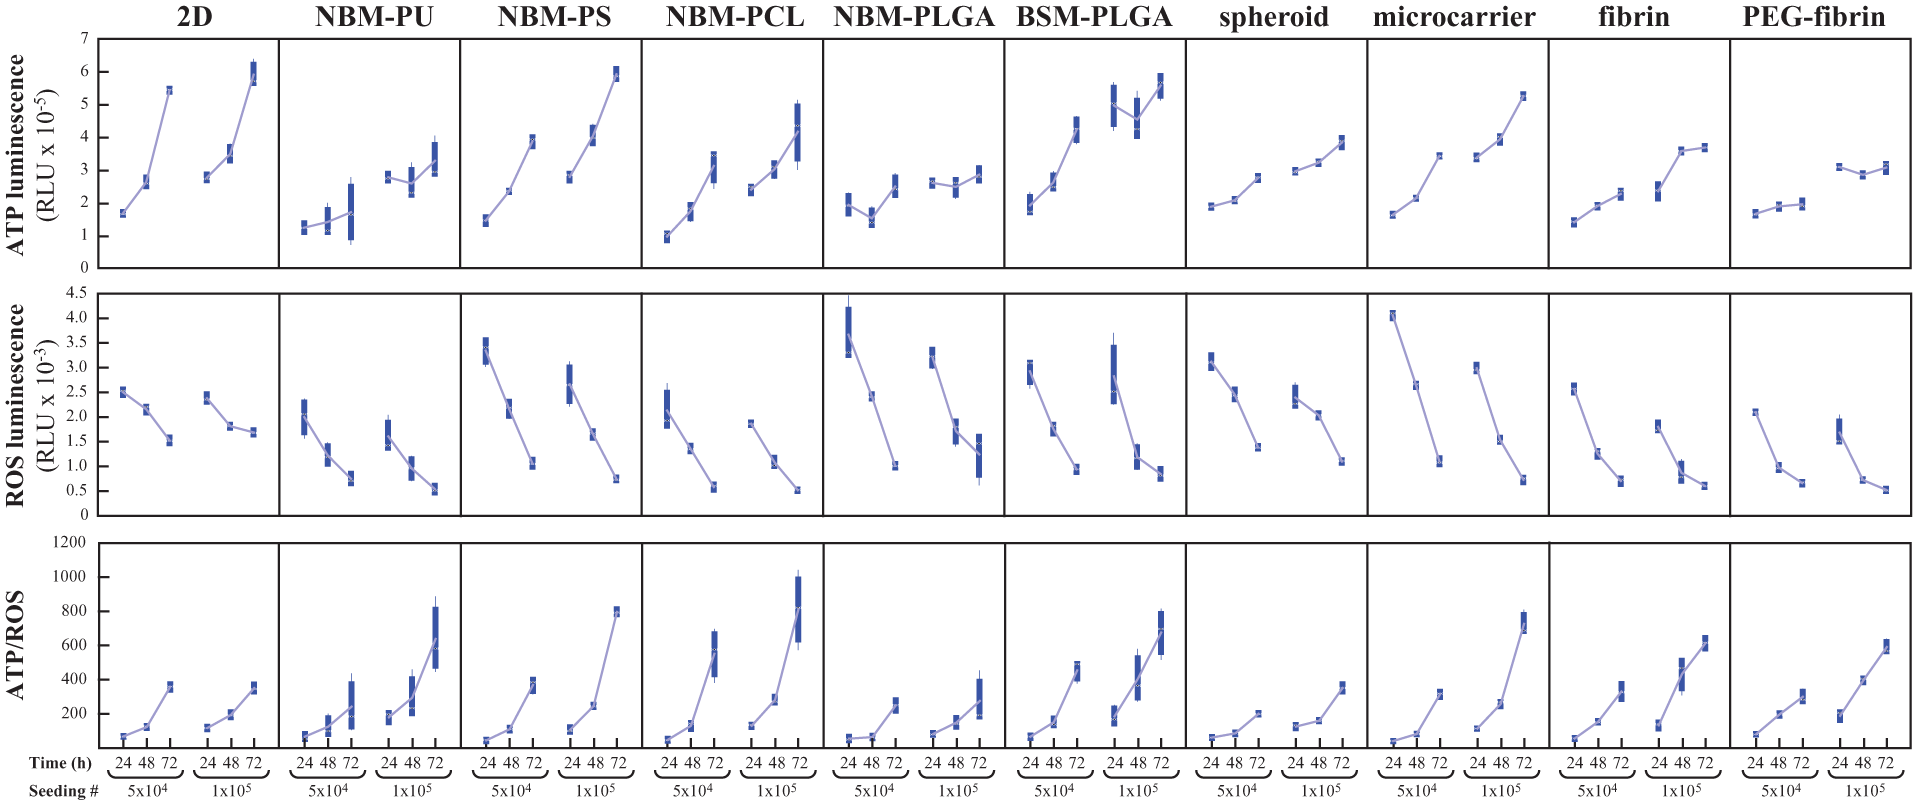
Adenosine triphosphate (ATP), reactive oxygen species (ROS), and ATP/ROS ratio levels in human bone marrow stromal (HS5) cells with seeding numbers of 50,000 and 100,000 cells/well after 24, 48, and 72 h, in various culture systems.
Consistent with the results described above, cells seeded at 5×10⁴ cells/well in 2D resulted in larger ATP increases during the experimental window compared to all 3D systems (
Fig. 2
). When the cell seeding density was increased to 1×10⁵ cells/well (the highest seeding density tested in our experiments), however, the ATP bioluminescence readings at the 72 h time point in the NBM–PS and BSM–PLGA scaffolds and microcarriers were comparable to those of cells grown in 2D (
Fig. 2
). Cells cultured on the NBM–PU and NBM–PCL scaffolds and in the fibrin and PEGylated fibrin gels produced the lowest ROS levels. Moreover, we again calculated the ATP/ROS ratio to better evaluate which culture system provides the healthiest conditions for cell growth, combining the most sustained cellular growth (increased ATP readings) with the concurrent lowest induction of oxidative stress (lower ROS readings). For cells seeded at 5×10⁴ cells/well, all 3D culture systems, with the exception of NBM–PCL, resulted in ATP/ROS ratios (
Fig. 2
) comparable to those observed for 2D monolayer cultures. In contrast, when cells were seeded at the highest density of 1×10⁵ cells/well, all 3D culture systems, except the spheroids and NBM–PLGA, resulted in an increased ATP/ROS ratio compared to 2D (
Fig. 2
), with NBM–PCL and NBM–PS scaffolds leading to the best outcomes. PCL scaffolds are characterized by denser and stronger fibers, however, when compared to PS. Therefore, the NBM–PCL was deemed the optimal 3D culture system for HS5 cells, and, notably, it is also suitable for use in high-throughput formats (e.g., 96- and 384-well plate formats). Although the leukemia cells are anchorage independent, we also evaluated their growth in the presence of various 3D systems; as expected, we found that the growth of leukemia cells was unchanged in 2D and when cultured in the presence of 3D scaffolds (NBM–PS and NBM–PCL) or microcarriers (
Optimization of the Washing Procedure during Cell Sample Preparation for DIMS
To optimize the sensitivity in the DIMS experiments, we evaluated the effect of washing the cells with saline versus PBS on peak detection and intensity. For this analysis, 100,000 leukemia OCI-AML3 cells were washed with either saline or PBS, then samples were spiked with ISs and extracted. Cell samples washed with saline resulted in significantly higher peak intensity of the ISs (
DIMS Analysis of Stromal and Leukemia Cells Cultured in 3D (Either Single- or Co-Culture Conditions) and Treated with Doxorubicin
After we determined which 3D system was the most suitable for the growth of HS5 stromal cells, in a format compatible with high-throughput experiments, we evaluated the feasibility of performing DIMS-based metabolomics analyses on co-cultured stromal and leukemia cells in the 3D system. Based on these analyses, the metabolic consequences following drug intervention can be investigated in each individual cell line. While the system is developed with the final goal to perform high-content metabolic drug screening, proof of principle data are presented below to demonstrate the capability of the combined 3D co-culture and DIMS analysis to detect metabolic changes in cells treated with doxorubicin, a standard chemotherapy drug.
To perform a very quick (high-throughput-compatible) sample preparation for the DIMS metabolic analysis, all samples in the multiwell plate were harvested, washed, and extracted at once using the simple procedure detailed in the Materials and Methods section. The entire procedure can be completed in approximately 13 minutes and allows to prepare all the samples present on the plate for DIMS injection.
To test the feasibility of the selected 3D scaffold (NBM–PCL) for drug screening in co-cultured cells, we separately analyzed the polar metabolite intracellular extracts of HS5 stromal and OCI-AML3 leukemia cells following either single culture or co-culture, and treatment with doxorubicin. Confocal microscopy images captured at representative layers showed that cells were well incorporated within the 3D scaffolds (
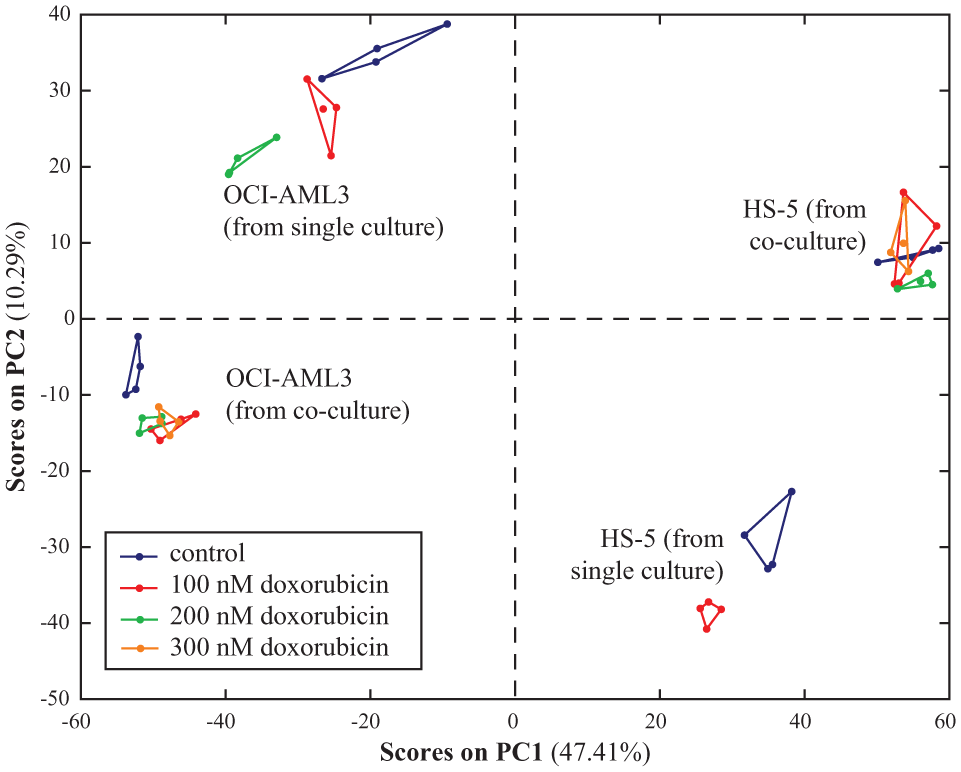
Principal component analysis (PCA) score plot (PC1 vs. PC2) obtained from the analysis of the direct infusion mass spectrometry (DIMS) metabolic profiles of human bone marrow stromal HS5 and leukemia OCI-AML3 cells in single and co-culture, and after treatment with various doses of doxorubicin.
Euclidean Distance between Different Treatment Groups and Control in Principal Component Analysis (PCA) Score Plot in Leukemia OCI-AML3 Cells Cultured Either Individually or in Co-Culture with Human Bone Marrow Stromal HS5 Cells.
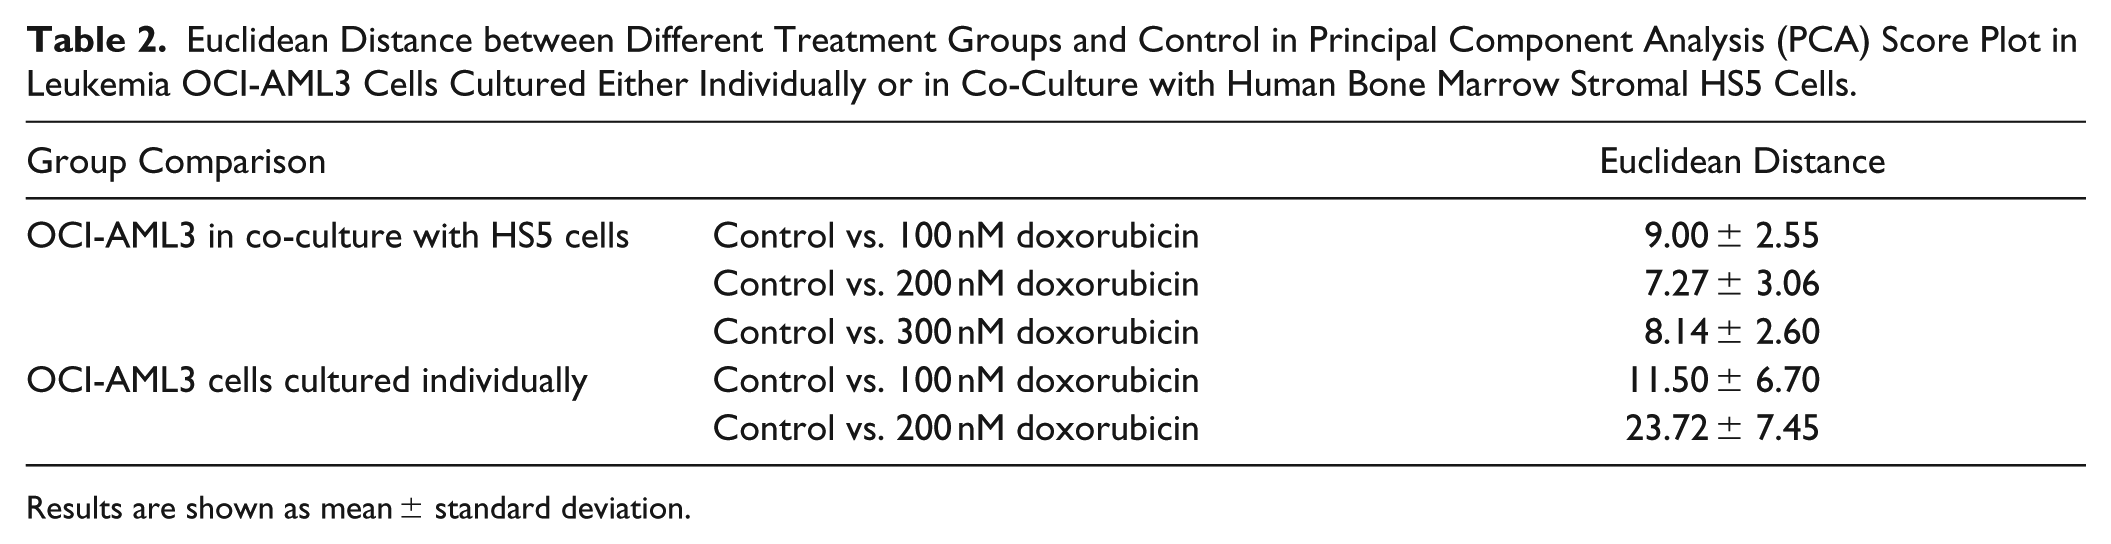
Results are shown as mean ± standard deviation.
To perform a more in-depth analysis of the metabolic modulations induced in normal and leukemia cells by co-culturing and treatment, we limited our analysis to the subset of the putatively assigned features with CV <25%, associated with a KEGG ID, and with at least one treatment condition significantly different from the corresponding control. This subset included 191 putatively assigned metabolites, including several involved in glycolysis, the tricarboxylic acid (TCA) cycle, and amino acid metabolic pathways. While, at this stage of the analysis, the metabolites are only putatively assigned based on accurate mass (to maintain high sample throughput), MS/MS spectra acquired on QC samples can be subsequently used for a lengthier and thorough metabolite assignment, if deemed of interest.
To more clearly capture the metabolic modulation due to the doxorubicin treatment in different cell lines and culture conditions, the metabolic levels of the treated samples within each “culture condition” group were normalized to the average of their corresponding control group, and all control groups, for either HS5 or OCI-AML3 in single or co-culture, were normalized to the same level. The levels of all the putatively identified metabolites are shown in
Figure 4
for the individual HS5 and OCI-AML3 cultures as well as for the co-culture treated with various doses of doxorubicin. For clarity,
Figure 4
includes only the 191 metabolites (1) with at least one treatment resulting in significant changes from the corresponding control and (2) associated with a KEGG ID. To maintain a high-throughput analysis, no additional putatively assigned metabolites were excluded from the analysis, because this would require a lengthy manual selection (and, thereby, some of the included metabolites might be unrealistic for this cellular system). The effect of doxorubicin treatment on metabolite levels was milder in HS5 than in OCI-AML3 cells, regardless of culture condition (
Fig. 4
). Notably, for OCI-AML3 cells, several subclusters of metabolites show either a similar or opposite modulation in single versus co-culture conditions. These trends can help to identify specific metabolic pathways affected by the treatment, explain the functional mechanism of the drug, and detail the different metabolic efficacy of the drug in co-cultured cells.
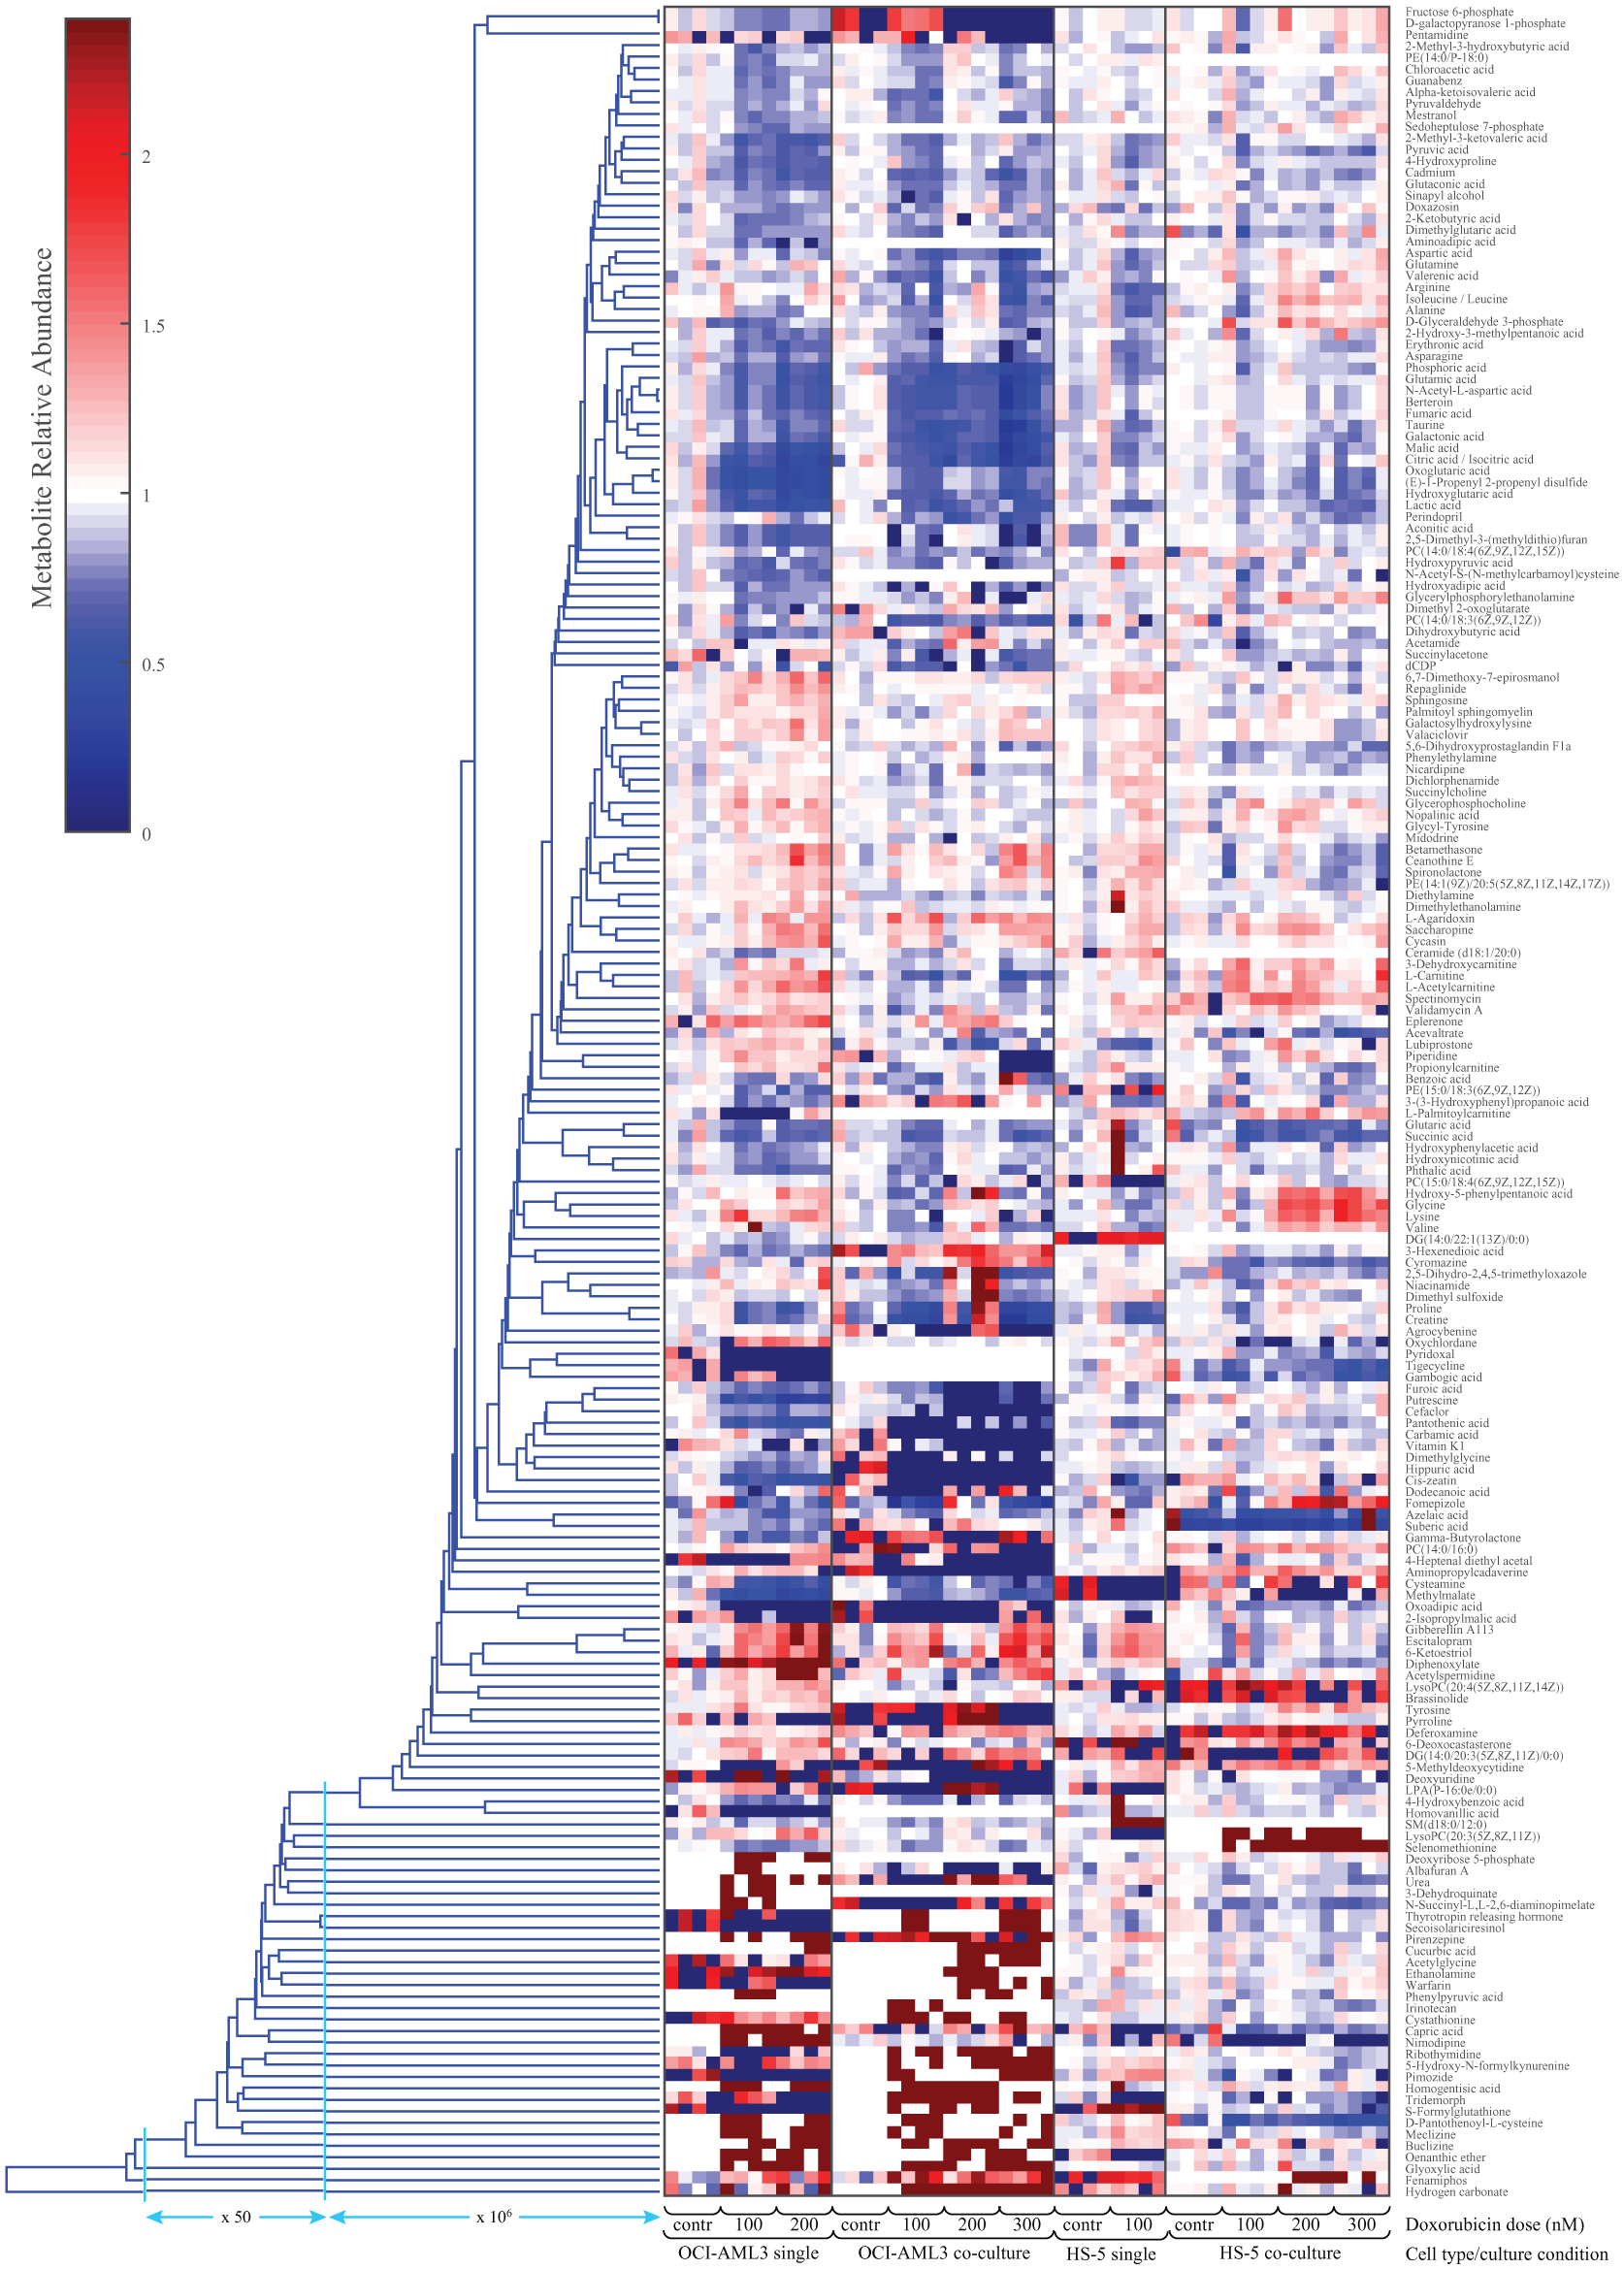
Relative metabolite levels in leukemia OCI-AML3 and human bone marrow stromal HS5 cells cultured either individually or in co-culture, following treatment with doxorubicin (doses variable between 100 and 300 nM). All metabolite levels were normalized to an average level equal to 1 for the corresponding control. For clarity, only direct infusion mass spectrometry (DIMS) features with a quality control (QC) coefficient of variation (CV) <25%, with a Kyoto Encyclopedia of Genes and Genomes identification (KEGG ID)–associated assignment, and with at least one treatment condition significantly different from the corresponding control were included.
Discussion
The use of 3D co-culture systems for in vitro drug development studies has gained increasing interest in the past few years 32 because they have the potential to improve our ability to mimic the structure and heterogeneity of the tumor microenvironment, and the interaction of different cell types within it. All of these aspects are known to play a critical role in treatment outcome. In this study, we evaluated various 3D culture systems and tested the feasibility of using the 3D system for large-scale high-throughput drug screening in an in vitro model consisting of multiple co-cultured cell types, to better mimic the complexity of the tumor microenvironment. In particular, we were interested in evaluating the use of these complex systems to perform DIMS-based high-content metabolic screens of drug libraries in co-cultured cells. Several reports33,34 have previously indicated that normal cells in the tumor microenvironment exert a protective effect on leukemia cells, and this is, at least in part, mediated by metabolic crosstalk. The ability to study the metabolic effect of drug treatments in systems in which multiple cell lines are grown concurrently is particularly important to gain a better understanding of possible drug efficacy modulation in complex tissue comprising multiple cell types in the tumor microenvironment.
Here, we evaluated a number of commercially available or previously reported 3D culture systems produced with different materials and structural geometries to determine which support provides the best growing conditions for HS5 stromal cells. Although some of these 3D systems are less likely to be amenable to high-throughput formats than others, we tested all the most commonly considered 3D culture systems, including spheroids, gels, microcarrier beads, and scaffolds, and also compared these with monolayer (2D) culture. The parameters we chose to evaluate the growth of HS5 stromal cells were ATP bioluminescence (as a readout of cell viability and proliferation) and ROS bioluminescence (as a readout of cellular oxidative stress). We selected these two parameters because they represent the direct response of metabolically functioning cells, in terms of mitochondrial energy metabolism and intracellular stress homeostasis. ATP bioluminescence has previously been shown to provide a good readout for cell viability in the assessment of drug efficacy.24,35 To our knowledge, this is the first study to measure and compare the effect of culturing cells in different 3D systems on the induction of intracellular oxidative stress. Unsurprisingly, we found that, due to the larger growing surface available and perhaps the longer lag phase experienced by cells shifted from 2D to 3D growth prior to resuming exponential growth, 36 3D culture systems require higher seeding densities to support cellular growth rates comparable to 2D culture systems. Moreover, cells cultured in all of the 3D systems produced lower levels of ROS when compared to 2D. This is likely due to the lower tensile stress (compared to the rigid 2D plastic surfaces) and in-vivo-like mechanical support provided by the 3D culture environment, 37 producing features found within the extracellular matrix and required for native cell function. Overall, based on the results from both the cell viability (ATP) and oxidative stress status (ROS), the NBM–PCL scaffold offered the most advantageous growth conditions for HS5 cells and was thus our system of choice for further high-content analysis of metabolic responses to drug treatments. This choice not only ensures favorable cell growth, as shown by our results, but, unlike 3D gel supports, also is suitable for use in a high-throughput format such as 384-well plates. Similar scaffold systems have previously been used to mimic the bone marrow niche.5,7,9
Next, we tested the feasibility of using this 3D culture system in a high-throughput format to co-culture stromal and leukemia cells and perform DIMS-based high-content metabolic drug-screening experiments. Most previous studies have been conducted to optimize the sample preparation and data acquisition workflow for nanoelectrospray ionization (nESI)-MS. 38 In our study, for the large-scale metabolomics applications, high sensitivity on the limited amount of sample obtained from each well is imperative. With DIMS, samples are sprayed directly into the mass spectrometer. Therefore, cell washing becomes an even more important step, because it allows not only focusing the analysis on the intracellular metabolites without a carryover of metabolites from the medium, but also injects a cleaner sample with reduced salt content in the DIMS system. The cell-washing method has been a controversial topic in the literature, in which both ammoniated rinsing 39 and saline 40 have been suggested. Notably, it has been shown that sample washing with either water or PBS, the most common solution applied, can cause dramatic effects on the peak intensities. 41 Since the cell morphology is affected by ammoniated rinsing solutions and water, we focused our analysis on the effect of washing with either PBS or saline to determine which cell-washing method produces better DIMS peak intensity. The DIMS peak intensities were much higher following the saline wash, for both spiked polar internal standards and key intracellular metabolites. This is likely a consequence of the increased ion suppression induced by the residual salt left in the cell sample after PBS wash, due to the phosphate group of PBS. The result is in general agreement with previous studies, and nonvolatile buffers, such as phosphate, are usually not recommended because they may interfere with MS ionization. 42
The final aim of this study was to validate the suitability of the selected 3D platform for large-scale metabolomic drug screening. To this end, we used the 3D system to co-culture HS5 stromal and OCI-AML3 leukemia cells, to mimic ex vivo some of the cellular interactions in the bone marrow tumor microenvironment, and evaluated whether any metabolic differences induced by treatment in single- versus co-cultured cells were detectable via the DIMS analysis. Moreover, to maintain the high-throughput aspect desirable for high-throughput drug screening, we were interested in validating the ability of a simple and rapid data analysis method to detect metabolic differences in the complex 3D co-culture system.
As expected, the PCA analysis indicated that cell types captured most of the metabolic variability, and culture condition is the second most important factor in determining PCA grouping and separation. Notably, however, the different treatment groups are very well clustered in the score plot and can be easily discriminated.
As such, we proceeded to the analysis of the metabolic changes induced by treatment in the single versus co-cultured OCI-AML3 cells. To comply with the requirement of a quick data analysis, we focused on the trends of all putatively assigned metabolites (based purely on exact mass value) associated with a KEGG ID and having at least one treatment condition (for any of the cell lines and culture conditions) significantly different from the corresponding control. While these simple criteria do not guarantee that only relevant metabolites are considered in the analysis, this procedure allows to rapidly generate a subset of metabolites that are of possible interest in the evaluation of the response to treatment. Next, we proceeded to evaluate the metabolic pathways with the most disparate response in single versus co-culture. The metabolic crosstalk has recently been proposed as an important mediator of response, in which stromal cells act as fuel sources by providing fatty acids, 43 vitamins, 23 and amino acids 33 to leukemia cells. Studies have shown that the stromal-leukemia interaction is critical for cancer cell survival, suggesting that targeting of a key biochemical pathway in leukemia cells might help to overcome drug resistance. 44 For instance, in our analysis of OCI-AML3 cells cultured in 3D with or without HS5 stromal cells and treated with doxorubicin, TCA cycle intermediates responded in the same way regardless of the culture conditions, indicating that energy metabolism in OCI-AML3 cells is not affected, in its response to doxorubicin treatment, by the presence of stromal cells. This finding is consistent with previous reports. 45 In contrast, lipid carnitine metabolites respond in opposite ways depending on whether OCI-AML3 cells are grown in single or co-culture. The overall decreased levels of carnitine species may suggest their participation in chemoresistance of cancer cells in co-culture, because it has been shown that carnitine reduced doxorubicin-induced apoptosis. These results highlight the value of investigating cells in co-culture, because this could point to vulnerabilities in the metabolic response to treatment that could not be observed in the single-culture setting.
In summary, we have shown that the selected 3D co-culture system can be valuable in large-scale metabolomic drug library screening in leukemia cells. The simple and fast steps required for both the data acquisition and analysis of our method can be exploited for high sample throughput with the sensitive DIMS detection. The distinct clustering among different PCA groups supports the good reproducibility and the robustness of the methodology. In conclusion, the 3D co-culture, coupled with the high-throughput/high-content metabolic screen based on DIMS, holds promise to improve the success of the drug-screening and drug development fields.
Supplemental Material
Supplemental_Material_for_Three-dimensional_Co-culture_by_Lu_et_al – Supplemental material for Three-Dimensional Leukemia Co-Culture System for In Vitro High-Content Metabolomics Screening
Supplemental material, Supplemental_Material_for_Three-dimensional_Co-culture_by_Lu_et_al for Three-Dimensional Leukemia Co-Culture System for In Vitro High-Content Metabolomics Screening by Xiyuan Lu, Alessia Lodi, Marina Konopleva and Stefano Tiziani in SLAS Discovery
Footnotes
Acknowledgements
We thank Dr. Yue Li at the Research Core Facility of the Dell Pediatric Research Institute (The University of Texas at Austin, TX) for the collection of confocal fluorescent images and valuable support.
Supplemental material is available online with this article.
Declaration of Conflicting Interests
The authors declared no potential conflicts of interest with respect to the research, authorship, and/or publication of this article.
Funding
The authors received the following financial support for the research, authorship, and/or publication of this article: This research is in part supported by the MD Anderson Cancer Center Leukemia SPORE P50 CA100632, R01 CA206210-01, and CPRIT RP180309.
References
Supplementary Material
Please find the following supplemental material available below.
For Open Access articles published under a Creative Commons License, all supplemental material carries the same license as the article it is associated with.
For non-Open Access articles published, all supplemental material carries a non-exclusive license, and permission requests for re-use of supplemental material or any part of supplemental material shall be sent directly to the copyright owner as specified in the copyright notice associated with the article.