
Abstract
During the past decade, the physicochemical quality of molecules under investigation at all stages of the drug discovery process has come under particular scrutiny. The issues associated with excessive lipophilicity and poor solubility in particular are many and varied, ranging from poor outcomes in screening campaigns to promiscuity, limited and/or poorly predictable pharmacokinetic exposure, and, ultimately, greater chances of clinical failure. In this review, contemporary methods to secure key measurements are described along with their relevance to understanding the behavior of molecules in environments pertinent to pharmacological activity. Together, the various measurements contribute to predictive models of both the physicochemical properties themselves and the outcomes they influence.
Introduction
The physicochemical properties of potential drug molecules are at the forefront of contemporary thinking and practice in medicinal chemistry,1–3 and are key quality indicators 4 that demonstrably affect attrition.5,6 In drug discovery, physicochemical properties can be defined as the tangible physical attributes of molecules that are related to interactions with different media and environments. In this context, the most important parameters in drug discovery are the interrelated properties of lipophilicity7,8 (partition and distribution coefficients), solubility, and pKa, 9 which underpin these behaviors, summarized in Box 1 . It is logical to expect that any prospective drug molecule must possess some level of water solubility to enable systemic exposure via aqueous media to reach its target and that its physical makeup must have complementary features to specifically engage with that target. 10 The aqueous nature of the digestive tract, body fluids, and the intracellular milieu is the opposite of the more lipophilic environment of the sites of drug action and transport, where recognition will require a particular combination of polar and, particularly, hydrophobic interactions. 11 Indeed, the essence of medicinal chemistry is finding a compromise between these conflicting requirements to identify molecules with optimal properties to deliver appropriate activities, pharmacokinetic exposures, and pharmacodynamic responses, 12 while minimizing off-target activity or toxicity. 1 Indeed, the term “molecular obesity” has been termed to describe an addiction to lipophilicity-driven practices, 13 and overuse of aromatic rings 14 in experimental structures has been shown to have shortcomings,15,16 alternatively described as a need to “escape from flatland.”17,18
Definitions of key physicochemical properties
Partition coefficient (P)
Commonly expressed as log10P or

Distribution coefficient (D)
Commonly expressed as log10DpH or
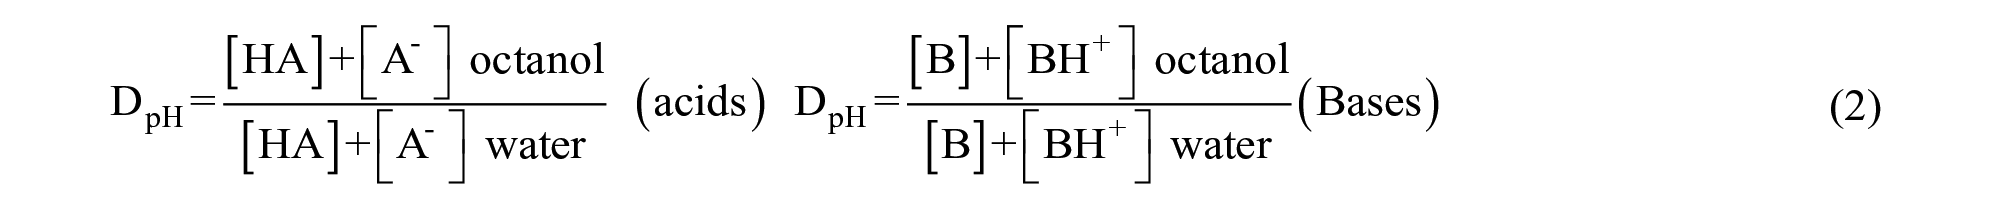
pKa
The

such that when the species is 50% ionized, then [A−] = [HA], or [BH+] = [B], then pH = pKa.
Solubility
Composition of Simulated Fasted or Fed State Simulated (Gastric or Intestinal) Fluids, Commonly Used to Measure Solubilities Pertinent to Drug Discovery.
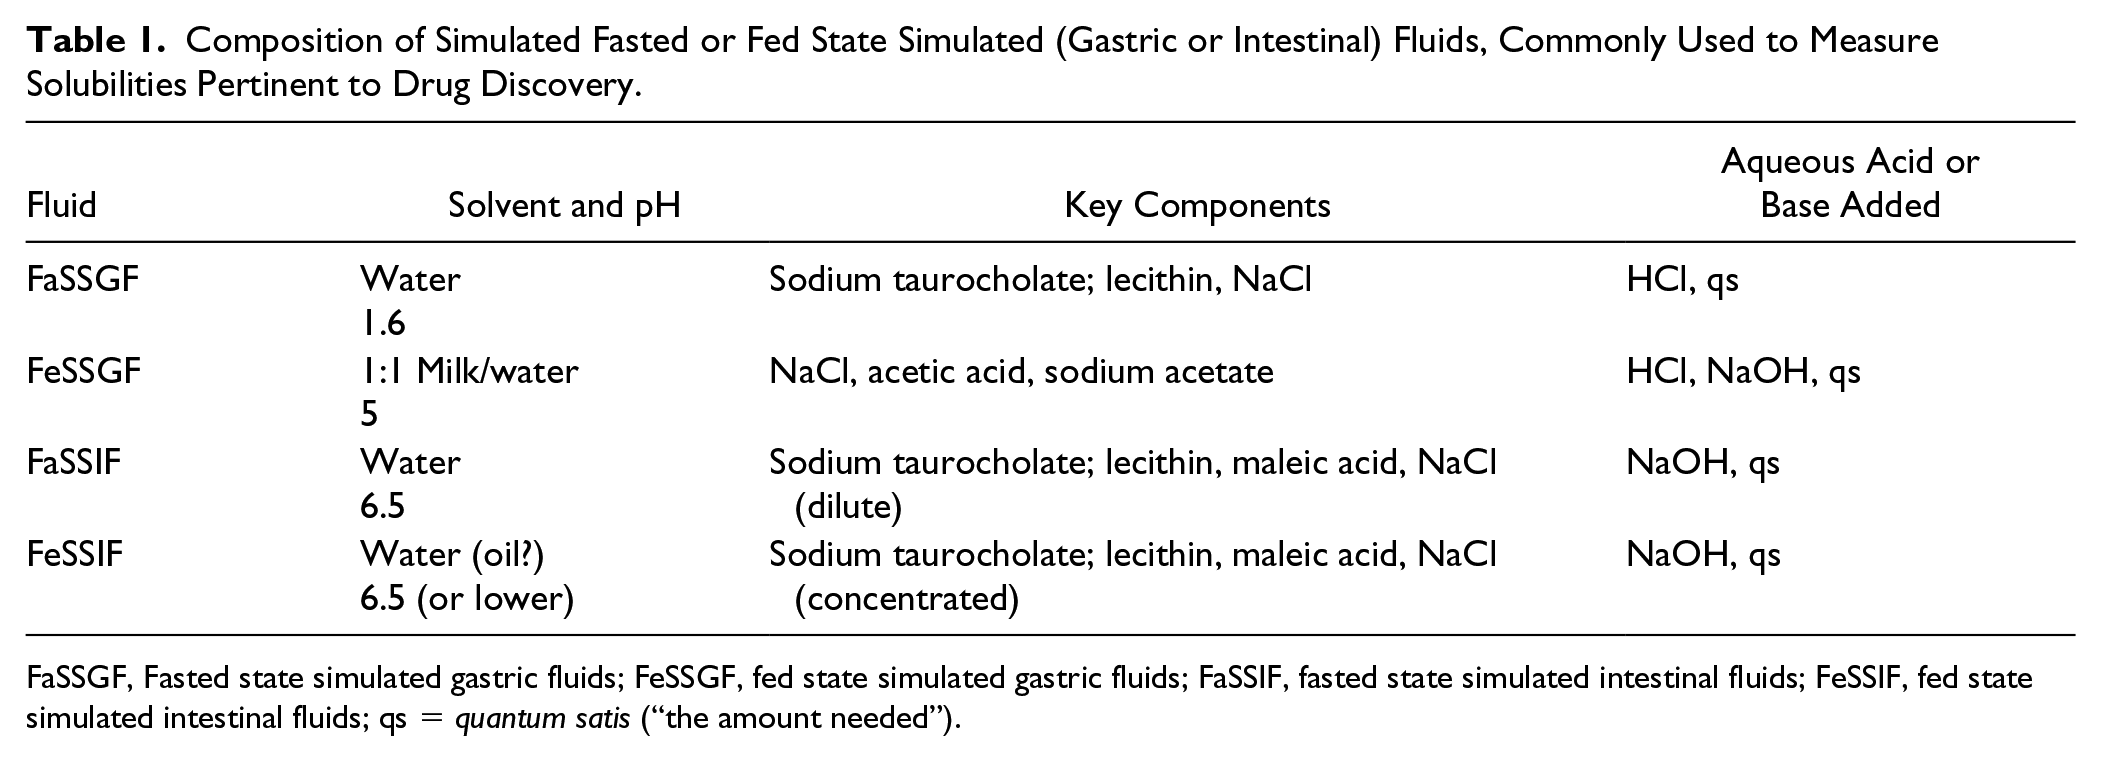
FaSSGF, Fasted state simulated gastric fluids; FeSSGF, fed state simulated gastric fluids; FaSSIF, fasted state simulated intestinal fluids; FeSSIF, fed state simulated intestinal fluids; qs = quantum satis (“the amount needed”).
The measurement of physicochemical properties of experimental compounds is routine in contemporary practice, 19 and data are often generated in high-throughput assays 20 from 10 mM DMSO stock solutions. At GlaxoSmithKline (GSK), about 25,000 compounds per annum are run through a bundled package of physicochemical assays, 21 the experimental procedures for which are summarized in Box 2 . 22 The inclusion of high-throughput measurements on high-performance liquid chromatography (HPLC) columns packed with immobilized human serum albumin 23 (HSA) and immobilized artificial membrane (IAM) 24 in such bundles gives additional insight into plasma protein binding, volume of distribution, 25 and unbound concentrations. 21 Together, these biomimetic measures have been used to estimate likely free concentrations (termed “drug efficiency” 26 ) by an empirical HPLC estimation 27 that can be used to provide information on optimization of the likely dose. 28
Typical experimental protocols of GlaxoSmithKline (GSK) physicochemical and biomimetic assays
Kinetic Solubility Assay
The kinetic solubility of a compound is measured using a stock solution of the compound dissolved in DMSO, which is diluted (1:20) with phosphate-buffered saline at pH 7.4, equilibrated for 1 h at room temperature, and filtered through Millipore Multiscreen filter plates (Merck Millipore, Burlington, MA). The filtrate is quantified with a charged aerosol detector. 33
Thermodynamic Solubility of Solid Compounds in Biorelevant Media
Thermodynamic solubility is determined by dispensing the relevant buffer (e.g., 1 ml of fasted state simulated intestinal fluid [FaSSIF], fed state simulated intestinal fluid [FeSSIF], simulated gastric fluid [SGF], or simulated lung fluid [SLF]—see Table 1) into a 4 ml glass vial containing circa 1 mg of solid compound. 30 The resulting suspension is shaken at 900 rpm for 4 h at room temperature before residual solid is removed by filtration using a MultiScreen HTS 96-well solubility filter plate (Millipore). The supernatant is quantified by high-performance liquid chromatography–ultraviolet (HPLC-UV), with a dynamic range of typically 1–1000 µg/ml.
Lipophilicity: Chrom logD Assay
Lipophilicity is measured by reversed-phase HPLC on a C18 column (50×2 mm 3 µM Gemini NX C18, Phenomenex, Macclesfield, UK) at pH levels 2, 7.4, and 10.5, using fast gradient acetonitrile-aqueous buffer mobile phases. The Chromatographic Hydrophobicity Index (CHI) values are derived directly from the gradient retention times by using a calibration line obtained for standard compounds. 20 Translation of CHI values into Chrom logD values 39 at the given pH is achieved using the empirically derived Eq. 4.

pKa Determination
The pKa determination is based on acid–base titration quantified either by UV spectroscopy or potentiometrically using a Sirius T3 (Sirius Analytical Ltd, Forest Row, UK) instrument, typically requiring 5 µl of a 10 mM solution of the samples, and the UV absorbance is monitored throughout 54 stepped pH values for about 5 min. 9 When the ionization center is remote from any UV chromophore, a potentiometric acid–base titration is used. Usually, 0.5–1 mg of solid material is required for these measurements. The pH of each point in the titration curve is calculated using mass balance equations, and the calculated points are fitted to the measured curve by refining the pKa(s). For poorly soluble compounds, a method using various concentrations of co-solvent (usually methanol) is applied. The pKa in water is calculated from the Yasuda–Shedlovsky extrapolation.
Protein Binding Assays (Human Serum Albumin [HSA] and Alpha-1-Acidglycoprotein [AGP])
Chemically bonded HSA and AGP HPLC stationary phases (Chiral Technologies, Illkirch, France) are used for measuring compounds’ binding to plasma proteins, applying linear gradient elution up to 30% isopropanol with 50 mM pH 7.4 ammonium acetate buffer. 23 The gradient retention times are standardized using a calibration set of compounds. The %HSA bound gives a reliable indication of the free fraction of compound in plasma when compared to more complex pharmacokinetic methods.
Phospholipid Binding Assay (IAM)
The binding of compounds to immobilized artificial membrane (IAM) is measured using a commercially available IAM PC DD2 100×4.6 mm 10 µM (Regis Analytical, West Lafayette, IN) HPLC column. Gradient retention times obtained by applying acetonitrile gradient up to 85% are converted to Chromatographic Hydrophobicity Indices (CHI IAM) using a calibration set of compounds. 24 The CHI IAM values are converted to the logarithmic retention factors using the following formula: log KIAM = 0.046 * CHIIAM + 0.42.
Solubility
The protocol and type of solubility measurement
29
are important factors to consider.
30
Typically, rapid, high-throughput experiments
31
(often using a precipitative method in aqueous buffer from a small volume of 10 mM stock in a carrier solvent such as DMSO) give a
Implications of Poor Solubility
In the early stages of drug discovery, compounds that are poorly soluble and/or lipophilic can cause numerous problems that hinder various processes or give misleading outcomes. 35 Poorly soluble compounds can hinder automation and the outcomes of high-throughput techniques through equipment failure due to blockages or cross-contamination; otherwise, the compound may not be soluble enough to maintain a stock solution at an appropriate concentration. 36 Highly lipophilic compounds may stick to the plastic screening plates (thus reducing effective concentration in the well), or they may form aggregates that are common sources of false positives. It is imperative that trained eyes inspect dose–response curves to look for signs of low solubility ( Fig. 1a ), or plate patterns37,38 could be influenced by carryover of an insoluble compound; false negatives may occur when insufficient solubility at the top concentration of a dilution series means that no compound is present in the assay wells. In addition, lipophilic compounds may give nonspecific inhibition of the target protein or bind to other reagents or coupling partners in a given assay. Such shortcomings are manifest in the propensity for more lipophilic compounds to be promiscuous binders, through exhibiting activity versus multiple proteins.5,39 Shortcomings due to colloidal aggregation, 40 a risk accentuated with lipophilic compounds, are well documented, 41 and predictive methods to highlight such behaviors are emerging. 42 The quality of chemical probes can also be described in terms of their lipophilicity,43,44 and overinterpretation of data from a phenotypic experiment could be a consequence of a nonspecific lipophilic tool compound. Methods are emerging, however, to enhance the output of experiments with poorly soluble molecules. 45
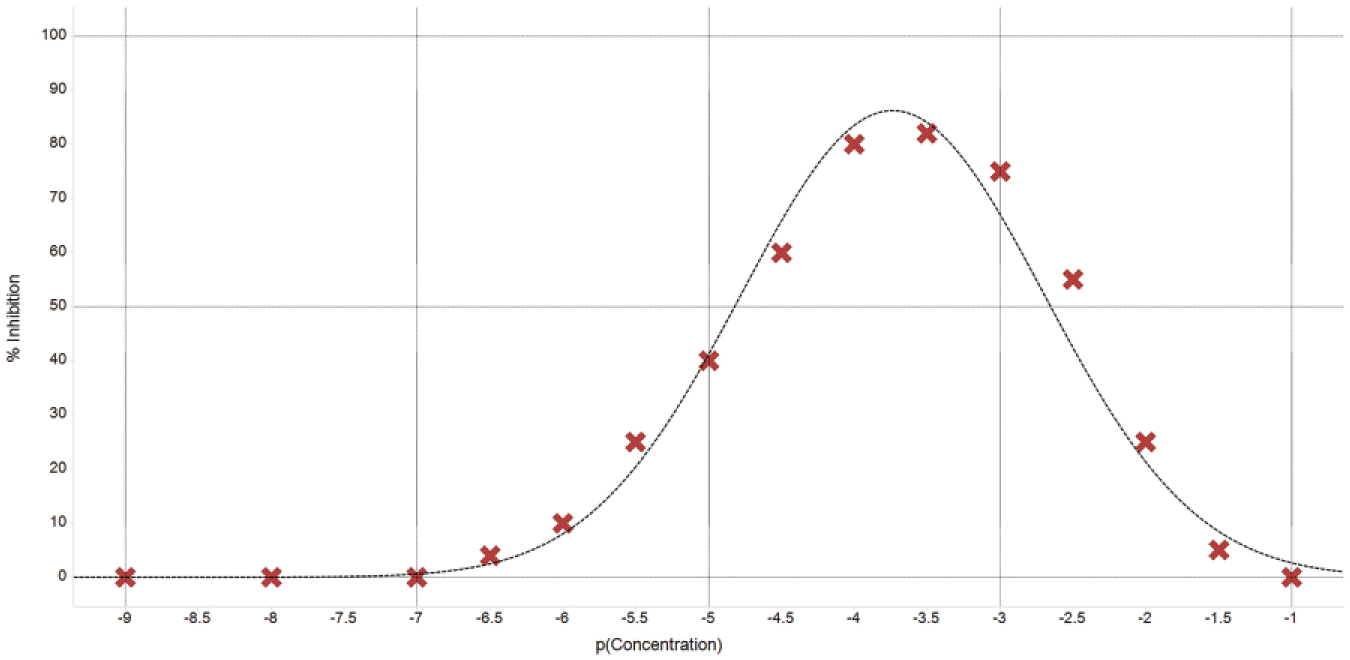
Activity (percentage of inhibition vs. concentration) curve with a characteristic tail at high concentrations due to low solubility.
The Lipinski Rule of 5
A watershed in drug discovery practices in 1997 was the publication by Lipinski et al. of the Rule of 5 (Ro5), 46 based on their observation of a disconnect between the properties of oral drugs and those of molecules typically pursued as hits from high-throughput screening (HTS). It was noted that when two or more thresholds of molecular weight (MW) >500, calculated logP >5, a number of hydrogen bond donors >5, or hydrogen bond acceptors >10 were exceeded, oral exposure would be limited by poor solubility and/or poor permeation. 47 This rule continues to engender debate, 48 criticism, 49 and misinterpretation, 50 but it certainly reined in some of the potency-driven excesses of HTS and brought some discipline to design. When the Ro5 has caused issues, it is likely through overinterpretation; regarding the values as thresholds is certainly unwise. 2 MW is, per se, probably an unimportant parameter (but can be calculated with precision!), and the logP 5 threshold is rather higher than the majority of oral drugs, 51 and the pattern has not substantively changed in spite of recent inflation in the MWs of drugs. 52 The availability of high-throughput measured lipophilicity, solubility, and permeability data allows a more iterative appraisal of the likely issues the Ro5 should highlight and identifies cases in which the rules might be broken. As with many aspects of medicinal chemistry, there is a trade-off in outcomes; less lipophilic compounds are likely to be more soluble and, on balance, relatively lower-affinity binders with poor permeability. As lipophilicity increases, the solubility will generally decrease, and affinity and permeability increase. 53 Permeation has a biphasic response to lipophilicity,39,54 although with bigger molecules there may be a requirement for increased lipophilicity, 55 measurements that may be enhanced by modulating protein composition of the experimental medium. 56 A fierce debate remains over the mechanisms of non-carrier-mediated membrane passage, be it passive through the bilayer 57 or entirely facilitated by transmembrane proteins. 58
Contemporary Hit-Finding Methods
The discovery of new chemical matter59,60 in contemporary practice in drug discovery 61 is dominated by screening of one type or another. 62 Such campaigns typically range in size and scale from fragments 63 (MW ~150 to 280 Da, 102 to 103 compounds), through focused or diverse sets 64 (103 to 106 compounds, MW ~200 to 500 Da, screened in vitro versus isolated proteins or in cell-based assays) in HTS, 64 or higher numbers in affinity-based selection using DNA-encoded libraries (MW ~200 to 600 Da, 105 to 1010 compounds).65–67 There is discussion regarding how best to sample the extent of likely combinations of feasible compounds that exist within the bound of “druglike space” (usually defined within the bounds of the Ro5).68,69 Understanding how molecular topology and features, defined as molecular complexity,70,71 can influence the chances of making a productive binding event leads to the conclusion that relatively few fragment-sized molecules give the best odds. 72 Beyond fragments, attempts to improve quality in larger or leadlike 73 molecules spawned initiatives such as lead factories, 74 and purchasable space can be explored computationally. 75 It is pertinent to consider that the technique used to identify the starting point of a drug discovery program does not define the properties of the candidate(s) selected, 76 but the varying practices 77 used on the journey. 78
Hits to Leads
In the hit-to-lead (H2L) phase, 59 a process of hit confirmation and expansion from all or any of the above techniques, it is first of all vital to ensure that the activity and binding are genuine – that is, not influenced by impurities or an interference mechanism due to contaminants or reactive substructures 79 (sometimes described as pan-assay interference compounds, or PAINs). 80 This is achieved using newly prepared and purified samples in the primary assay, run, ideally, in tandem with an assay format using an orthogonal readout or biophysical measurement. 81 When selecting samples for qualification, any understanding of the physicochemical profile of the compound (e.g., solubility, charge, or lipophilicity) 82 will help put the binding and demonstrable pharmacological activity in context and influence prioritization and avoidance of likely promiscuous binders.83,84
A successful screen identifies a number of qualified hits that can be prioritized based on their chemical tractability, 85 activity, ligand efficiency 86 (LE, the activity engendered by each heavy atom in the molecule 87 ), lipophilicity, and solubility. The generation of rational structure–activity relationships (SARs) during this phase of optimization is often termed H2L work and builds confidence that a program of work is capable of delivering a compound with a combination of activity and physical properties appropriate for an efficacious candidate molecule. Progress toward this goal can be mapped using physical properties and efficiency metrics; 78 ligand lipophilicity efficiency (LLE), the difference between activity and a lipophilicity estimate (e.g., pIC50 − logP), is a universally recognized metric,86,88 embodying a principle proposed by Hansch in 1987 that “molecules should be made as hydrophilic as possible without loss of efficacy.” 89 Recent reviews78,88,90 demonstrated that drugs almost invariably possess some of the best combinations of efficiency and properties achieved for a given target, 91 visualized by plotting LE versus LLE.
With progression through the discovery phases, the behavior of compounds in cell-based assays and pharmacokinetic and pharmacodynamic/efficacy studies is all influenced by the physicochemical makeup of the molecule. 92 The molecule must be sufficiently soluble to dissolve (favored by low lipophilicity), but activity and passage into and through cells generally require higher lipophilicity—which also brings the risks of increased binding to other proteins and/or increased metabolism. These are some of the balances and trade-offs sought in a typical lead optimization. 53
Predictive Models of Physicochemical Measurements
To complement the impact of measuring physicochemical parameters and exploring their influence, contemporary drug discovery is often driven by a “predict-first” design culture. Commercial software packages to predict physicochemical parameters are available, and these are often supplemented by modeling of in-house data to generate bespoke models. 93 Indeed, given the quality of these predictive models, it is a missed opportunity not to use them prospectively, although analyses of practices would suggest that they are being used and exploited.2,78
In contrast, solubility is notoriously hard to predict with any great precision, 94 due to the underlying complexity of the mechanism involved, most notably in estimating the lattice energy of the crystalline form. 95 In addition, the dynamic range of measured high-throughput data (typically with a limit of quantitation of around 1 µM in high-throughput assays, wherein the upper limit is about 500 µM based on dilution of 10 mM DMSO stocks) gives a relatively narrow spread of data to model. The General Solubility Equation 96 (GSE; Box 3, Eq. 5), however, provides both a useful predictive method and an illustrative principle to understanding solubility changes, based on the contributions of lattice energy and lipophilicity.
Yalkowsky’s general solubility equation
The General Solubility Equation:

Additionally, for compounds with an ionophore:

where LogS is molar aqueous solubility, MP is the melting point in Celsius, and LogP and LogD are the partition and distribution coefficients, respectively.
Table 2 is a representation of the GSE colored by predicted solubilities, in which the coloration reflects levels of solubility commensurate with oral exposure and efficacy; it is thus not coincidental to consider that the median logP of drugs is around 3. 51 To solubilize an aspirational 97 oral drug dose of 100 mg, with a molecular weight of 400, this equates to a 250 µM solution (100 mg in 1000 ml); the typical stomach volume is roughly 300 ml.
Matrix of solubilities predicted by the GSE based on indicated logP and melting point values, colored by GSK classifications of reasonable >200 µM, intermediate 30–200 µM, and poor <30 µM solubility.
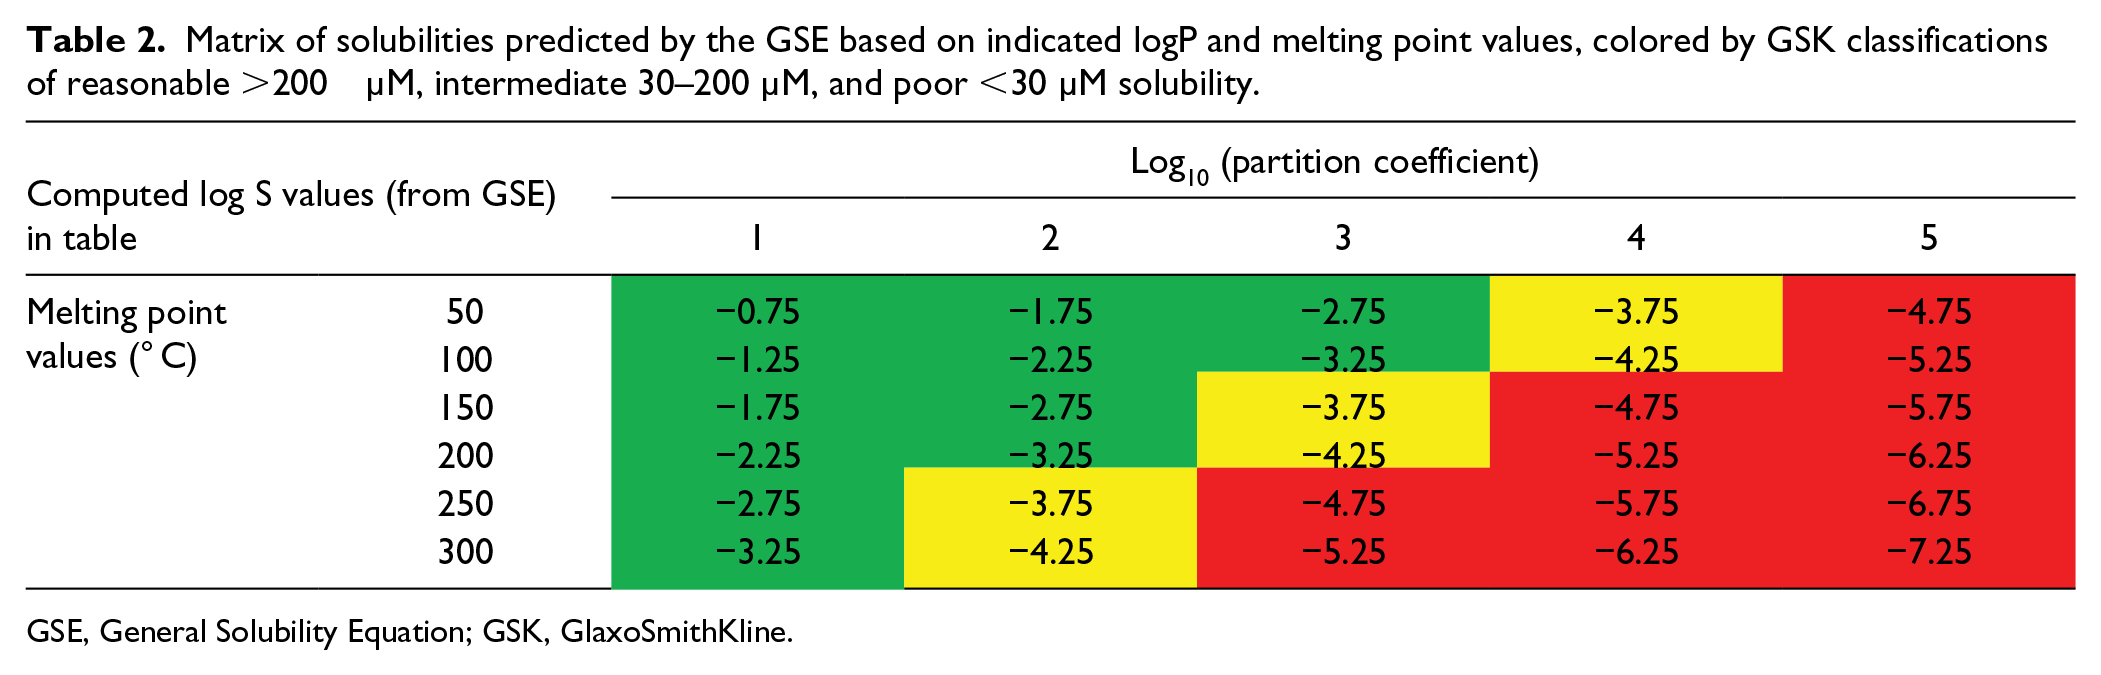
GSE, General Solubility Equation; GSK, GlaxoSmithKline.
The patterns observed in Table 2 were broadly reproduced in analyses of GSK data, which were enhanced to show an orthogonal impact of the simple aromatic ring count (#Ar), such that a higher ring count reduced solubility regardless of the impact of lipophilicity, whereby 1× Ar ring ~ 1 log(lipophilicity) ( Fig. 2 ). This led to the formulation of the Solubility Forecast Index (SFI = logD7.4 + #Ar), a probabilistic score of likely outcomes in developability assays (including solubility), embodying the principle of minimizing lipophilicity and aromatic ring count.32,39 As further sets of data were analyzed, it was evident that this probabilistic score showed differentiation of outcomes in other developability assays, especially with the higher quality of chromatographic lipophilicity measurements, termed the Property Forecast Index (PFI = Chrom logD7.4 + #Ar). 39
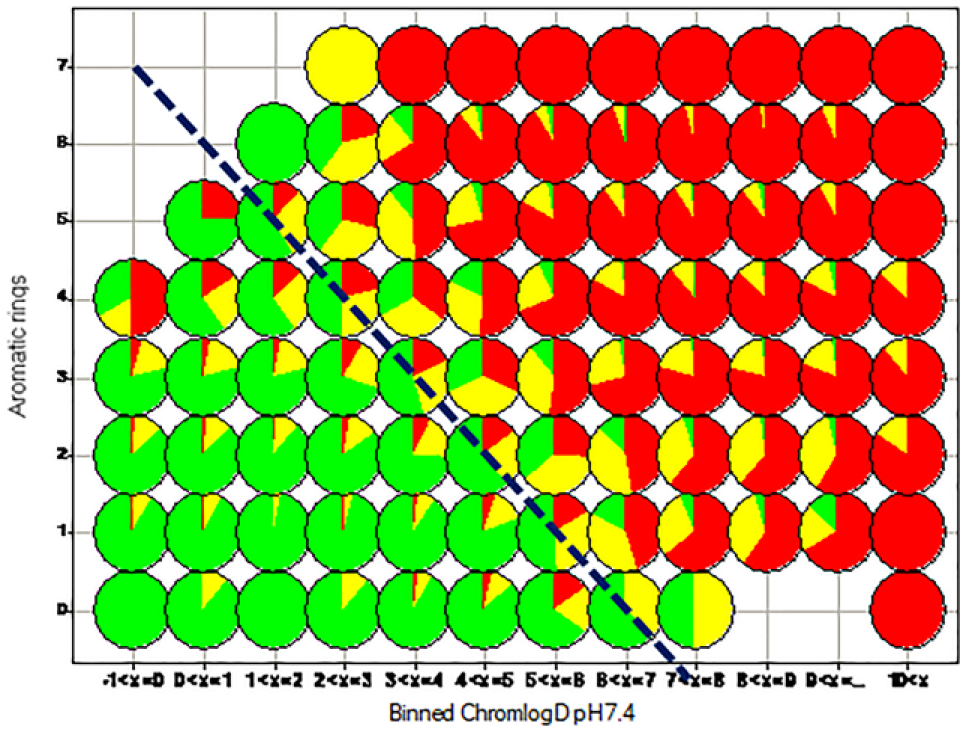
The orthogonal impact of lipophilicity and aromatic ring count on solubility distribution (colored as in Table 2 ). The hashed blue diagonal line represents the line of Chrom logD7.4 + #Ar (PFI) = 7, which exhibits a marked differentiation between good and poor solubility distribution.
Generating Predictive Models
This section reviews opportunities offered in contemporary methods and practice that enable the building of more complex and accurate models.
Quantitative structure–activity relationships (QSARs) are established approaches for providing a mechanism to predict the properties of new molecules on the basis of information extracted by examining preexisting data. Statistical and/or machine learning–based algorithms are used to define a relationship between chemical structure and the variance in the response of interest, whether that is a physicochemical property, pharmacokinetic parameter, or potency measure. The key decisions regarding how to build the QSAR relate to the choice of algorithm, the choice of how to describe the chemical structures, and, perhaps most importantly, the choice of which data to use in model building. On top of that are questions relating to how to establish confidence in the predictive power of the final model and the domain of applicability. The Kubinyi paradox 98 recognizes how variability in prediction errors, which depend on test set size, might cause poor-quality predictions in small datasets without robust cross-validation.
A wide armory of algorithms is now available to the model builder, ranging from simple linear, statistically based techniques such as partial least squares regression, to decision tree ensemble-based techniques such as Random Forest and XGBoost, through to advanced machine learning approaches such as support vector machines and, more recently, deep neural networks. A similar set of choices is available for describing the chemical structure, ranging from fundamental physicochemical properties through to a variety of fingerprint-based approaches. The ultimate “best” choice will depend on the complexity of the underlying mechanism being modeled and to what extent the information contained within the chemical substructure plays a more important role than that which can be captured with more simple (and understandable) macro properties.
The key to successful QSAR model building lies within the external validation of the final model; 99 most practitioners would take the available data and split it into a training set and a test set, although some will rely on cross-validation: The ultimate test is based on continued examination of temporal datasets. 99 The statistical performance therein will define the utility of the model. 100
To fully evaluate the multitude of choices described above, automated modeling platforms101,102 now provide a more objective assessment of the most appropriate modeling strategy for a particular dataset. These simultaneously build many models of differing types and then use the ensuing statistics to rank the models and inform on the best choice. Here, the concept of Occam’s razor is a useful guide—the model should be sufficiently complex in all aspects to achieve predictive power but no more complex than needed. A comprehensive review of the current state of the art was published recently by Cherkasov et al. 103
At GSK, continual QSAR analysis of the large proprietary datasets of physicochemical and biomimetic measurements 22 furnishes up-to-date and impactful models of these fundamental parameters. Predictive models of lipophilicity, as defined by chromatographic LogP and LogD, are of particular value and of high quality; for example, the recent temporal validation of the Chrom LogD7.4 model indicated an R 2 of 0.87 ( Fig. 3 ). The wide dynamic range of values, high precision of measurements, and relatively simple underlying mechanism contribute to the high quality.
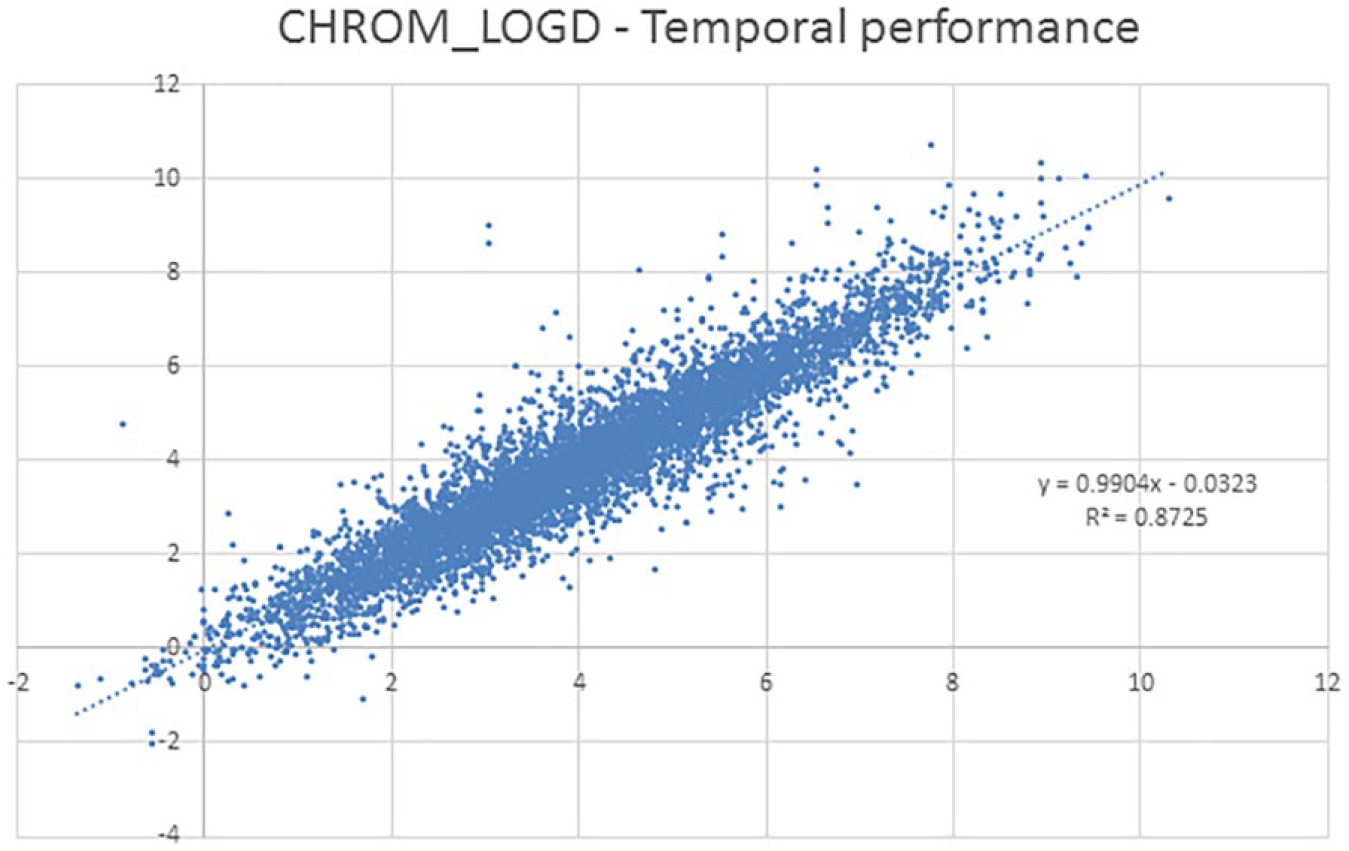
A recent review of the latest GlaxoSmithKline Chrom LogD7.4 data, illustrating the excellent performance of the latest model versus calculated values.
The development of QSAR models of these properties furnishes input descriptors to build QSARs around more complex ADME-related endpoints, such as permeability or clearance. In an ideal world, 104 models would guide the design molecules with the correct balance of desired properties to achieve the target profile; progress has been made toward this utopia, but predictors cannot yet enable the medicinal chemist to predict bioavailability, half-life, and potency with confidence, ultimately giving a better indication of the likely final dose. Accurate predictions of the fundamental physicochemical properties provide the building blocks toward achieving these goals.
Conclusions
In conclusion, this perspective describes the commonly used physicochemical properties and how they are assessed, measured, and predicted, while highlighting the implications of these properties being suboptimal through all phases of drug discovery. Lipophilicity in particular, based on improved measurements, is a well-predicted descriptor, and such in silico models are the cornerstones of predictive methods that are increasingly used to drive drug discovery programs in predict-first cultures. Solubility is also very important, but it is sometimes not well predicted, although aide-memoires such as avoiding (high-melting) brick dust and (lipophilic) greaseballs 105 are principles embodied in the GSE. 96 Analyses suggest that no one-size-fits-all prescription for defining “drug likeness” exists, but making a compound as hydrophilic as possible without loss of efficacy 89 is a defining principle of good practice. 78 Following these principles, driven by judicious predictions in the design phase, will expedite the small-molecule discovery process and lead to improvements at all stages of the process, 106 from less false positives (or negatives) in vitro to better ADME outcomes, 107 fewer developability risks, 97 and better harmonization of in vitro versus in silico data. 108 This will ultimately lead to the progression of compounds into the clinic with better physical properties, which will lead to better predictability of outcomes 109 and, ultimately, a greater chance of success in the costly clinical development phases. The use of predictive physicochemical design is not yet universal in drug discovery, but it is one computational method with tangible and demonstrable impact. Making fewer, better-designed compounds is surely a rational way forward to improve productivity.
Footnotes
Declaration of Conflicting Interests
The authors disclosed the following potential conflicts of interest with respect to the research, authorship, and/or publication of this article: All authors were employed by GlaxoSmithKline at the time of the work on the article and their research and authorship of this article was completed within the scope of this employment.
Funding
The authors received no financial support for the research, authorship, and/or publication of this article.