
Abstract
The development of new drugs depends on the efficiency of drug screening. Phenotype-based screening has attracted interest due to its considerable potency for the discovery of first-in-class drugs. In general, fluorescently labeled imagery is the leading technique for phenotype-based screening; however, there are growing requirements to understand total culture profiles, which are unclear after end-point assays. In this study, we demonstrate that morphology-based cellular evaluation of unlabeled cells is an efficient approach to evaluate myotube formation assays. One of our aims was to study the myogenic differentiation process in C2C12 cells to discern the differences between cellular responses to different medium conditions (serum concentrations and insulin dosages). Our results show that predictive morphological profiles that strongly correlate with myogenic differentiation can be generated from myotube images, even in the confluent stage. The differentiation rate after 14 days can be quantitatively predicted with the highest accuracy by means of images taken on days 0–11.5. In addition, for the application of our morphology-based cellular evaluation, the effect of cyclic guanosine monophosphate (cGMP) on myogenic differentiation was analyzed. Our results show that the quantitated morphological profile from these images can be an effective descriptor for analysis of the myotube-recovering effect of cGMP.
Introduction
Efficient drug screening is vital to the development of novel drugs. There are two categories of screening methods: target-based screening and phenotype-based screening. Target-based screening is a method of detecting drugs with high affinity by calculating interactions between candidate compounds and target proteins related to a symptom. As molecular biology and genetic engineering have advanced, target-based screening has achieved significant successes. 1 Nevertheless, phenotype-based screening has also attracted substantial interest. Phenotype-based screening is a method for identifying drugs with high specificity for phenotypic traits such as cell proliferation, cell morphology change, or cell death. This method has the advantage of enabling the discovery of a drug candidate without knowledge of its mechanism of action and has made useful contributions to finding first-in-class drugs. 2
There are, however, several challenges posed by the cell-based assays performed during phenotype-based screening procedures. What limits the throughput of phenotypic screens is mostly the large number and complexity of the steps in the assay protocol (including washes), the slow speed of data acquisition and analysis, and the large amount of generated data that makes processing and analysis complicated and slow. In many cases, the assay windows are small and can reduce assay robustness and make screening a challenge when researchers use nonclonal cell lines or primary or induced pluripotent stem cell (iPSC)-derived cells.
Another aspect of phenotype-based screening for which improvements are sought is the method of measuring cellular responses. High-content screening (HCS) is a progressing technology enhanced by automation, which is currently leading such cell-based assays.3–5 Data acquired by HCS are based on images of fluorescently labeled cells, in which multiple parameters describing cellular responses are analyzed using image processing techniques. For fluorescent cellular analysis, recent advances in technology relating to antibodies, fluorescent probes, and genetically introduced fluorescent proteins play important roles. However, the labeling-based schemes used in HCS are normally costly and time-consuming, and their evaluation tends to be based only on an end-point assay.
As an alternative scheme for measuring cellular responses in cell-based assays, we have been investigating morphology-based cellular evaluation. This uses phase-contrast microscopic images, which are processed by image and data processing techniques to extract multiple parameters of cellular morphology simultaneously. Advantages to this approach are its (1) low-cost, (2) high-throughput, and (3) real-time detection and evaluation. We have reported the efficient application of this method to the quality assessment of mesenchymal stem cells6,7 and iPSCs 8 and to the screening of PC12 cells. 9
In this work, we demonstrate that our morphology-based cellular evaluation method can be applied to myotube formation assays for drug screening. As a model case, we have evaluated the cellular responses of C2C12 cells, which form multinuclei cells and acquire morphological features of differentiating muscle cells.10,11 Recently, such myotube formation assays have been recognized as effective in vitro for the study of skeletal muscle pathologies, including atrophy, 12 dystrophy, 13 and sarcopenia. 14 The evaluation of myoblast differentiation can serve as an important screening tool, particularly for the study of myotube responses in vivo. In spite of the wide usage of myotube formation assays, they elicit several concerns. First, a differentiation assay takes a significant amount of time (1–2 weeks). Second, observation of differentiation can be naïve, because bulk measurement using stains such as myosin or myogenin 15 suffers from a lack of sensitivity owing to heterogeneity in myotube formation, and can fail to detect the responses of small subpopulations. Third, counts of fused and elongating myotubes with multiple nuclei, which are some of the criteria of differentiated cells, can be biased. This is because there is no clear quantitative definition of such “fused and elongating myotubes.”
To overcome these concerns, we here show that image-based parameter description of myotubes can support the quantitative evaluation and prediction of myogenic differentiation. This involves measurement of C2C12 myotube differentiation responses under different medium conditions (serum concentrations and insulin doses), screening, and quantitative analysis ( Fig. 1 ). Our results show that images of confluent myotubes contain predictive information that strongly correlates with their actual differentiation state. As a result, the myotube differentiation rate after 14 days can be quantitatively predicted with the highest accuracy from images taken on days 0–11.5 without staining. Therefore, our scheme can be applied to reduce biases in myotube formation assays.
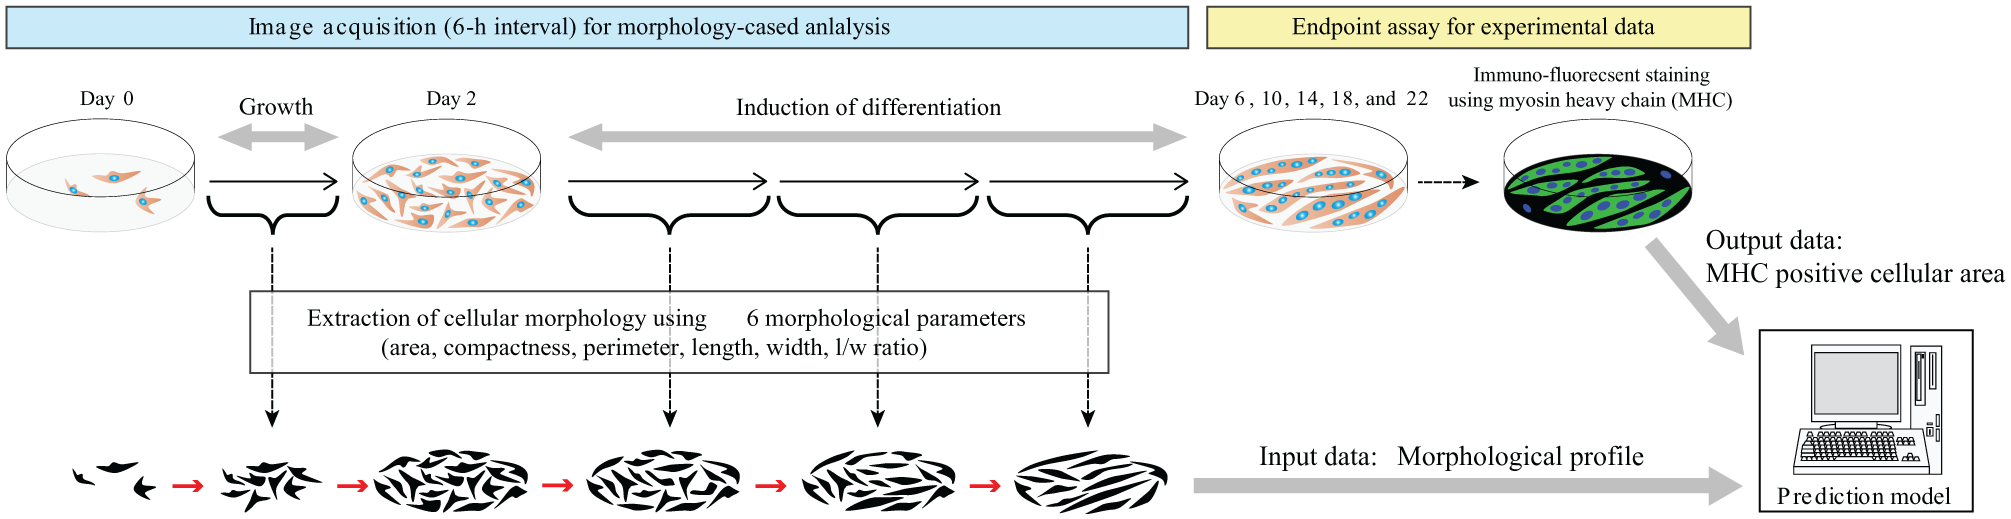
The experimental scheme used in this study. Subconfluent C2C12 cells were cultured in three different conditions (A–C). On days 2, 6, 10, 14, 18, and 22, the cells were stained for MHC, and its staining area was quantified by image analysis. During culture, the acquired images were processed to extract cellular morphology using six morphological parameters. Using the morphological parameters and the MHC-stained area as a training dataset, a prediction model was constructed.
Materials and Methods
Cells and Cell Culture
C2C12 mouse myoblast cells were obtained from RIKEN Cell Bank (Tsukuba, Japan). C2C12 cells were seeded at a concentration of 5.0 × 10⁴ cells in type Ι collagen-coated 24-well plates (AGC Techno Glass Co., Ltd., Shizuoka, Japan). C2C12 cells (passage 5) were maintained in the growth medium (Dulbecco’s modified Eagle’s medium [DMEM]; Wako Pure Chemical Industries, Ltd., Osaka, Japan) supplemented with 10% fetal bovine serum (FBS) (Life Technologies Japan, Ltd., Tokyo, Japan) and 10 mM 4-(2-hydroxyethyl)-1-piperazineethanesulfonic acid (HEPES) buffer (Nakarai Tesque Inc., Kyoto, Japan). When cells reached subconfluent status, myogenic differentiation was induced by changing the medium to the differentiation medium (low-glucose DMEM [Wako Pure Chemical Industries, Ltd.] supplemented with 2% horse serum [Life Technologies Japan, Ltd.] and 10 mM HEPES buffer) with or without insulin (1 μg/mL) (Wako Pure Chemical Industries, Ltd.) or 8-(4-chlorophenylthio)-guanosine 3′,5′-cyclic monophosphate sodium salt (8-pCPT-cGMP) (0.1–1 mg/mL) (Sigma-Aldrich Japan Co., Tokyo, Japan) for a maximum of 20 days. The medium was refreshed every other day. For the 8-pCPT-cGMP effect assay, we evaluated three lots (passages 5, 8, and 11) of C2C12 cells with different passage numbers for obtaining a robust cellular effect.
Immunofluorescence Staining
On days 2, 6, 10, 14, 18, and 22 after differentiation induction, cells were washed with phosphate-buffered saline (PBS) (Nissui Pharmaceutical Co., Ltd., Tokyo, Japan) and fixed for 15 mins in 2% paraformaldehyde (Wako Pure Chemical Industries, Ltd.). The cells were washed with PBS containing 0.2 M glycine (Wako Pure Chemical Industries, Ltd.) and permeabilized in PBS containing 0.3% Triton X-100 (Wako Pure Chemical Industries, Ltd.) for 30 min. After blocking in PBS containing 3% bovine serum albumin (BSA) (Wako Pure Chemical Industries, Ltd.) overnight at 4 °C, a primary antibody (anti-myosin heavy chain [MHC] mouse IgG, Merck Millipore, Billerica, MA) was incubated for 1 h at room temperature with the cell samples, and then a secondary antibody (Alexa Fluor 488-conjugated goat anti-mouse IgG [H+L] antibody, Cell Signaling Technology Inc., Danvers, MA) was incubated for 30 min at room temperature. After immunostaining, nuclei were stained with SYTOX Blue (Thermo Fisher Scientific Inc., Waltham, MA).
Image Acquisition
Phase-contrast and fluorescent images of C2C12 cells were acquired using a Biostation CT (Nikon Corp., Tokyo, Japan) at 4× magnification. One visual field in the center position was analyzed in each well with automatic focusing, and all phase-contrast images were acquired once every 6 h for a total of 22 days.
Image Processing
All microscopic images were processed and quantified using CL-Quant software version 3.2 (Nikon Corp.). Phase-contrast images were recognized in four steps: (1) background adjustment, (2) cell recognition, (3) filling in blanks of cells, (4) removing noise, (5) eroding and dilating cells, and (6) quantification of cell morphology ( Suppl. Fig. S1 ). Morphological profiles using six parameters (area, compactness, perimeter, length, width, and length/width [L/W] ratio) were determined in the recogniszd cellular objects after step 5.
Statistical Analysis
Hierarchical clustering was applied to analyze the morphological profile in each culture condition (conditions A–D). The averages (AVE) and standard deviations (SD) of morphological profiles were calculated from data on 500–1000 cells per image at each time point ( Suppl. Fig. S1 ). The calculated raw data were then normalized for each parameter by standard normalization (the normalization procedure set the mean of the data to 0 and SD to 1.0). Therefore, the parameters finally used in this work had no units and were represented by the data whose center was 0 and which were spread toward both positive and negative values, with their SD being 1.0. Hierarchical clustering was performed with R software (version 3.1.0, R Development Core Team, https://www.r-project.org/) using a complete linkage by correlation coefficient.
Construction of a Prediction Model
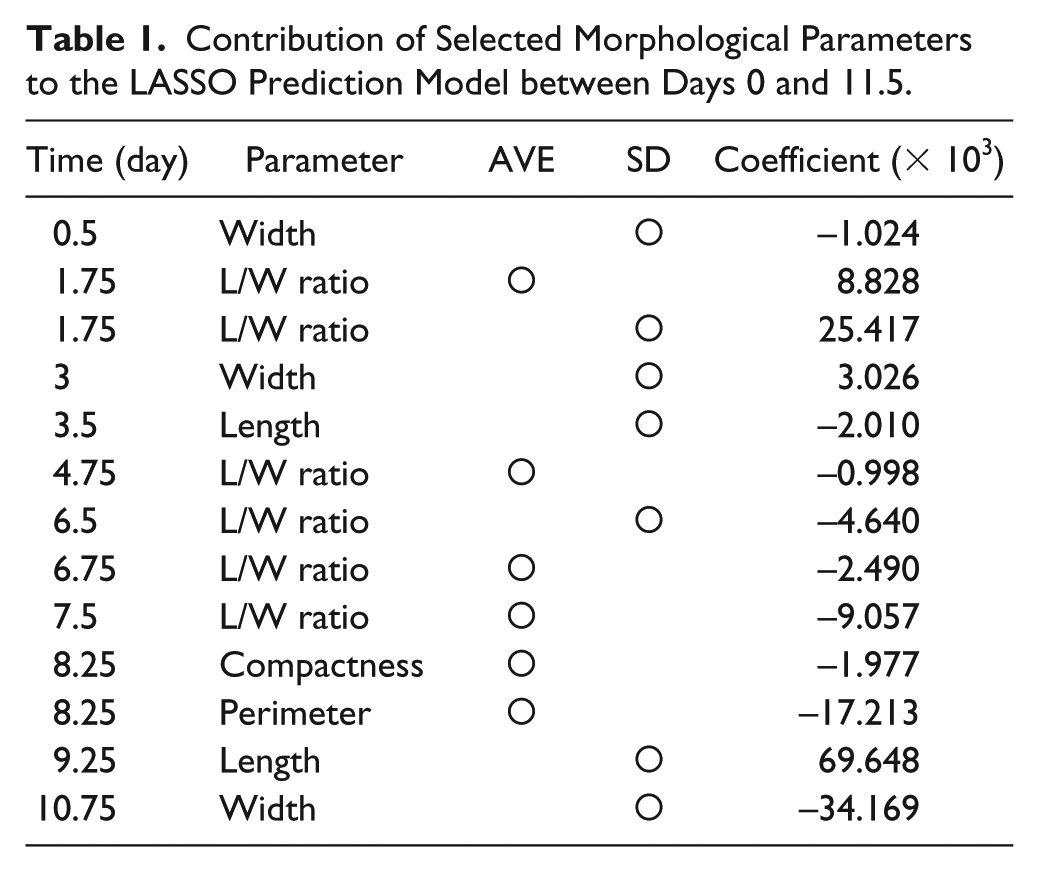
Total morphological profiles obtained from phase-contrast images were used for construction of regression models that predict the MHC-positive cellular area. In this work, least absolute shrinkage and selection operator (LASSO) regression models trained with input data (morphological profile) were used in combination with output data (the differentiation rate experimentally determined by MHC staining and quantification of the stained area). Via construction of the LASSO regression model, only the best combinations of morphological parameters were automatically explored for the prediction ( Table 1 ). Image data used for morphological profile extraction were taken from the noninduction growth period (0–2 days after seeding) and the myogenic differentiation period (2–22 days after seeding; total 20 days). The prediction model was constructed by training 20 datasets (condition A = 4 datasets; condition B = 12 datasets; condition C = 4 datasets). Each dataset was produced by end-point MHC staining; therefore, four types of prediction model were constructed: on day 10 (0–10 days of morphology and MHC staining on day 10), day 14 (0–14 days of morphology and MHC staining on day 14), day 18 (0–18 days of morphology and MHC staining on day 18), and day 22 (0–22 days of morphology and MHC staining on day 22). In addition, to investigate the effect of time-course data usage on prediction accuracy, total time-course information was shortened by each time point, and model performance was examined comprehensively. In such time-course data reduction examination, prediction accuracy was plotted by root mean square error (RMSE), which is derived from differences between predicted value and experimentally determined value. Simply put, the lower the RMSE value, the higher is the prediction performance. Each prediction model’s performance was evaluated by leave-one-out cross-validation. R (version 3.1.0, R Development Core Team, https://www.r-project.org/) was used in the analysis.
Contribution of Selected Morphological Parameters to the LASSO Prediction Model between Days 0 and 11.5.
Results
Measurement of Myotube Differentiation in Different Culture Conditions
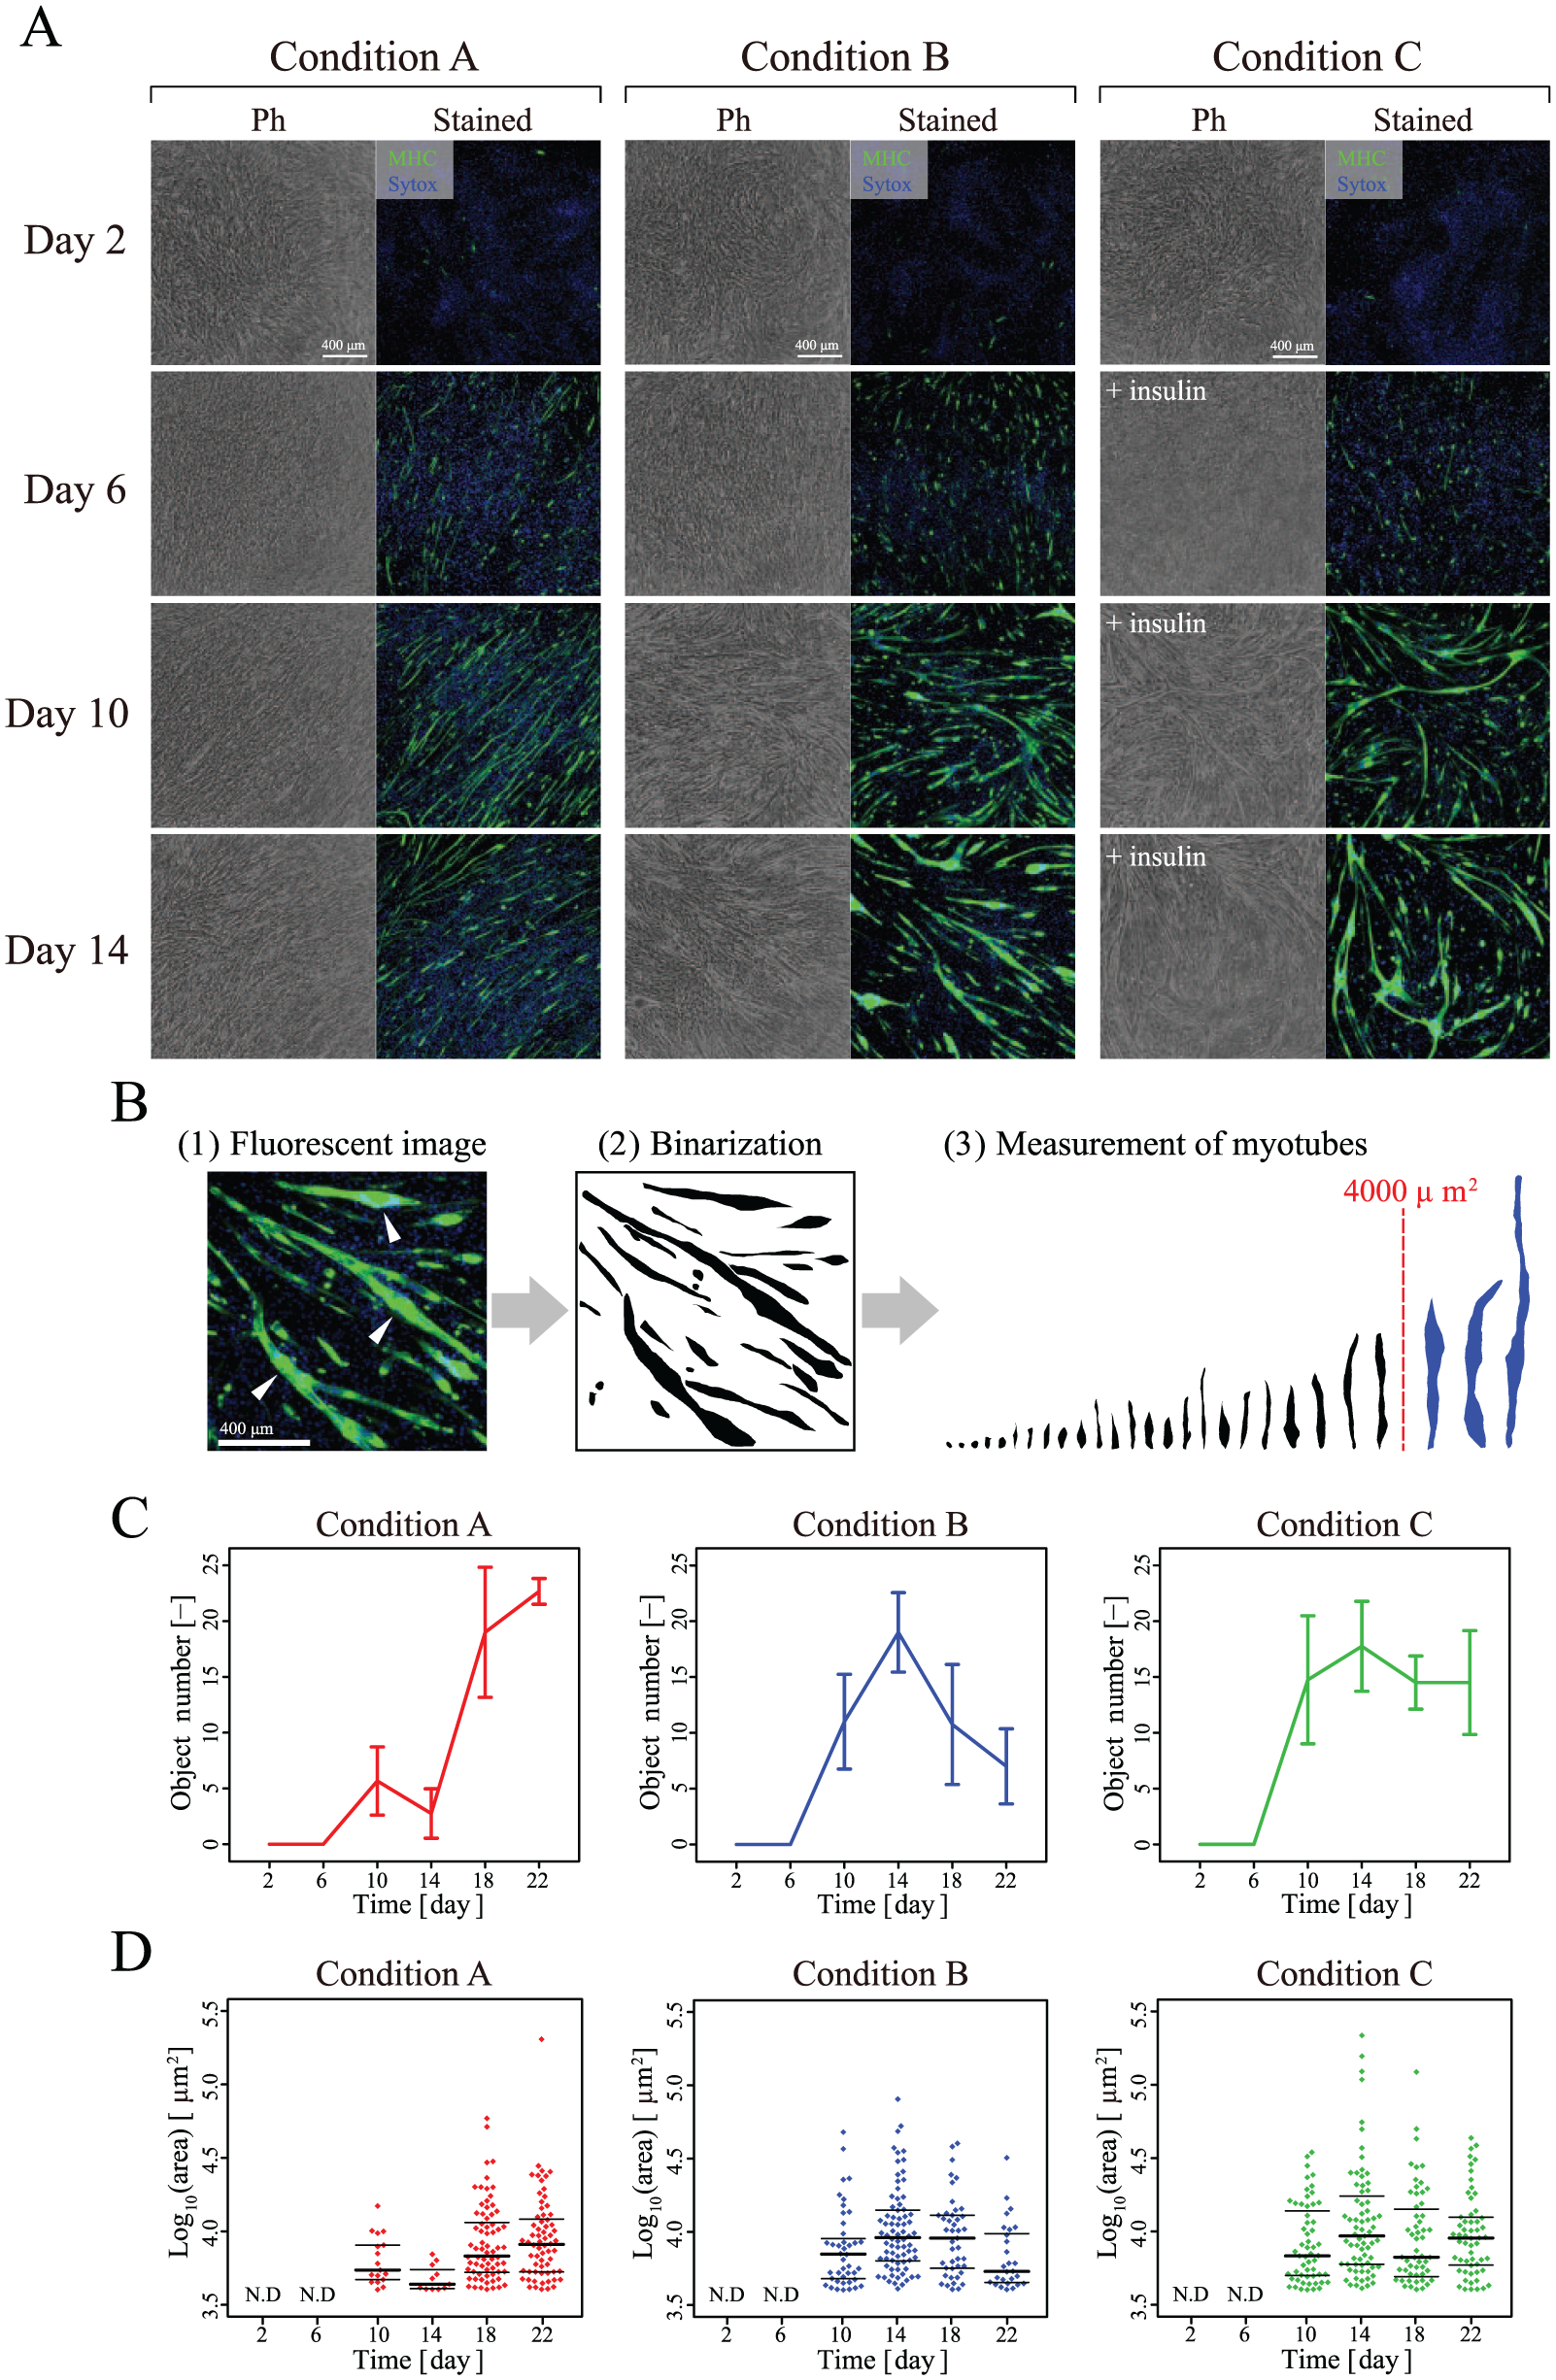
It is well established that a reduction of serum concentration in a culture medium triggers differentiation of C2C12 cells into myotubes.16,17 As part of this process, myoblasts start to fuse to each other and elongate by escaping from the cell cycle in favor of proliferation. As a result, large and elongated cells with multiple nuclei, a measure of myotube formation that correlates with the MHC, start to appear in the population. To establish a quantitative image-based measurement scheme for describing such myotube formation, we first prepared three types of culture conditions: a negative control consisting of the differentiation medium containing 10% FBS, which is commonly used as a growth medium (condition A), the differentiation medium containing 2% horse serum (condition B), and the differentiation medium containing 2% horse serum and 1 μg/mL insulin (condition C). Insulin is known to promote muscle differentiation of C2C12 cells.18,19 During 22 days of differentiation culture, phase-contrast images were acquired as “label-free morphology data” at 6 h intervals. In parallel with this culture, differentiation rates were experimentally determined by MHC staining (on days 2, 6, 10, 14, 18, and 22) ( Fig. 2A ).
Measurement of myogenic differentiation. (
In the stained images, if differentiated myotubes are defined as “large cells with multiple nuclei resulting from cellular fusion,” the C2C12 cell line showed such cells in conditions B and C, whereas their differentiation was incomplete in condition A, resulting in elongating cells that remained thin and single. In conditions B and C, differentiated myotubes started to appear from day 10; however, their growth gradually stopped or decreased. By comparison, in condition A, myoblasts did elongate, but did not show fused large differentiated myotubes throughout the culture.
Conventionally, such differentiated myotubes are counted in stained images at researchers’ discretion, and there is no quantitative definition. In our analysis, stained myotubes with MHC over 4000 μm2 were defined as “differentiated myotubes” ( Fig. 2B ), and their average number ( Fig. 2C ) and size distribution ( Fig. 2D ) were analyzed. These results show that our protocol consists of clear condition-dependent differences that can be clarified by fluorescent image analysis.
Quantitative Prediction of Myotube Differentiation by Morphological Analysis of Phase-Contrast Images
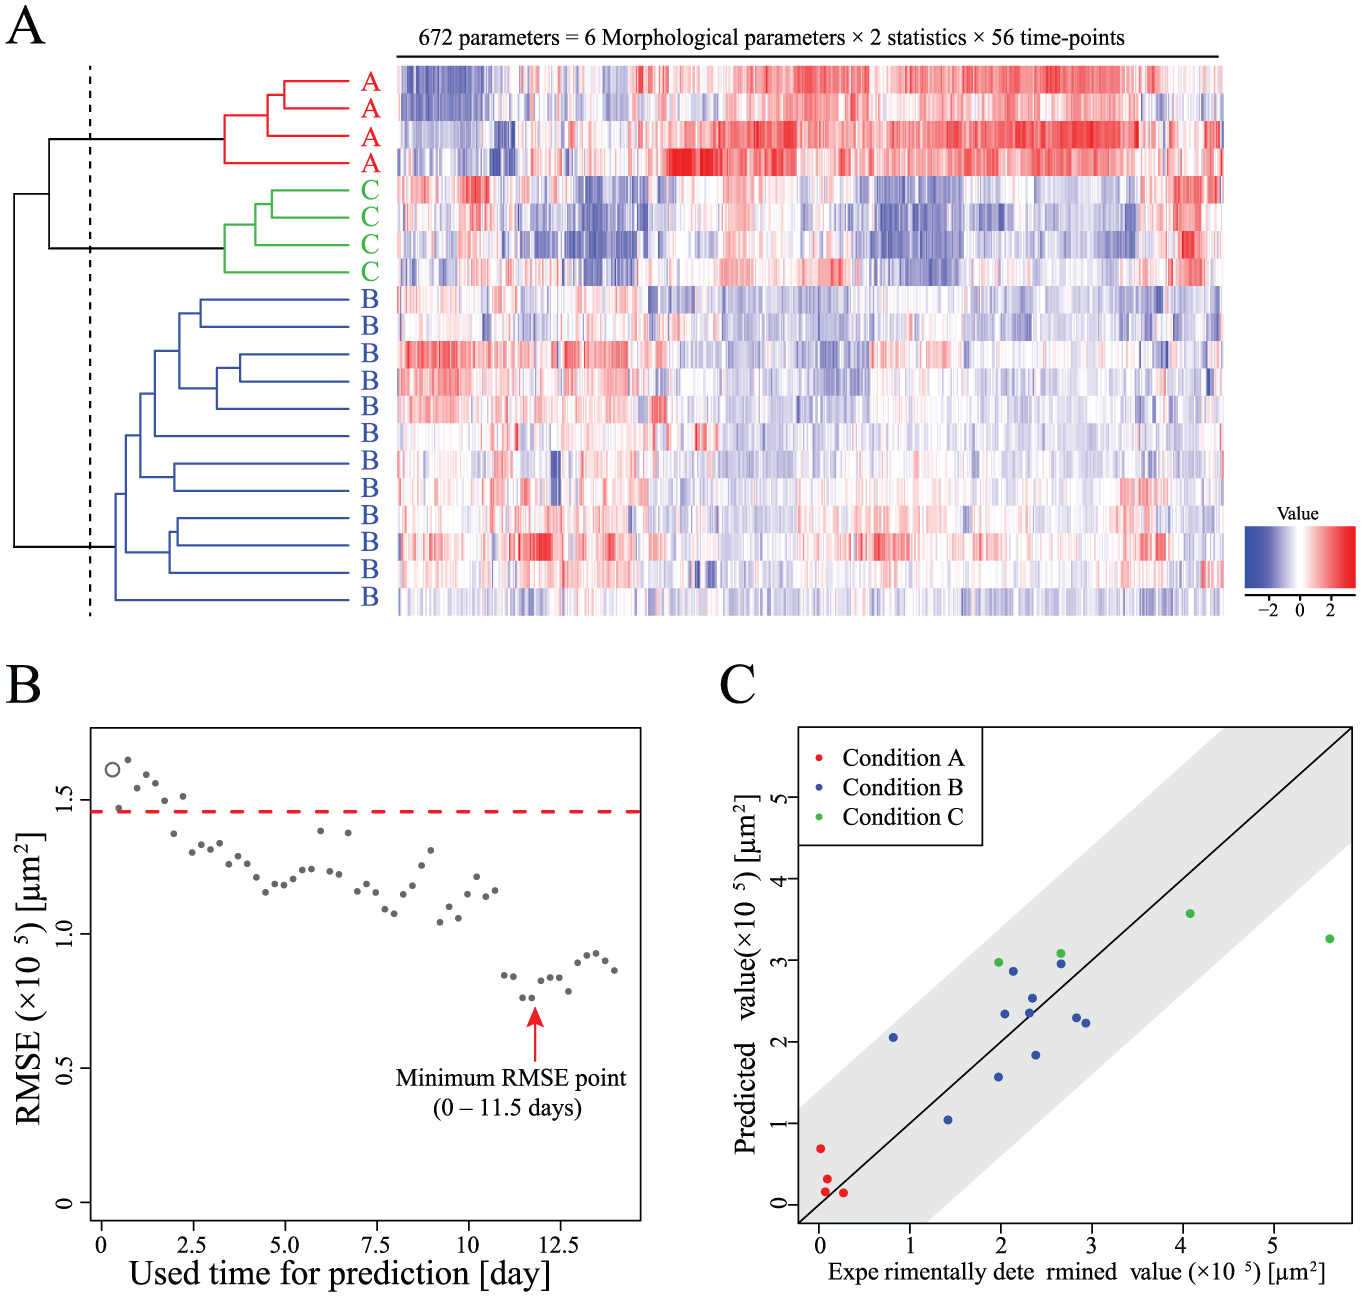
To investigate whether the morphological profile of nonlabeled cells can represent the effects of different culture conditions, we performed morphology-based evaluation. Briefly, we first identified the cellular objects in images of each time point—not only the differentiated large myotubes but also the undifferentiated cells in the visual field. Then, we measured six morphological parameters (area, compactness, perimeter, length, width, and L/W ratio) for every cellular object in the image. These were converted into statistics representing the “group of cells” in the image: AVE and SD of six morphological parameters calculated from data on 500–1000 cells per image (see Materials and Methods). This morphological profile was determined at 56 time points (6 h intervals) and was used as the total morphological profile of a condition (672 parameters = 6 parameters × 2 statistics × 56 time points) ( Fig. 3A ). To compare these profiles, hierarchical clustering, which objectively describes correlations between multiparameter profiles, was applied. The results for each culture condition condensed as individual clusters, indicating that the morphological profiles of myotubes are similar, and represent the differences between culture conditions.
Morphological analysis of myotube formation in response to culture conditions. (
Next, to investigate predictive performance, the prediction model was constructed by training the datasets of morphological parameters from the phase-contrast images (0–14 days), and the MHC-positive cellular area was determined by means of images of fluorescently stained cells (day 14) ( Fig. 3B ). As a result, the MHC-positive cellular area, which can be obtained only destructively after 14 days, can be predicted with images from days 0–4, which start to manifest low RMSE. The prediction accuracy increases more when the images being analyzed cover more than 0–10 days and is maximized with images from days 0–11.5 (accuracy = 95%, based on 19/20 images; Fig. 3C ). Such a positive effect of accumulation of the morphological information for its high prediction performance can only be obtained because our evaluation is live and continuous and involves nondestructive image assessment. Considering the possibility of use in the screening, this nondestructive assay should also be advantageous because of its low cost and high throughput. Highly weighted parameters selected for the prediction model were length, width, and L/W ratio, representing the “elongation feature” ( Table 1 ). In contrast, other parameters relating only to “size” were not selected. From the time course, both the early and late periods of differentiation were selected. From these results, the prediction rule could be interpreted for further understanding of the phenotypes.
Application of Morphological Profiles of Phase-Contrast Images for Estimating the Performance of a New Culture Condition
To extend the usage of the morphological profiles that we extracted from continuous images of C2C12 cells during their differentiation, we examined them in an additional culture condition (condition D). Condition D included cGMP (0.1 mg/mL) from the first day. cGMP has been reported to reverse mitochondrial dysfunction in C2C12-derived myotubes,20,21 but its performance and usage protocol have not been quantitatively examined. First, the effects of condition D were monitored via phase-contrast images and MHC staining patterns ( Fig. 4A ). The MHC staining results gradually increased during the culture period and reached a maximum on day 14. The quantification of the fluorescent images provided quantitative kinetics of differentiation and correlated to observation ( Fig. 4B , C ). Second, by using the total morphological profile representing differentiation on day 14, condition D was clustered together with conditions A–C ( Fig. 5 ). As a result, condition D clustered in the same cluster as condition B (2% horse serum) and diverged from condition A (10% FBS) and condition C (2% horse serum with insulin). Third, differentiation was predicted in condition D using the constructed prediction model, which predicts the MHC cellular area after 14 days of differentiation. The prediction accuracy was 100% (4 images/4 images).
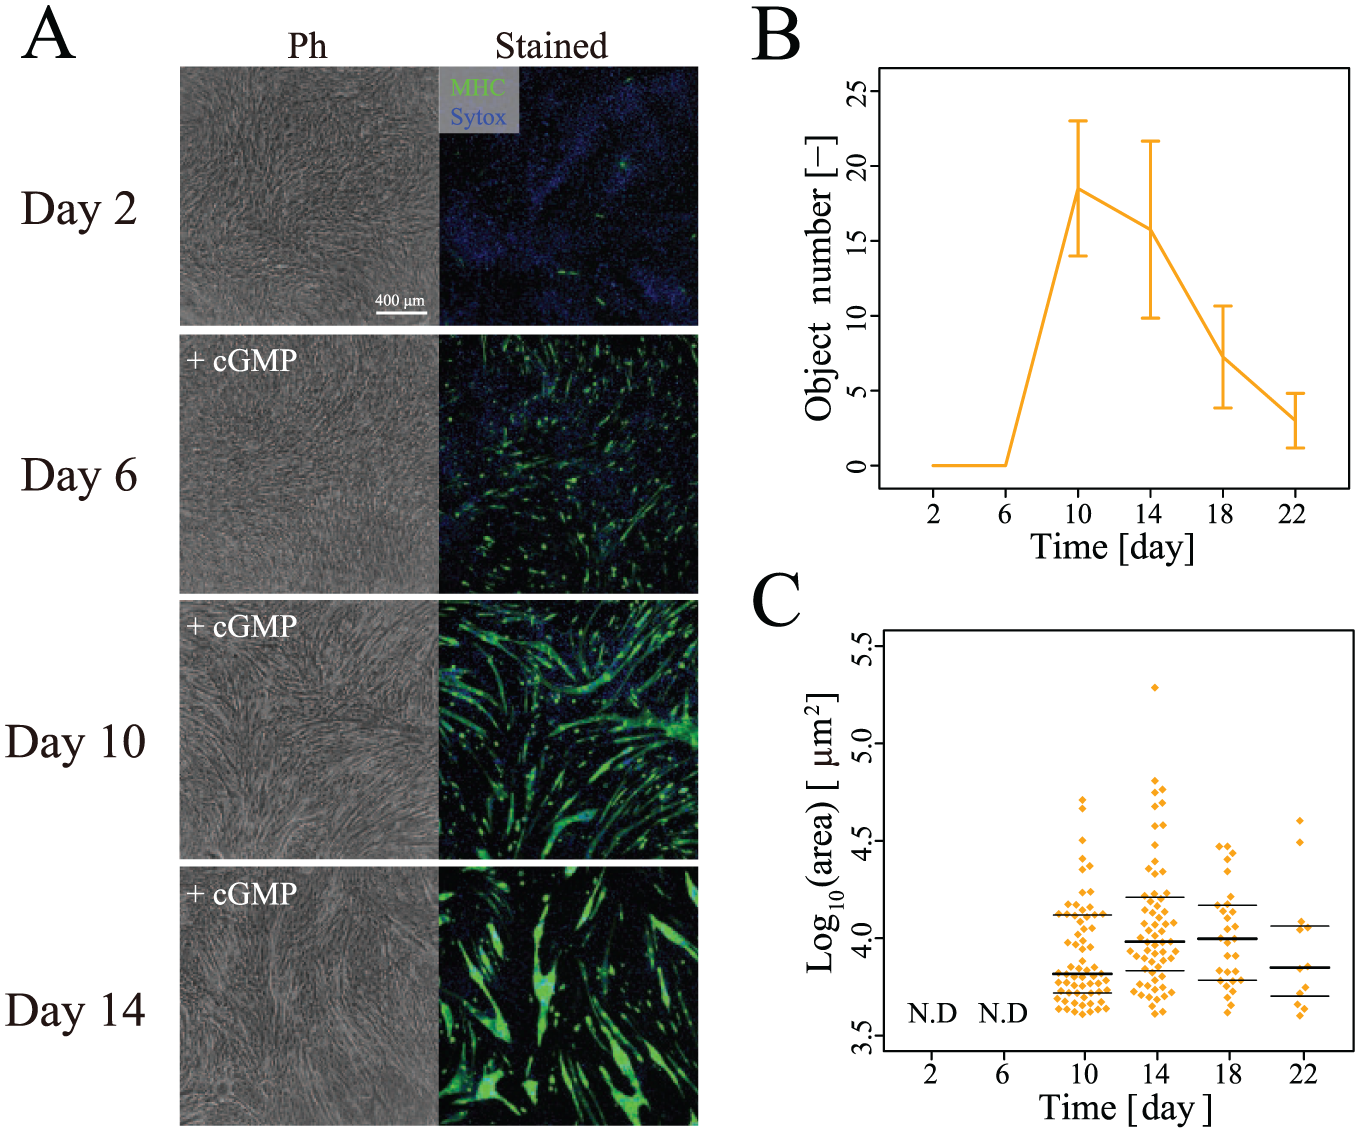
Measurement of myogenic differentiation in condition D. (
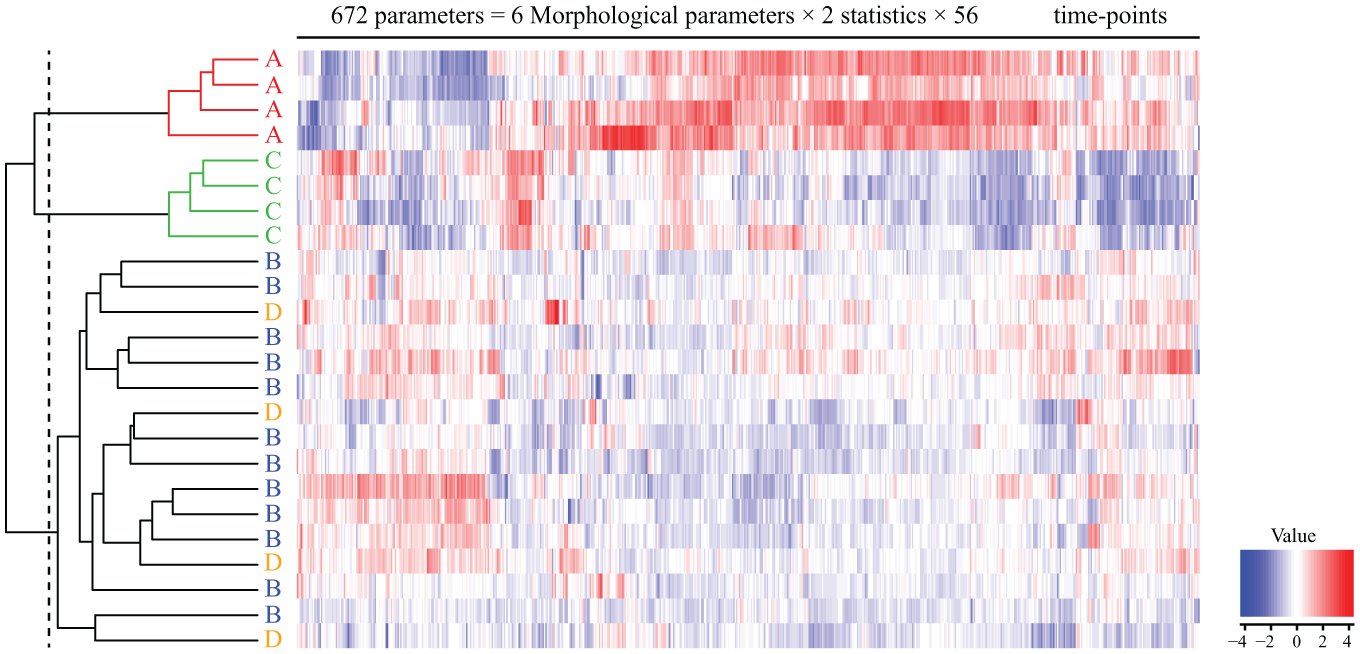
Hierarchical clustering of morphological profiles obtained from phase-contrast images within 0–14 days. Conditions A (N = 4), B (N = 12), C (N = 4), and D (N = 4) are indicated by capital letters. The dashed line on the hierarchical tree indicates the point of no correlation (correlation coefficient = 0).
Discussion
To investigate the applicability of morphological analysis of nonstained images, we applied morphological evaluation to a myotube formation assay. Myotube formation assays are morphology-based assays frequently used in the study of muscle-related symptoms. Our objective was to investigate the effectiveness of our profiling method, which extracts morphological profiles representing time-course changes of cellular populations for predictive evaluation of myoblast differentiation.
In this work, we compared four different culture conditions using morphological profiles extracted from phase-contrast images. Using more than 500 morphological parameters, the similarities between culture conditions were clustered without training their labels. In other words, our results indicate that time-course morphological changes can reflect the characteristics of myoblast responses to their culture media. Given that our method requires only label-free phase-contrast images, such live monitoring information can be obtained at low cost and in a high-throughput manner by the phenotype-based screening.
To further explore the potential of such “morphological profiles,” we then trained a computer to construct a quantitative prediction model for noninvasive evaluation of cellular differentiation. Prediction of day 14 MHC cellular staining state showed that the time-course image usage can predict the future differentiation rate solely from a morphological profile.
One of the reasons we were able to attain such high predictive performance was our method’s characteristic morphological feature extraction. In our profiling, image data are converted into parameters, and once measured, individual morphological parameters are finally converted into statistical descriptors of a cellular population (500–1000 cells in total). Previously, we reported the effectiveness of such profiling parameters in mesenchymal stem cells. On the basis of the data in this work, we also showed that morphological parameters are descriptive when they represent the “heterogeneity” of a cellular population. Especially in myotube formation, not all the cells in a population respond to the myotube, and therefore the description parameter for the balance of a cellular population can be effective. Moreover, our previous reports also indicate that quantification of time-course changes is also effective for analysis. After 14 days of morphological transition, the clustering and prediction models showed high performance. The weight interpretation in our model could also provide insight into the phenotypic reactions of myoblasts. In the weighted parameter list, both AVE and SD, representing population characteristics, together with their substantial change rate from the early to late period, were found to be important morphological indicators.
To the prediction of MHC-positive cellular area after 14 days, we also coupled other time-point predictions in parallel: prediction of the MHC-positive cellular area on days 10, 18, and 22 ( Suppl. Fig. S2 ). When the image data use period was comprehensively examined for exploring the best prediction combination for the MHC-positive area on day 10, no model could show significant prediction performance. Such failure of prediction model construction was also observed in the prediction of the MHC-positive area on days 18 and 22. This result indicates that not every type of morphological profile could lead to the prediction of myogenic differentiation. From the aspect of dataset quality, at least two factors could trigger such failure of prediction. One is the absence of positive data, that is, of positively stained differentiated myotubes, on day 10. At this stage, myoblasts have not yet been differentiated; therefore, not enough positive data (stained images) were in the training dataset. In contrast, for differentiation culture beyond 14 days, there were MHC-stained myotubes, albeit thin and not greatly expanding, even in the visual field of the negative control (condition A). Around this stage, the positive controls (conditions B–D) lose stained large myotubes rapidly. In other words, after day 14, the “answer” for training, in particular, the rate of staining of myotubes, decreases in the total stained area, thus resulting in a drop of the signal-to-noise ratio. With such data, machine learning does not succeed in producing high-performance models. Therefore, this investigation suggests that morphological prediction models have to be carefully designed to obtain fair sample numbers of both positive and negative data that can reflect the assay’s objective.
As a test case for our morphological prediction scheme for the evaluation of culture conditions, a cGMP addition effect was evaluated in condition D. Biologically, the MHC staining showed that GMP addition did not alter differentiation compared with condition B. Condition D showed a morphological profile nearly identical to that of condition B in clustering analysis, and its MHC-positive cellular area prediction could be accurately performed using our model. This result indicated that such “nontoxic” or “nondamaging” evaluation can be estimated by morphological profiling, or prediction evaluation using machine learning models.
To further extend our evaluation of the effects of culture conditions on predictive performance, we next added cGMP in condition B, only on day 18, the point at which the MHC-stained cellular area decreased following its differentiation peak. The MHC staining result showed that 10×, but not 1×, cGMP addition significantly recovered the MHC staining cellular area ( Suppl. Fig. S3 ). Since this recovery occurred in 6 days, the previously constructed prediction model trained with 14 days of morphological profiles could not be applied. However, when the morphological parameters were applied to show a time-course change, a characteristic change reflecting the effects of 10× cGMP promoting muscle differentiation could be visualized. Although the sensitively changed morphological parameters were different from the weighted parameters in the prediction model (0–14 days), detailed changes occurring in response to cGMP could be detected. Therefore, such morphological profiling can be considered applicable to such compound screening for differentiation culture.
Moreover, because of its noninvasive style, our morphological profiling can be combined with other types of target-based assays apart from myotube differentiation assays. Noninvasive phenotypic profiling can enhance other drug screening assays, which have required conventional cell staining assays aside from the target-based assays.
To further improve the prediction performance of our presented method, introduction of other image quantification techniques from advanced high-content image analysis is an effective approach. In our present analytical procedure, we simply measured the myotube differentiation rate via the MHC-positive area and used these data for machine learning as teacher signals. Nonetheless, there are other quantification concepts that have been proposed in the studies on HCS, for example, the fusion index reported by Young et al., 22 which can be a more stringent descriptor for a disease phenotype. To combine wider varieties of both multicolor marker staining and the new concepts of the parameter index is certainly the aim of our next study, which is intended to enhance the performance of our proposed morphology-based analysis.
In summary, based on our evaluation method using morphological profiling of myoblast populations responding to myotube differentiation conditions, our data indicate the good potential of our morphological analysis concept for application to various cell differentiation assays. Our proposed concept can reduce the cost and increase the throughput of cell-based screening procedures greatly because it requires only nonstained continuous images of cells. Inhibitors or enhancers found through cell differentiation studies are among leading therapeutic compounds, and our concept should facilitate and promote studies of muscle differentiation. It is a fact that whether we can robustly apply our methodology to other types of myoblasts is the next important question to address in detail. Nevertheless, our morphological analysis concept based on statistical features of groups of cells has been successfully applied to a variety of cell types (mesenchymal stem cells,6,7 adrenal gland cells, 9 and other cells [PCT Patent WO2011021391A1]), including different lots. Therefore, we consider the applicability of our methodology to be broad. Future work may include extension of our concept to a wider range of compound screening procedures involving patient-derived human myoblasts, which are now expected to be carried out in the studies on myotonic dystrophy type 1.23,24
Supplemental Material
Supplementary_Information_Image-based_prediction_of_myotube_formation_by_Ishikawa_and_Yoshida_etal – Supplemental material for Morphology-Based Analysis of Myoblasts for Prediction of Myotube Formation
Supplemental material, Supplementary_Information_Image-based_prediction_of_myotube_formation_by_Ishikawa_and_Yoshida_etal for Morphology-Based Analysis of Myoblasts for Prediction of Myotube Formation by Kiyoshi Ishikawa, Kei Yoshida, Kei Kanie, Kenji Omori and Ryuji Kato in SLAS Discovery
Footnotes
Supplemental material is available online with this article.
Declaration of Conflicting Interests
The authors declared no potential conflicts of interest with respect to the research, authorship, and/or publication of this article.
Funding
The authors disclosed receipt of the following financial support for the research, authorship, and/or publication of this article: This research was funded by the Japan Science and Technology Agency (JST) Program for Creating STart-ups from Advanced Research and Technology (START Program to R. K).
References
Supplementary Material
Please find the following supplemental material available below.
For Open Access articles published under a Creative Commons License, all supplemental material carries the same license as the article it is associated with.
For non-Open Access articles published, all supplemental material carries a non-exclusive license, and permission requests for re-use of supplemental material or any part of supplemental material shall be sent directly to the copyright owner as specified in the copyright notice associated with the article.