
Abstract
Enhancing antitumor activities of the human immune system is a clinically proven approach with the advent of monoclonal antibodies recognizing programmed cell death protein-1 (PD1) receptors on immune cell surfaces. Historically, using flow cytometry as a means to assess next-generation agent activities was underused, largely due to limits on cell number and assay sensitivity. Here, we leveraged an IntelliCyt high-throughput flow cytometry platform to monitor human dendritic cell maturation and lymphocyte proliferation in mixed lymphocyte reactions. Specifically, we established flow cytometry–based immunophenotyping and screening methodologies capable of measuring T-cell activation as a result of cell-associated antigens presented on dendritic cell surfaces, as indicated by cell proliferation, cytokine secretion, and surface marker expression. Together, the overall novelty of this 384-well platform is its capability to measure multiple functional readouts in one well and consistently evaluate large numbers of compounds in a single study, as well as its ability to show increased assay sensitivity requiring considerably fewer primary cells and less reagents compared to more traditional 96-well flow cytometry methods.
Introduction
Cancer immunotherapy enhancing antitumor T-cell activity is receiving significant attention due to the favorable clinical responses observed with immune checkpoint inhibitors, such as anti-CTLA4 and anti-PD1 monoclonal antibodies. In turn, significant efforts are focused on developing next-generation therapies enhancing immune cell activities against tumors. For instance, naïve T cells can be induced to proliferate by a variety of stimuli, including pharmacological agents, anti-CD3/T-cell receptor (TCR) or anti-Thy-1 monoclonal antibodies, enterotoxins, lectins, and their cognate antigen. In the context of antigen stimulation, the induction of T-cell proliferation depends on the presence of antigen presenting cells functioning as accessory cells. Such accessory cells, for example dendritic cells (DCs), provide additional costimulatory signals for T-cell proliferation as well as crosslink (via their Fc receptors) antigen-specific antibodies bound to the cell surface. This accessory cell requirement varies with the nature of the stimulatory ligand and ranges from absolute dependence to accessory cell–independent T-cell activation. The resulting outcomes of T-cell activation are cytokine production, activation marker expression, and T-cell proliferation.
Developing immune checkpoint therapeutics either as monotherapies or in combination requires routine use of assays capable of measuring immune cell function. An example is the mixed lymphocyte reaction (MLR), which assesses T-cell proliferation in response to the mismatched major histocompatibility complex (MHC) antigens. 1 In an MLR, peripheral blood lymphocytes from two individuals are mixed together in tissue culture and maintained for several days. In a one-way MLR, only one lymphocyte population can respond and proliferate; whereas in a two-way MLR, both populations can proliferate. In contrast, if no growth is observed, this indicates a decrease in T-cell response. Traditionally 3H-thymidine uptake was used to monitor growth, making this assay sensitive but challenging to reproduce. Now, MLR assays routinely use cell tracer dyes such as carboxyfluorescein diacetate succinimidyl ester dye (CFSE) 2 to label the T cells prior to mixing with the cells from the other individual. Accordingly, cell division is monitored by flow cytometry in which dye partitioning among daughter cells with each cell division is measured, yielding a proliferative index.
Currently, flow cytometry is a mature platform capable of measuring multiple cellular parameters and has numerous applications in drug discovery.3–6 One application uses panels of antibodies recognizing specific cell-surface antigens and identifying responsive cell subpopulations from treated samples. Historically, measuring cellular growth using flow cytometry was not fully exploited due to methodology limitations and sensitivity. Here, the IntelliCyt High-Throughput Flow Cytometry (HTFC) platform (Intellicyt, Albuquerque, NM) is leveraged to monitor human lymphocyte proliferation of purified T cells stimulated by cell-associated antigens contained on DCs. Novel methodologies are described herein, optimizing assay parameters necessary for high-throughput automation as well as maximizing the number of compounds tested, minimizing well-to-well variability, reducing sample size, and enhancing data capture and processing. Collectively, these efforts led to a sensitive translational assay platform reducing hands-on time and primary cell needs, and increasing testing capacities of biologics, compounds, or their combinations on DC-mediated T-cell activation. Moreover, using this platform allows for target identification, pharmacodynamic marker validation, lead assessment and optimization, along with in-depth studies for compound mechanisms of action in primary cells.
Materials and Methods
Cell Preparation
Negatively selected human CD14+ monocytes and naïve CD3+ T cells from healthy donors were purchased as frozen stocks from Biological Specialty Corp. (Comar, PA, USA). Monocytes are slowly thawed and concentrated by centrifugation (300 × g), suspended in differentiation medium [Roswell Park Memorial Institute Medium (RPMI) 1640 medium supplemented with 1 mM sodium pyruvate, 10 mM HEPES (pH 7.5), 1× MEM nonessential amino acids (Gibco; Thermo Fisher Scientific, Waltham, MA, USA), 10% fetal bovine serum (Sigma-Aldrich, St. Louis, MO, USA), 300 ng/ml recombinant human interleukin-4 (IL4; Peprotech, Rocky Hill, NJ, USA), and 100 ng/ml recombinant human granulocyte-macrophage colony-stimulating factor (GM-CSF; Peprotech)], and cultured for 6 days to obtain immature DCs (iDCs). Fresh IL4 and GM-CSF cytokines were added to the culture medium during DC differentiation on day 4, and on day 6 for DCs undergoing DC maturation processes. iDCs were subsequently collected by centrifugation (300 × g); suspended in differentiation medium supplemented with GM-CSF (100 ng/ml), IL4 (300 ng/ml), and lipopolysaccharide (LPS; 1 µg/ml); and cultured for one more day. Mature DCs (mDCs) were then harvested, washed, and suspended in AIM V medium (Invitrogen, Grand Island, NY, USA) for use in MLR assays.
Naïve human T cells were slowly thawed, concentrated by centrifugation, suspended in growth medium (RPMI 1640 supplemented with 10% fetal bovine serum), and incubated for 2 h at 37 °C. Cells were then prepared for MLR assays by labeling with CellTrace Far Red (CTFR) following the manufacturer’s instructions (Thermo Fisher Scientific). Labeled cells were collected by centrifugation and suspended in AIM V medium.
MLR Assays
Cellular activities were monitored in MLR assays by flow cytometry and cytokine profiling. Briefly, CTFR-labeled naïve T cells were mixed with mDCs at fixed ratios, and the mixtures contained in individual wells of 96-well flat-bottom (200 µL cells per well; Corning Life Sciences, Corning, NY, USA), or 384-well flat-bottom (40 µL cells per well; Greiner Bio-One, Monroe, NC, USA) plates were maintained at 37 °C for 4–5 days before collecting culture supernatants for cytokine profiling and harvesting cells for proliferation profiling and immunoprofiling analyses.
Flow Cytometry and Data Analyses
mDC characterization studies: Cells were concentrated by centrifugation (300 × g) at ambient temperature, and culture supernatants removed using a plate washer (Biotek, Winooski, VT, USA). Viability stain components (Live/Dead Violet Viability/Vitality Kit; ViD, Thermo Fisher Scientific) were suspended in Dulbecco’s phosphate-buffered saline (dPBS; Gibco, Thermo Fisher Scientific) and prepared according to the manufacturer’s instructions. Cells were stained at ambient temperature for 30 min according to the manufacturer and concentrated by centrifugation (300 × g) before removing supernatants using a plate washer (Biotek, Winooski, VT, USA). Optimized concentrations of surface antibodies [anti-CD3 FITC (BD 555916), anti-CD83 APC (BD551073), anti-CD86 PE (BD555658), and anti-CD209 PerCP-Cy5.5 (BD558263), all from BD BioSciences, San Jose, CA, USA; and HLA-DR FITC (11-9952-42; eBiosciences, Thermo Fisher Scientific)] or isotype control antibodies [Mouse IgG1,K FITC (BD 555748), Mouse IgG1,K APC (BD555751), Mouse IgG1,K PE (BD555749), and Mouse IgG2B,K PerCP-CY™5.5 (BD558304), all from BD BioSciences; and Mouse IgG2A,K FITC (11-4724-81; eBiosciences, Thermo Fisher Scientific)] were diluted in dPBS supplemented with 1% bovine serum albumin (BSA; A9205; Sigma-Aldrich, St. Louis, MO, USA), added to the cells, and incubated for 1 h (37 °C) before being removed by two washing steps using dPBS containing 1% BSA (50 µL per wash per sample). Cell samples suspended in dPBS containing 1% BSA were analyzed with an IntelliCyt iQue flow cytometer with the following settings: 6 s/well sip time, 2 s/well additional uptime (90 min reading time per plate) at 29 rpm pump speed with 60 s priming, pre-plate shaking for 30 s at 2000 rpm, and interwell shaking for 4 s every two wells. Results were analyzed using Forecyt analysis software (version 4.1; Intellicyt). 6 Median fluorescence intensity (MFI) values were used for all profiling assessments. Changes in surface marker expression are measured by comparing mDC MFI values to iDC MFI values.
MLR Cytokine Production and T-Cell Proliferation
Cytokine levels were measured using BD Cytometric Bead Array (CBA; BD Biosciences) or AlphaLISA (Amplified Luminescence Proximity Homogeneous Assay; Perkin Elmer) bead-based technology following manufacturer protocols. Both methods initially required transferring culture supernatant using a CyBio FeLix liquid handler instrument (Analytik Jena, Upland, CA, USA) from each individual MLR mixture to a corresponding well of a Matrix V-bottom-plate multiwell plate (Thermo Fisher Scientific) for the CBA method (12 µL per well), or transferring 4 µL from each MLR well to a ProxiPlate Plus multiwell plate (Perkin Elmer) for the AlphaLISA method. Cytokines measured by CBA involved preparing and adding the antibody-coated beads and detection beads sequentially into each well containing supernatant according to the manufacturer (BD CBA; BD Biosciences). Bead mixtures were concentrated by centrifugation (300 × g) after a 3 h incubation at ambient temperature, and the supernatants removed using a BioTek plate washer. The beads were gently washed twice using wash buffers provided by the manufacturer and analyzed using an IntelliCyt iQue flow cytometer as described for the mDC characterization studies.
Human interferon-γ (IFNγ) levels were also measured using AlphaLISA technology (AL217F; Perkin Elmer). Briefly, the AlphaLISA anti-IFNγ Acceptor beads and biotinylated antibody anti-IFNγ were mixed according to the manufacturer, then added to each well containing supernatant (4 µL) followed by the addition of the streptavidin (SA) donor beads into each well containing supernatant, acceptor beads, and biotinylated antibody. After a 1.5 h incubation at ambient temperature, IFNγ levels were measured using an Envision multiplate reader, equipped with the ALPHA option, set at the AlphaScreen standard settings (total measurement time: 550 ms; laser: 680 nm excitation; time: 180 ms; mirror: D640as; emission filter: M570w; center wavelength: 570 nm; bandwidth: 100 nm; and transmittance: 75%). Both procedures used recombinant proteins of known concentrations to correlate the sample signal with a quantifiable amount of protein.
To measure T-cell proliferation, cells were concentrated by centrifugation (300 × g) at ambient temperature, and the supernatants discarded using a Biotek plate washer. The cells were stained with viability stains (Live/Dead Violet Viability/Vitality Kit; ViD, Thermo Fisher Scientific) and an anti-CD3 FITC surface antibody (BD 555916; BD Biosciences) suspended in dPBS containing 1% BSA for 1 h (37 °C) before removal by centrifugation (300 × g). Cells were washed once using dPBS containing 1% BSA prior to being analyzed using an IntelliCyt iQue flow cytometer as described for the mDC characterization studies. T-cell proliferation in MLR assays is reported as percent proliferation, calculated as a ratio of [dividing cells (CD3+, CTRF+, ViD−) in a defined live cell gate at end of culture] / [total cells (CD3+, CTRF+, ViD−) at time zero] × 100.
RNA Extraction and Gene Expression Analyses
Total RNA was extracted from cells using the RNeasy Mini Kit (Qiagen, Waltham, MA, USA) following the manufacturer’s instructions. Cytokine and cell-surface antigen gene expression profiles were obtained using nCounter Gene Expression Assay reagents, instrumentation, and protocols (NanoString Technology, Inc., Seattle, WA, USA).
Data Analysis and Statistics
All numerical data were analyzed using GraphPad Prism (version 7.03; GraphPad, La Jolla, CA, USA). All shown p-values were calculated using a paired t-test with the significance threshold set to p < 0.05 (*).
Results and Discussion
DCs are essential for perpetuating immune responses due to their ability to present antigen to their cognate TCR and to express surface markers that engage costimulatory or coinhibitory molecules on the T cell, thereby promoting secreted cytokine production and fostering T-cell activation.7–9 DC subsets include iDCs and mDCs. mDCs are derived from iDCs, and they typically express higher cell-surface costimulatory molecule levels and secrete a variety of cytokines compared to iDCs. Moreover, these attributes make mDCs especially effective for the stimulation of T-cell activities such as cytokine production, receptor expression, and proliferation.10,11 Here, our intention was to modify a previously reported, multiparameter, 384-well formatted HTFC workflow 6 to measure human DC and T-cell functionality. Initially, our work concentrated on optimizing steps to standardize in vitro DC maturation. Hence, purified human monocytes from frozen stocks were maintained in differentiation medium containing GM-CSF (100 ng/ml) and IL4 (300 ng/ml) for 6 days prior to collecting the iDCs, treating them with LPS (1 µg/ml) for 24 h, and harvesting mDCs. Figure 1A shows iDC and mDC surface antigen profiles following the 7-day GM-CSF, IL4, and LPS treatments as determined by flow cytometry. Overall, two well-known DC cell-surface marker proteins, CD83 12 and CD86, 13 are detectable in 81% of the treated, adherent primary human monocyte–derived DCs, thereby demonstrating the differentiation process’ effectiveness toward producing mDCs showing the expected surface marker profile.11,14 In addition, another DC cell-surface marker protein associated with iDCs and macrophages, CD209, 15 is measureable in 26% of the cells following this treatment regimen. Comparable mDC CD83 and CD86 expression patterns are observed for 7 days post treatment of primary monocytes from another donor ( Suppl. Fig. 1 ). In this second study, CD83 and CD86 marker proteins are detectable in ~85% of the treated, adherent cells and ~60% of the nonadherent cells, again showing consistent treatment effectiveness of cells from another donor. Likewise, as expected, iDC maintained in differentiation medium supplemented with GM-CSF and IL4 produces elevated interleukin-6 (IL6), interleukin-10 (IL10), interleukin-12 (IL12p40), and tumor necrosis factor-α (TNFα) protein levels following 24 h of LPS treatment ( Fig. 1B and Table 1 ). 16 In contrast, cytokine production in the absence of LPS is dramatically less for these cytokines compared to LPS-treated cells. Interferon-α (IFNα) production, a prominent DC maturation cytokine, 17 does increase between treatments, but it is not as dramatic as the other cytokines ( Fig. 1B and Table 1 ). When total RNA was isolated independently from iDCs or mDCs from two donors and analyzed using nCounter gene expression technology, the results from LPS-treated cells reveal increases in mDC cytokine and cell-surface antigen transcription relative to iDCs ( Fig. 1C and Suppl. Fig. 1B ). Notably, the percentage changes in mDC activation marker transcription relative to iDC range from 25 to 813% for all markers evaluated. Similar changes are also observed for cytokine transcription (range, 85 to 1580%) with the exception of TNFα. These transcriptional activity data are similar between donors, correlate with the increased protein production seen in LPS-treated cells, and show the effectiveness of GM-CSF, IL4, and LPS treatments reducing iDC markers expressing and increasing DC activation marker transcription. Most importantly, this treatment regimen reproducibly generates mDCs displaying the expected phenotypes from primary human CD14+ monocytes, and this workflow permits functional DC characterization as well as testing compounds for their abilities to modulate DC maturation. Lastly, to ensure assay consistency, each mDC batch should be phenotypically profiled as described here.
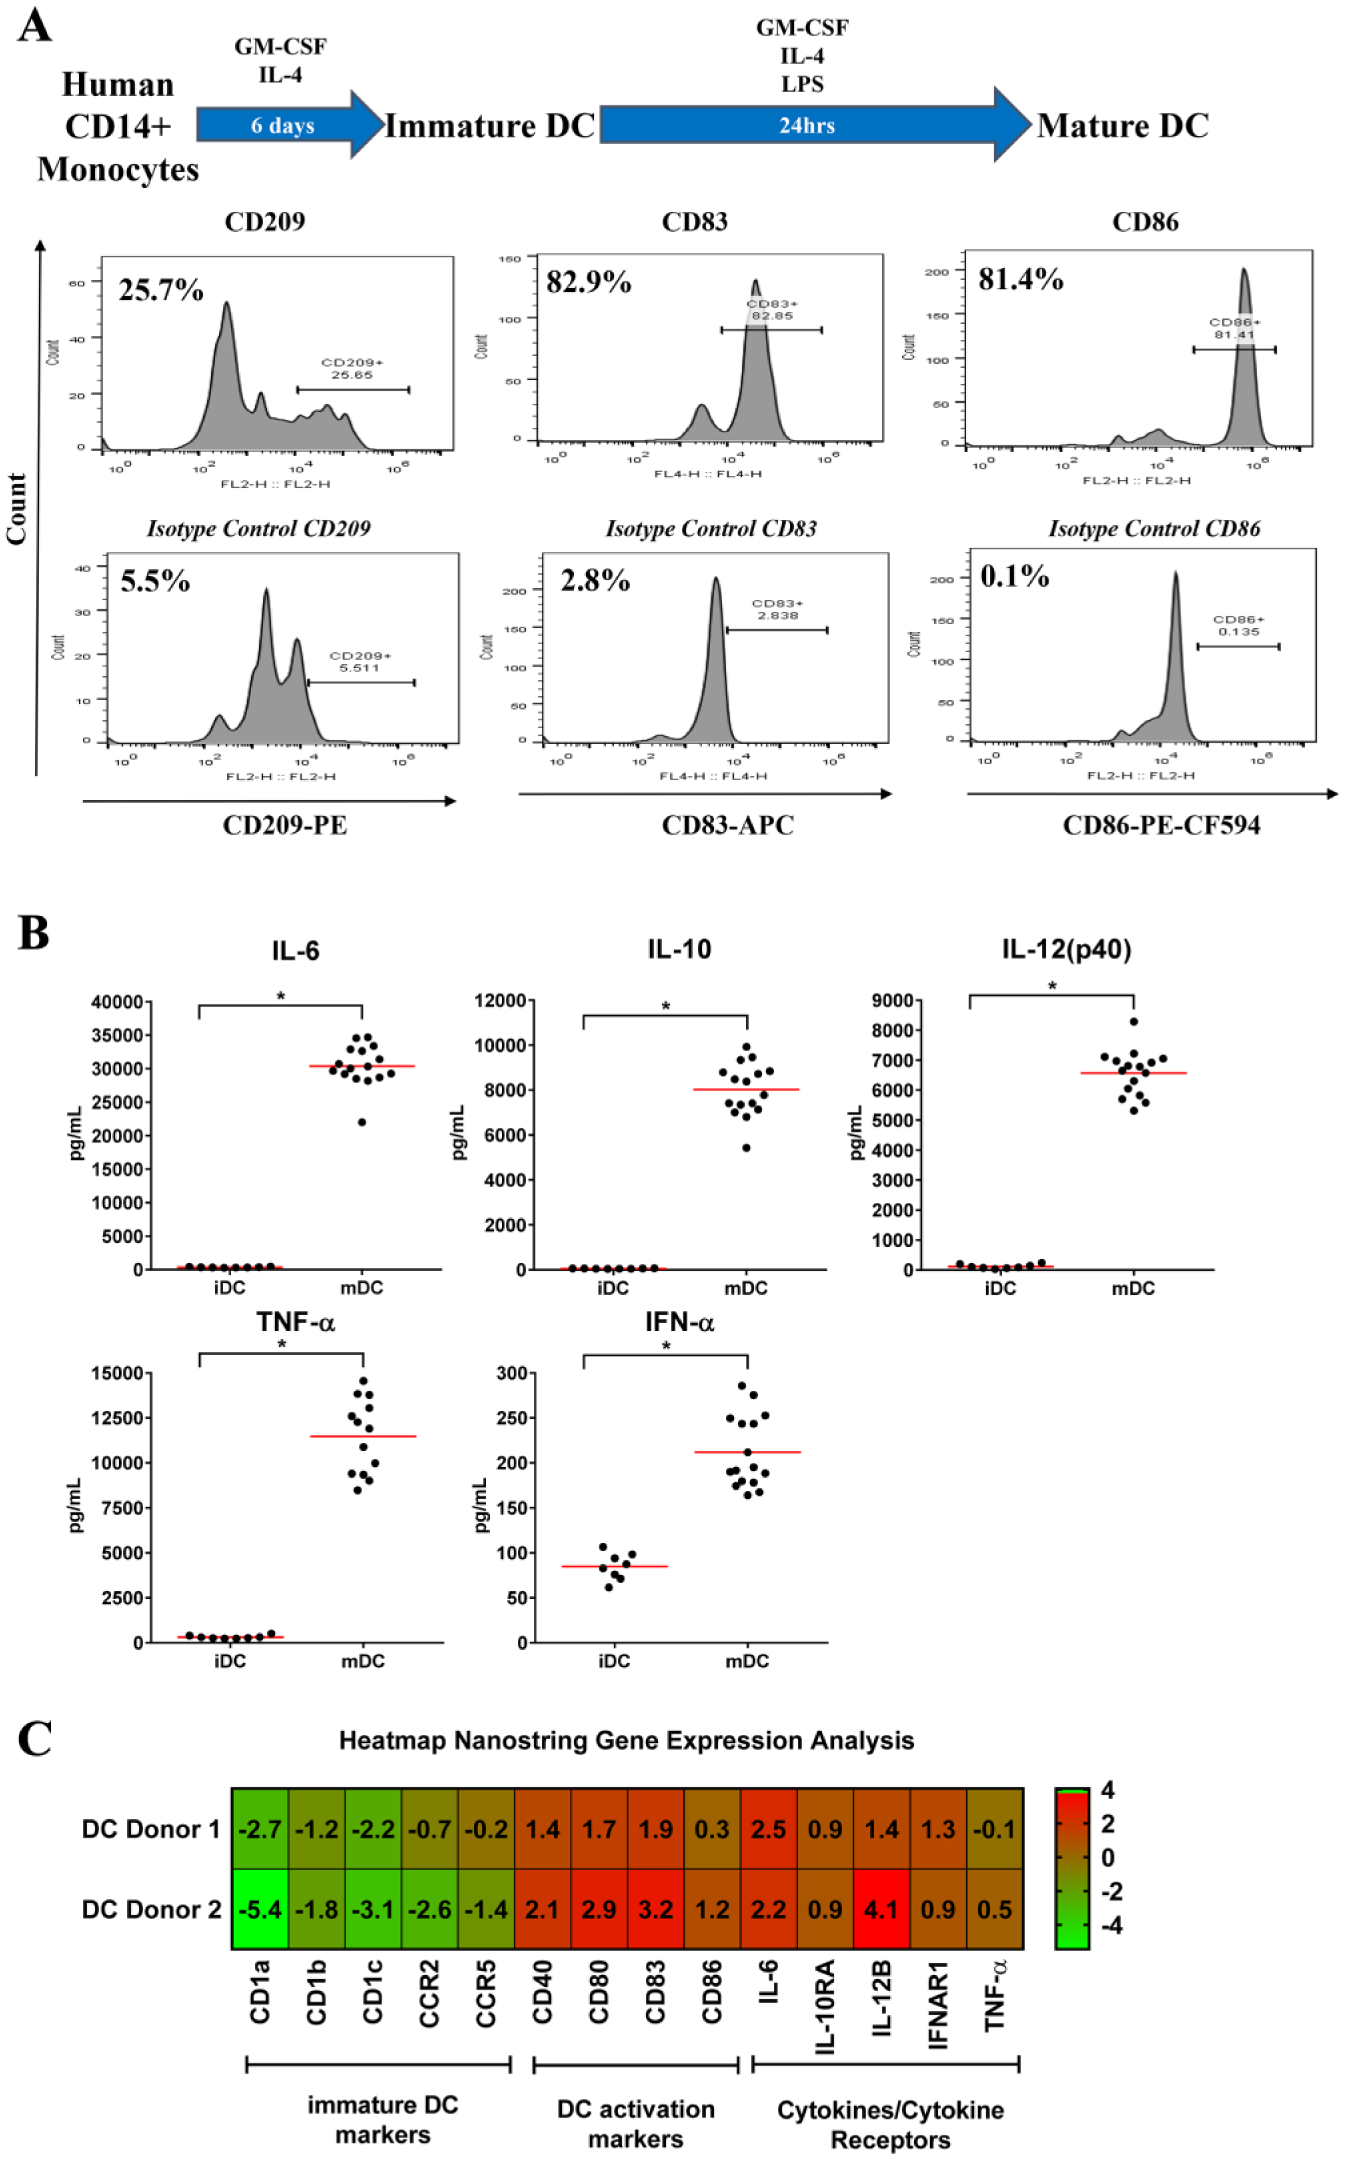
Human immature (iDC) and mature dendritic cell (mDC) surface antigen, cytokine production, and gene expression profiles following 7 day granulocyte-macrophage colony-stimulating factor (GM-CSF), interleukin-4 (IL4), and lipopolysaccharide (LPS) treatments. (
Human iDC and mDC cytokine production profiles as measured using AlphaLISA.
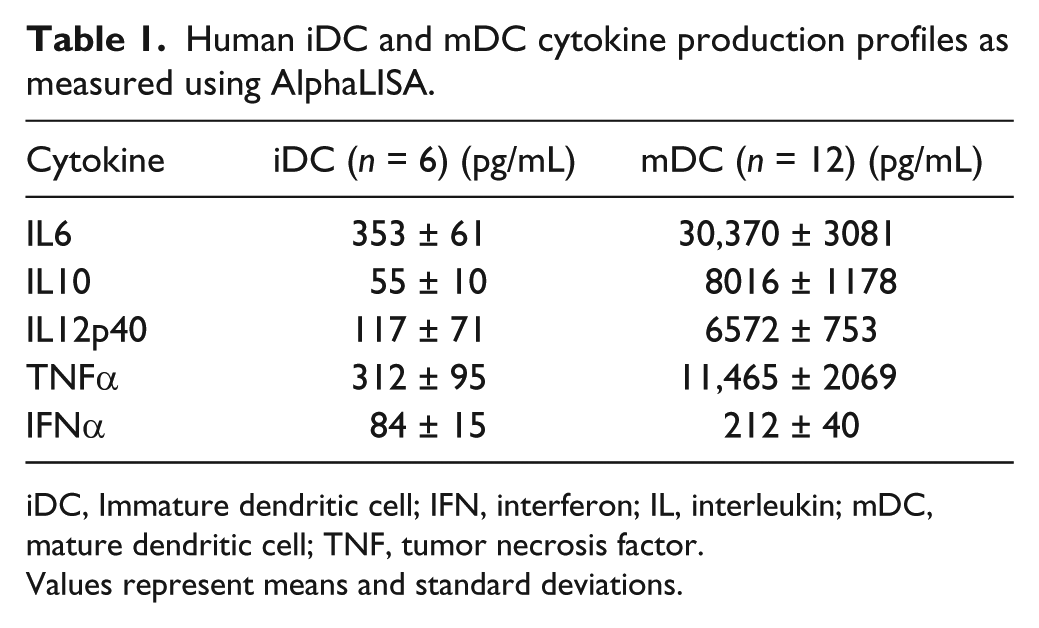
iDC, Immature dendritic cell; IFN, interferon; IL, interleukin; mDC, mature dendritic cell; TNF, tumor necrosis factor.
Values represent means and standard deviations.
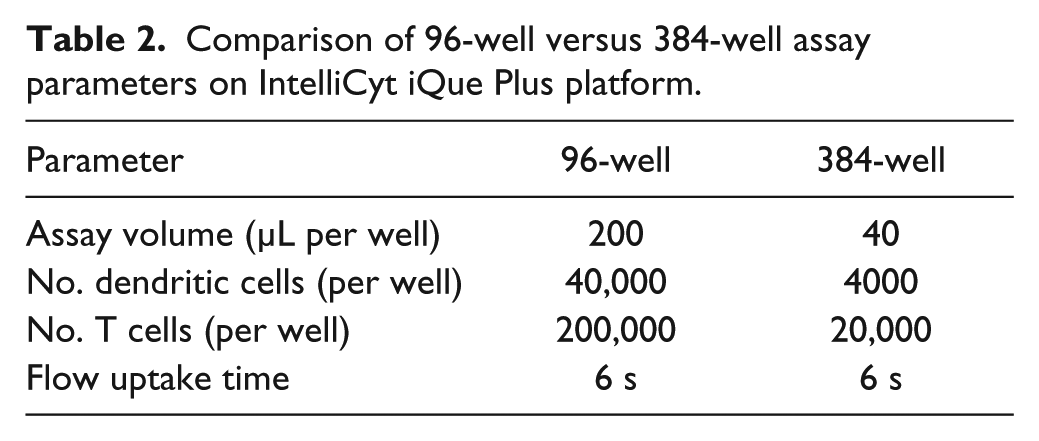
T-cell activation by DCs depends on DC surface costimulatory molecules, their ability to present antigens to lymphocytes, and the cytokines, chemokines, and growth factors they secrete.7,8,15 The DC maturation protocol used herein results in mDCs displaying the desired phenotypes, but it is still uncertain if these cells are capable of activating naïve T cells. Traditionally, MLR co-culture assays are run by using low-throughput flow cytometry methods or measuring 3H-thymidine incorporation. Taking into consideration that our mDCs possess traits resembling those reported for mature DCs ( Fig. 1 ), it seemed reasonable to modify a multiparameter, 384-well HTFC workstream 6 to support an MLR assay format in which DCs and T cells are co-cultured, followed by measuring cellular proliferation, surface antigen expression, and cytokine production in each well. Figure 2A and 2B outline the assay protocol and analysis strategies on the Intellicyt iQue Plus flow cytometry platform, respectively. In a first comparison study, we performed the MLR assay in 96- or 384-well formats and compared HTFC parameters (counts per well, percent proliferation by CTFR dilution, and IFNγ secretion by CBA; Fig. 2C and Table 2 ). Notably, both assay formats supported similar and vigorous T-cell activation in the mDC/T-cell co-cultures (ratio 1:10) over the monocultures, as indicated by proliferation (approximately fivefold increase; Fig. 2C ) and IFNγ production (>50-fold increase in secretion; Fig. 2C ). Largely, these mDC activity data in either assay show these cells are effective activators of T-cell proliferation and IFNγ secretion. Moreover, the measured event counts and total secreted IFNγ correlate to the total cell number in each well of the different-sized plates. These data support that the MLR assay format can be successfully miniaturized from 96- to 384-well format, which reduces the required number of primary cells 10-fold ( Table 2 ). Consequently, reducing the required cell number per well in addition to the overall assay volume represents significant savings in cost (primary cells and reagents) and increases screening throughput capabilities.
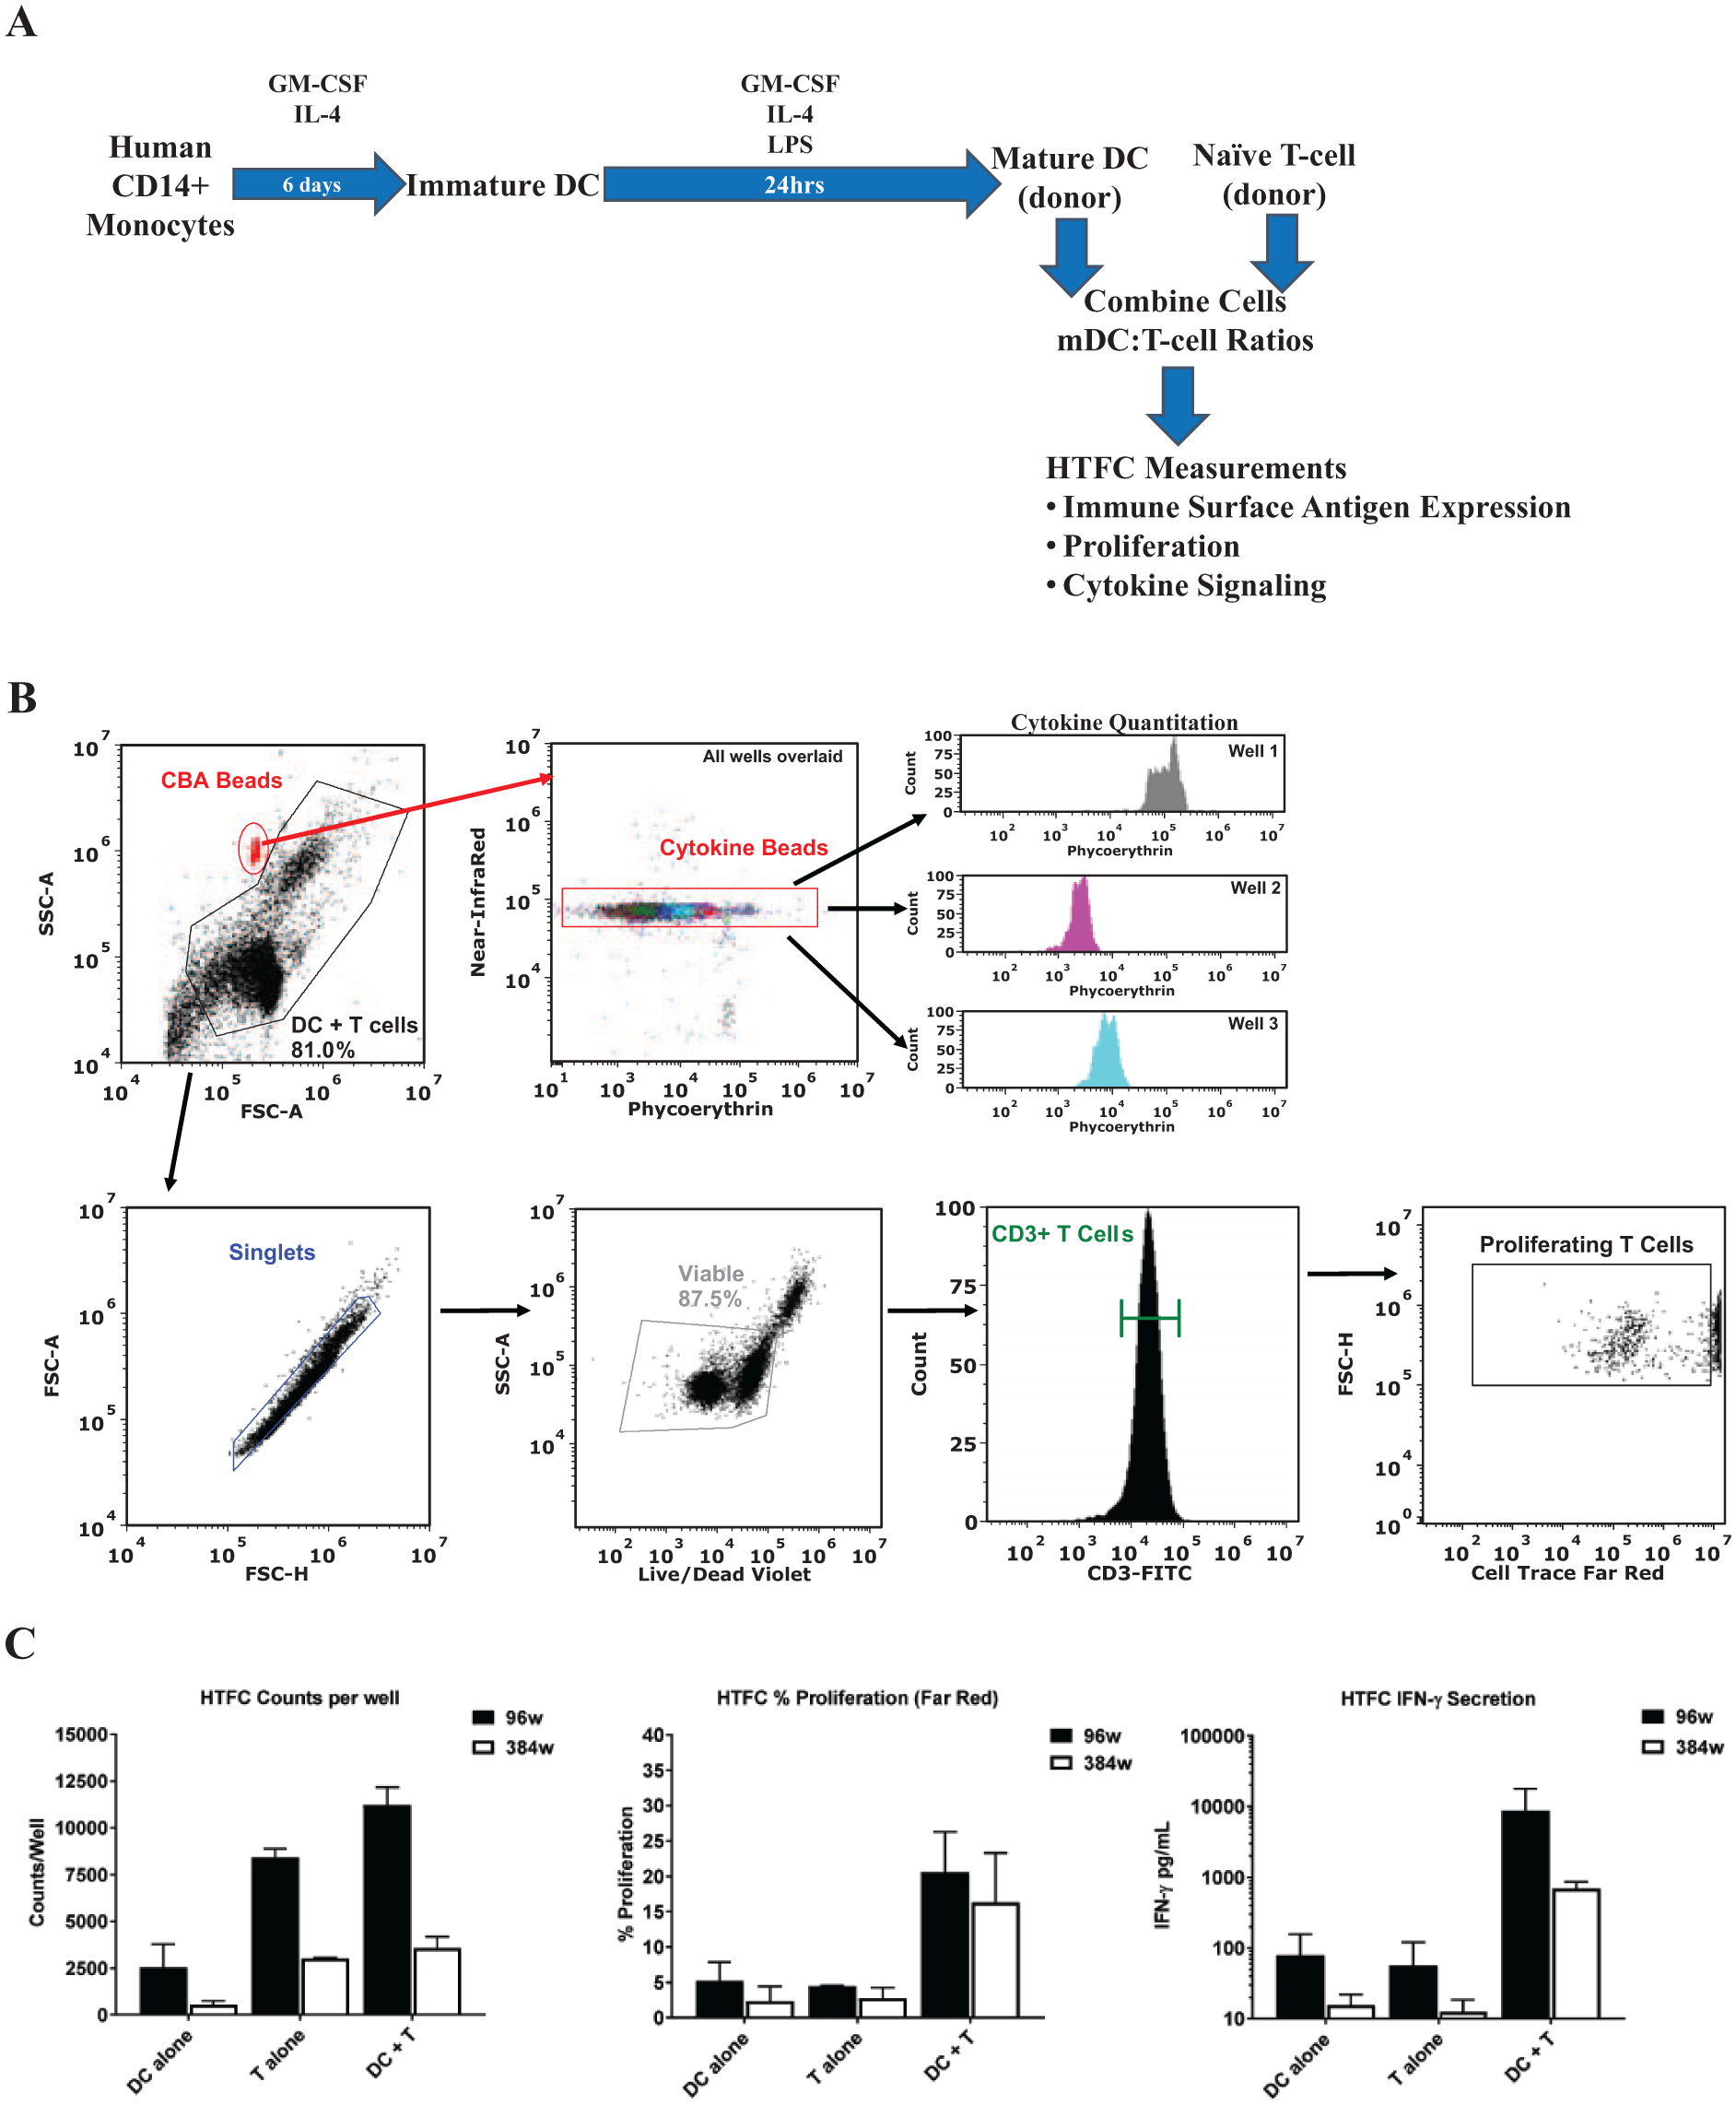
In vitro 96- or 384-well flow cytometry mixed lymphocyte reaction (MLR) assays showing dendritic cell (DC)-mediated T-cell proliferation and interferon-γ (IFNγ) production. Human DC maturation and MLR workstream (
Comparison of 96-well versus 384-well assay parameters on IntelliCyt iQue Plus platform.
The data presented in Figure 2 confirm that the mDCs are functionally active toward activating T cells and the in vitro assay conditions are suitable for developing a multiplex flow cytometry assay. Accordingly, the next study involved evaluating different ratios of mDCs to naïve T cells to identify a ratio capable of consistently causing DC-mediated T-cell activation. Here, CTFR-labeled T cells from two independent donors were individually co-cultured with mDCs from one donor at mDC/T-cell ratios of 1:1 and 1:10. After 4 days, T-cell proliferation increased three- to sixfold when mDCs were used to activate naïve T cells from either donor at 1:1 or 1:10 mDC/T-cell ratios, and IFNγ production (calculated by comparing MFI sample values to BD Biosciences’ CBA kit protein standard values) increased nine- to 27-fold accordingly ( Fig. 3A ). These data consolidate the abilities of this batch of mDCs to activate naïve T cells from multiple donors. The subsequent study addressed whether another mDC batch would behave in a similar manner. Thus, mDCs and naïve T cells (each from two independent donors) were separately co-cultured at an mDC/T-cell ratio of 1:5 prior to measuring IFNγ production. After 4 days, a six- to 10-fold increase in IFNγ is observed after mDCs from either donor were co-cultured together with T cells ( Fig. 3B ). Again, no notable differences in IFNγ production are seen in the monocultures ( Fig. 3B ). In all cases, mDCs from different donors are evaluated for their ability to activate T cells prior to using them in large-scale MLR assays to assure their potential to induce a 10-fold or greater increase in IFNγ secretion relative to cells in monoculture ( Suppl. Fig. 1C ). All together, these findings support the procedures used to generate mDCs capable of stimulating CD3+ T cells. Moreover, there appears to be a relationship between the mDC donor gene expression profiles and the levels of IFNγ secreted by the T cells ( Figs. 1C and 3B ). Specifically, the changes in mDC donor 2 surface marker, cytokine, and receptor transcription generally appear greater relative to donor 1 and seem to trend toward increased IFNγ production regardless of the T-cell donor. These observations underscore the importance of mDC phenotyping prior to large-scale testing. Finally, given our intent to develop a multiparameter flow cytometry assay, we wished to know if similar proliferation and cytokine production results are obtained in single-plex or multiplex assays. Thus, naïve CTFR-labeled T cells were mixed with mDCs at an mDC/T-cell ratio of 1:10 and maintained for 96 h. Subsequent analyses reveal comparable proliferation and IFNγ production values regardless of whether the samples are analyzed separately or concurrently in single wells ( Fig. 3C ). Approximately a fourfold increase in CD3+ T-cell proliferation is observed, and a 13- to 18-fold increase of IFNγ is detectable compared to T cells grown in monoculture. Together, these data verify the feasibility of sample multiparameter analyses contained in a single well, and collectively these outcomes corroborate the 384-well HTFC MLR assay, supporting its use for testing modalities for their ability to induce or abrogate immune responses.
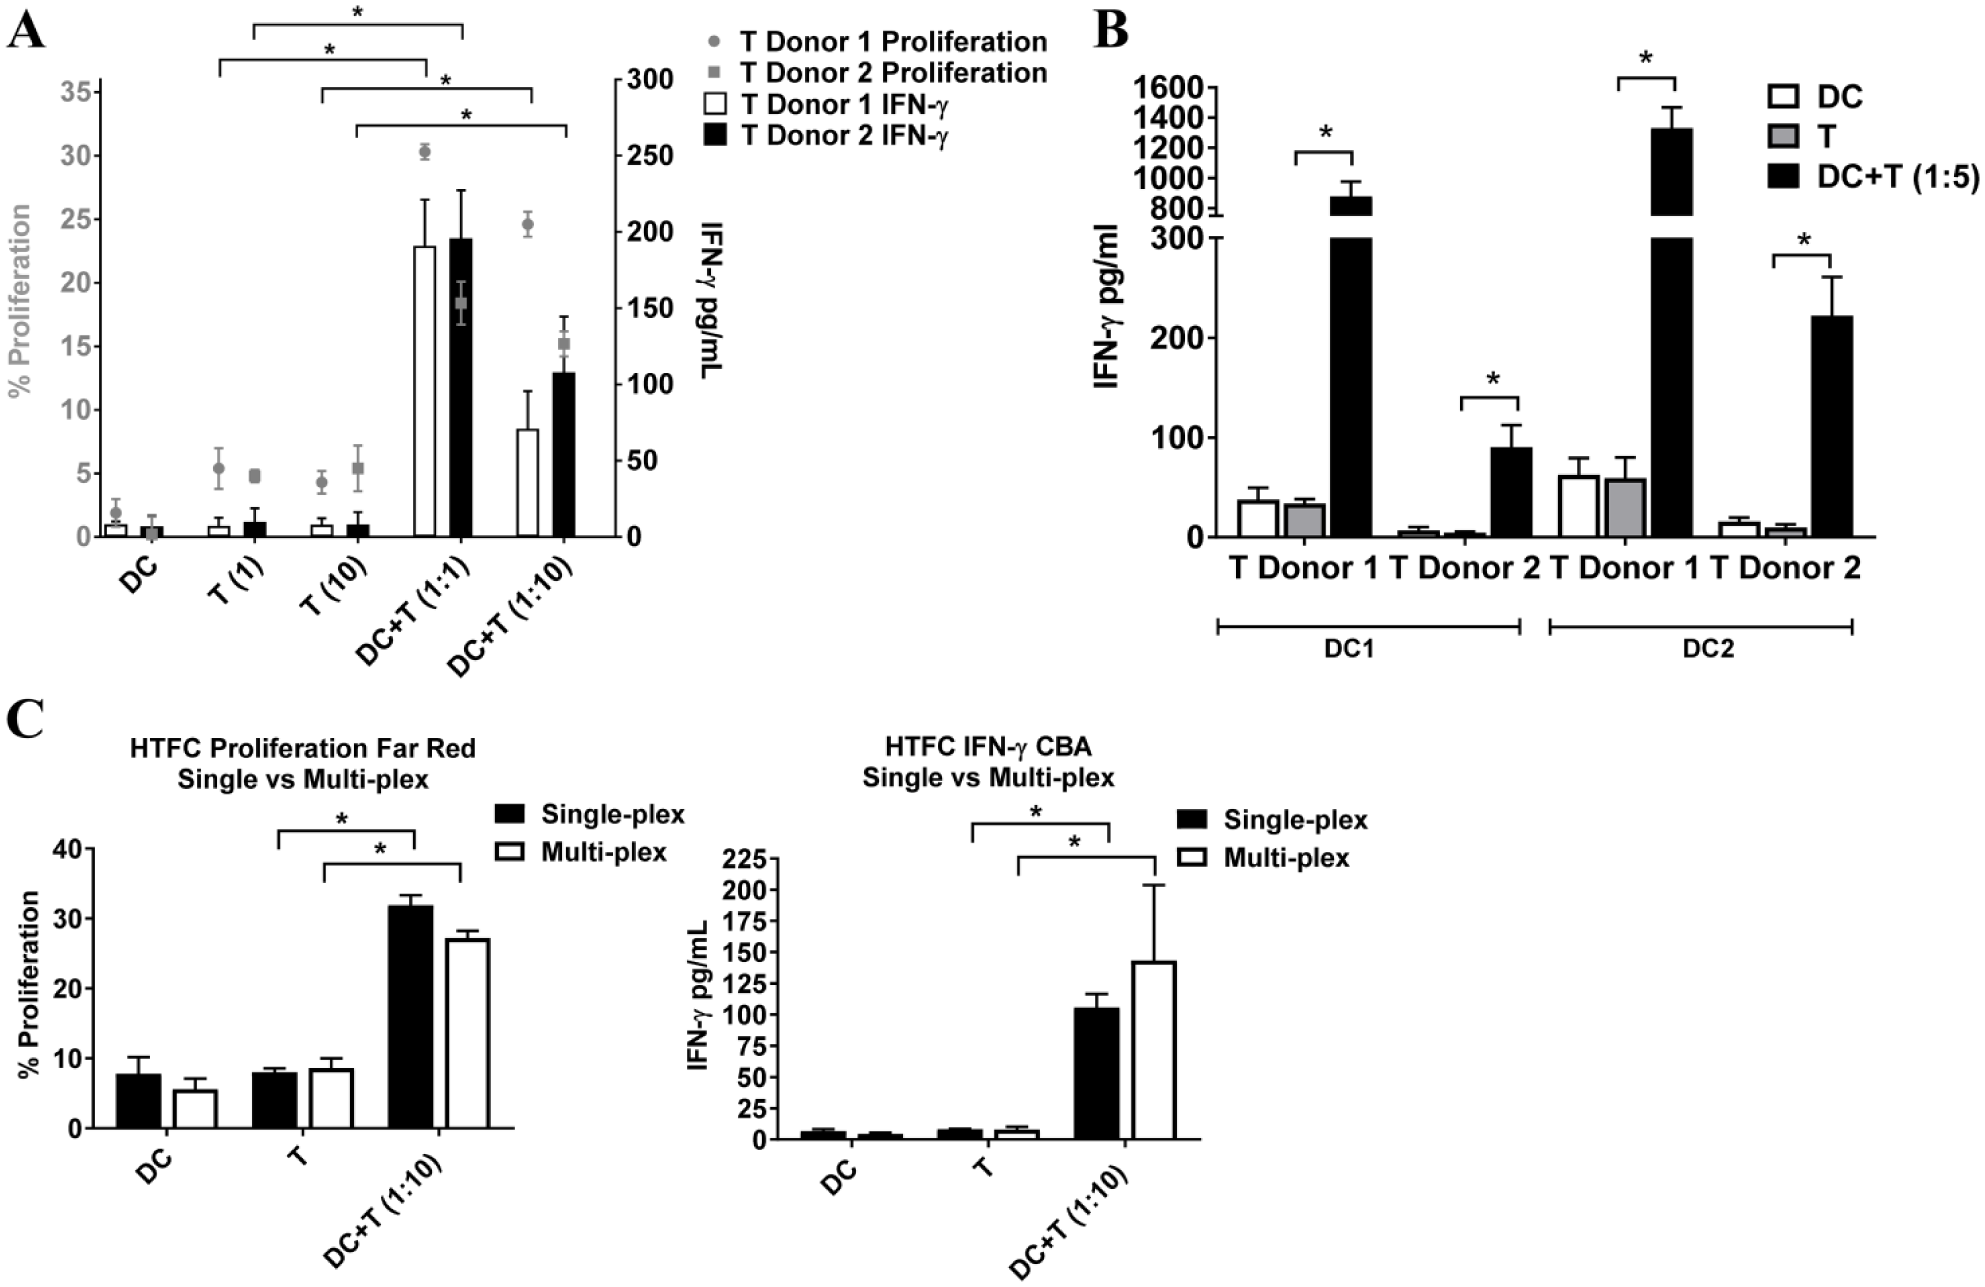
Human dendritic cell (DC)-mediated T-cell activation as measured in a high-throughput, 384-well, multiparameter flow cytometry mixed lymphocyte reaction (MLR) assay. (
In summary, the mixed lymphocyte reaction is part of an in vitro assay collection used to assess immune cell functionality and treatment effects of various modalities on these functions. Earlier, we reported the development of a 384-well, human whole blood HTFC assay capable of measuring treatment effects on cellular signaling pathways.
6
The robust assay described herein proved reliable and reproducible, which in many cases is not routinely seen with MLR assays given they are cumbersome and difficult to perform from a large-scale screening perspective. Our successes are due to (1) gathering donor cells from a consistent source, (2) establishing DC maturation workflows to regularly generate mDCs satisfying internal phenotypic criteria, and (3) modifying a HTFC assay to measure immune cell functionality. First, in all studies, frozen stocks of human CD14+ monocytes and naïve CD3+ T cells from healthy donors are purchased from a commercial vendor capable of storing large cell batches of frozen cells isolated from individual-donor leukopaks. This practice proved fruitful, especially if a donor with favorable traits is identified. Secondly, the data show that the GM-CSF, IL4, and LPS regimen repeatedly yields mDCs expressing the expected DC activation markers, CD83 and CD86 (
Supplemental Material
Supplemental_Info_for_HTFC-MLR-Assay_by_Fan_et_al – Supplemental material for Miniaturized High-Throughput Multiparameter Flow Cytometry Assays Measuring In Vitro Human Dendritic Cell Maturation and T-Cell Activation in Mixed Lymphocyte Reactions
Supplemental material, Supplemental_Info_for_HTFC-MLR-Assay_by_Fan_et_al for Miniaturized High-Throughput Multiparameter Flow Cytometry Assays Measuring In Vitro Human Dendritic Cell Maturation and T-Cell Activation in Mixed Lymphocyte Reactions by Yi Fan, Joseph G. Naglich, Jennifer D. Koenitzer, Humberto Ribeiro, Jonathan Lippy, Jordan Blum, Xin Li, Christina Milburn, Bryan Barnhart, Litao Zhang and Mark P. Fereshteh in SLAS Discovery
Footnotes
Supplemental material is available online with this article.
Declaration of Conflicting Interests
The authors declare no potential conflicts of interest with respect to the research, authorship, and/or publication of this article.
Funding
The authors received no financial support for the research, authorship, and/or publication of this article.
References
Supplementary Material
Please find the following supplemental material available below.
For Open Access articles published under a Creative Commons License, all supplemental material carries the same license as the article it is associated with.
For non-Open Access articles published, all supplemental material carries a non-exclusive license, and permission requests for re-use of supplemental material or any part of supplemental material shall be sent directly to the copyright owner as specified in the copyright notice associated with the article.