
Abstract
High-throughput flow cytometry is an attractive platform for the analysis of adoptive cellular therapies such as chimeric antigen receptor T cell therapy (CAR-T) because it allows for the concurrent measurement of T cell–dependent cellular cytotoxicity (TDCC) and the functional characterization of engineered T cells with respect to percentage of CAR transduction, T cell phenotype, and measurement of T cell function such as activation in a single assay. The use of adherent tumor cell lines can be challenging in these flow-based assays. Here, we present the development of a high-throughput flow-based assay to measure TDCC for a CAR-T construct co-cultured with multiple adherent tumor cell lines. We describe optimal assay conditions (such as adherent cell dissociation techniques to minimize impact on cell viability) that result in robust cytotoxicity assays. In addition, we report on the concurrent use of T cell transduction and activation antibody panels (CD25) that provide further dissection of engineered T cell function. In conclusion, we present the development of a high-throughput flow cytometry method allowing for in vitro interrogation of solid tumor, targeting CAR-T cell–mediated cytotoxicity, CAR transduction, and engineered T cell characterization in a single assay.
Introduction
CAR-T Cell Therapy
The genetic engineering of patient T cells with chimeric antigen receptors (CARs) has demonstrated remarkable efficacy for B cell malignancies, representing a transformative therapeutic approach in oncology with the approval of two cell therapies targeting CD19 malignances in 2017. 1 These second-generation CD19 CAR constructs are hybrid antibodies and T cell receptors (TCRs) comprising extracellular single-chain variable fragments (scFvs) recognizing CD19, hinge and transmembrane regions, as well as intracellular T cell co-stimulatory and TCR signaling domains. 2 Once engineered to express CARs, T cells will recognize tumor antigens in a major histocompatibility complex (MHC)-independent manner and are designed to replicate some of the natural events of a T cell following activation. These include release of cytolytic granules resulting in cytolysis of antigen-positive cells, tumor necrosis factor (TNF) family member–mediated apoptosis, as well as the release of pro-inflammatory cytokines.3,4
Current efforts in the cell therapy field include approaches to tackle other hematological and solid tumor malignancies outside of B cell malignancies. These approaches may require further engineering strategies to increase T cell trafficking to tumors, persistence, specificity, and susceptibility to immune-suppressive tumor microenvironments.5,6 As the adoptive cell therapy field expands, there will be a need for high-throughput assays that allow for the selection of efficacious CAR-T against a variety of cell types, including adherent and more fragile cell types, as well as assays that can characterize the function of CAR-T with respect to gene transduction efficiency, T cell function, and specificity.
Cytotoxicity Assays
The gold standard for the past 50 years to measure antigen-specific T-cell-meditated killing of tumor cells has been the use of 51Cr release assays. 7 In these assays, target cells are preloaded with 51Cr, and cell death is measured by the release of radioisotope in the supernatant. This technique confers many advantages, including sensitivity; however, these assays contain hazards associated with the handling and disposal of radioisotopes. In addition, due to the inherent cytotoxicity of 51Cr, these assays are not amenable to all target cells or to assay durations greater than 24 h.
To circumvent some of the limitations of the 51Cr release assays, additional biochemical cell-based assays have been developed to measure tumor cell viability when co-cultured with T cells. These cell-based assays include colorimetric-based approaches such as MTT and lactate dehydrogenase (LDH) assays,8,9 fluorescent-based assays using Calcein AM, 10 luminescent-based assays measuring adenosine triphosphate (ATP) readouts with reagents like CellTiter-Glo (Promega, Madison, WI), and homogeneous assays using cell lines engineered to express firefly luciferase. 11 Although these techniques offer some suitable alternatives for measuring T cell–dependent cellular cytotoxicity (TDCC), readouts can be confounded by T cells (e.g., low T cell viability) in these co-culture assays, and it is not possible to simultaneously characterize T cell function in these assays at the level of single-cell resolution.
During the past 10 years, the development of multiparameter flow cytometry methods has expanded, allowing for the measurement of immune-mediated cell killing of tumor cells.12,13 Flow cytometry allows for the quantification and characterization of both immune effector and tumor cells at the single-cell level. Using different labeling approaches (e.g., CellTrace Violet and CFSE), users can distinguish effector and target cells through labeling with dyes, distinguish live and dead cells using cell viability markers, and characterize the function of the immune cells with multiparameter flow cytometry. Assessing multiple parameters beyond cytotoxicity—such as engineered T cell activation, degranulation, and exhaustion, and percentage of CAR-positive cells—can broaden the scope of the preclinical evaluation of CAR-T constructs. The rise of newer high-throughput instruments such as the Intellicyt iQue (Intellicyt, Albuquerque, NM) instrument allows for rapid sample acquisition, data analysis, and ease of use. 14
Solid tumor cells, due to their adherent nature, can be difficult to analyze on a flow cytometer, which requires the preparation of cells into a single cell suspension prior to analysis. Although additional technologies have proved useful for analysis of CAR-T against solid tumor cell lines, such as label-free impedance assays 5 and imaging assays, 15 these methods still would require subsequent analysis by flow cytometry to evaluate the CAR-T phenotype, and activation and transduction of CARs. 16 Here, we present a high-throughput multiparameter assay to characterize CAR-T cell function as well as cytotoxicity against solid tumor cell lines in a single assay, evaluating key parameters for the optimal analysis of CAR-T co-cultured with adherent tumor cell lines.
Materials and Methods
Generation of CAR-T Cells
Second-generation CARs were constructed against prostate-specific membrane antigen (PSMA CAR), CD19 (CD19 CAR), glypican-3 (GPC3), and prostate stem cell antigen (PSCA). Each CAR was composed of an extracellular antigen-binding domain derived from the scFv in a variable light chain-variable heavy chain (VL-VH) orientation, using CD8a for hinge and transmembrane regions, the 4-IBB costimulatory domain, and the CD3z signaling domain. The anti-PSMA scFv sequence was obtained from humanized J591 scFv; 17 the anti-CD19 scFv sequence from the murine FMC63 scFv; 18 the anti-GPC-3 scFv sequence from fully human GC33, or codrituzumab; 19 and the anti-PSCA scFv sequence from human 1G8. 20
CAR constructs were transfected into the HEK-293T cell line using the pCMVdR8.91 and pMD2.G packaging plasmids and FuGeneHD (Roche, Basel, Switzerland) for lentiviral production. Culture supernatants were collected at 48 h, filtered (0.22 µm), and stored at −80 °C.
Tumor Cell Lines
Three human prostate cancer cell lines, DU145, 22RV1, and PC3 (HTB-8, CRL-2505, and CRL1-435, respectively), were obtained from the American Type Culture Collection (ATCC). Cells were cultured at 37 °C, 5% CO2, in either Eagle’s minimal essential medium (EMEM) with L-glutamine (DU145) or Roswell Park Memorial Institute (RPMI; 22RV1) or F12 (PC3) medium, supplemented with 1% penicillin/streptomycin and 10% fetal bovine serum (FBS; Thermo Fisher, Waltham, MA). Twice a week, cells were split to either 4.5 million (DU145) or 9 million (22RV1) cells in a treated culture flask with a 175 cm2 surface area (Greiner Bio-One, Monroe, NC). The GPC3-negative liver adenocarcinoma cell line SK-HEP-1 and the GPC3-positive hepatocellular carcinoma cell line Huh7 were obtained from ATCC (HTB-52) and the JCRB Cell Bank (JCRB0403), respectively; cultured in Dulbecco’s modified Eagle’s medium (DMEM) supplemented with 1% penicillin/streptomycin and 10% FBS; and split every 3–4 days at 3 million cells per treated culture flask (175 cm2 surface area). The PSCA-positive pancreatic cancer cell line PL45 was obtained from ATCC (CRL-2558), cultured in DMEM supplemented with 1% penicillin/streptomycin and 10% FBS, and split every 3–4 days at 4.5 million cells per treated culture flask (175 cm2 surface area). Cell viability was monitored via automated cell counter (Bio-Rad, Hercules, CA). Target cell surface expression of PSMA was quantified using an anti-PSMA antibody (Clone LNI-17; BioLegend, San Diego, CA) and PE Quantibrite beads (BD Biosciences, San Jose, CA) on the LSR Fortessa (BD Biosciences), according to the manufacturers’ instructions.
Isolation of Peripheral Blood T Cells
Leukopaks containing peripheral blood mononuclear cells (PBMCs) from nonsmoking, nonmedicated, human donors were received from Stemcell Technologies (Vancouver, BC). Pan-T cells were isolated from the PBMCs by negative selection via immunomagnetic beads (Stemcell Technologies). T cells were then characterized by automated cell counter (BioRad) for viability, and by flow cytometer for expression of CD45 (Clone HI30; BioLegend), CD56 (Clone HCD56; BioLegend), CD3 (Clone UCHT1; BD Biosciences), CD4 (Clone SK3; BioLegend), and CD8 (Clone RPAT8; BioLegend). Aliquots of 20 million T cells in 1 ml freezing media (DMSO with 10% FBS) were frozen in liquid nitrogen until subsequent use in assays.
CAR-T Cell Transduction and Cell Culture
CAR-T cells were generated from frozen human Pan CD3+ T cells that were isolated as described above. T cells were activated ex vivo using anti-CD3/CD28 beads (Thermo Fisher) and 100 IU/ml exogenous interleukin-2 (IL2) (Miltenyi; Bergisch Gladbach, Germany), and were transduced with a lentiviral vector. Transductions were performed one day after anti-CD3/CD28 bead activation as follows: 1×10⁶ cells were plated in 24-well plates (VWR, Radnor, PA) with 125 µl of viral supernatant and 1.875 ml of T cell media [RPMI (Thermo Fisher) supplemented with 5% human AB Serum (Valley Biomedical, Winchester, VA), 2 mM glutamine (Thermo Fisher), 10% penicillin/streptomycin (Thermo Fisher), and 100 IU/ml IL2] with 8 µg/ml polybrene (MilliporeSigma, Billerica, MA). Plates were centrifuged at 1000× g for 90 min at room temperature and then incubated at 37 °C. Supernatant was discarded after 24 h and replaced with T cell media. T cells were de-beaded 4 days after transduction and evaluated in cytotoxicity assays between days 12 and 14 following transduction.
Target Cell Quantification Assays
DU145 or 22RV1 prostate cells were cultured in 96-well V-bottom plates (no. 3894; Corning, Corning, NY), at 50,000 cells per well, in 200 µl of cell culture media. Plates were cultured at 37 °C, 5% CO2, for either 48 or 72 h. All wells were then stained with a near-infrared Live/Dead stain (Thermo Fisher). Cells were washed in phosphate-buffered saline, then dissociated from the plate using 25 µl per well of StemPro Accutase (Thermo Fisher), TrypLE (Thermo Fisher), 0.5 M EDTA (Invitrogen, Waltham, MA), or Gibco Cell Dissociation Buffer (Thermo Fisher). Cells were then left in Accutase for 5, 10, 15, or 20 min, and shaken for the final 0, 2, or 5 min at 1400 rpm on the iQue instrument. The cell dissociation reagent was then quenched with 25 µl of Qsol (Intellicyt) per well. Plates were shaken at 2200 rpm for 10–15 s prior to the run to resuspend cells. Lastly, samples were acquired on the iQue Screener PLUS (Intellicyt) with the Violet-Red-Blue laser configuration using ForeCyt (version 5.4.6180) with a 10 s sip time (approximately 18 µL). Counts of the live target cells in each well were obtained by negatively gating out dead cells and debris with the near-infrared Live/Dead stain.
Cytotoxicity Assays
For T cell–dependent cytotoxicity assays, T cells were co-cultured with target cell lines at an effector-to-target ratio (E:T) of 3:1 in 96-well V-bottom plates. Assays included PSMA antigen-positive (22RV1) and -negative (DU145) prostate cell lines, GPC3-positive (Huh7) and -negative (SK-HEP-1) cell lines, PSCA-positive (PL45) and -negative (PC3) cell lines, and a target-irrelevant CAR-T cell line (CD19 CAR) to evaluate levels of nonspecific lysis ( Fig. 1A ). Target cells were stained with Cell Trace Violet (Thermo Fisher) prior to co-culture according to the manufacturer’s instructions. Cells were co-cultured in IL2-free media for 48 h at 37 °C. At the end of co-culture, cells were washed once. Each wash consisted of a 5 min spin at 500 g, removal of liquid by forceful flicking and resuspension of cells in 200 µL of PBS, followed by another 5 min spin at 500 g and removal of liquid. After washing, cells were resuspended in PBS and stained with near-infrared Live/Dead (Thermo Fisher), CD3-BV785 (Clone OKT3; BioLegend), CD25-FITC (Clone M-A251; BioLegend), and Myc-APC (Clone 9B11; Cell Signaling, Danvers, MA) ( Fig. 1B ). Example gating can be found in Supplementary Figure 1 . Cells were washed twice following staining and dissociated with 25 µl Accutase for 10 min at room temperature, shaking at 1400 rpm for the final 2 min. An equal volume of QSol quenching buffer (Intellicyt) was added to wells, and cells were mixed gently before running on an iQue Screener PLUS (Intellicyt) with a 20 s sip time (approximately 36 µl). Plates were shaken at 1400 rpm for 10 or 15 s prior to the run, with 2 s shakes at the same speed for every three wells during the assay. T cells from two independent donors were used for cytotoxicity assays.
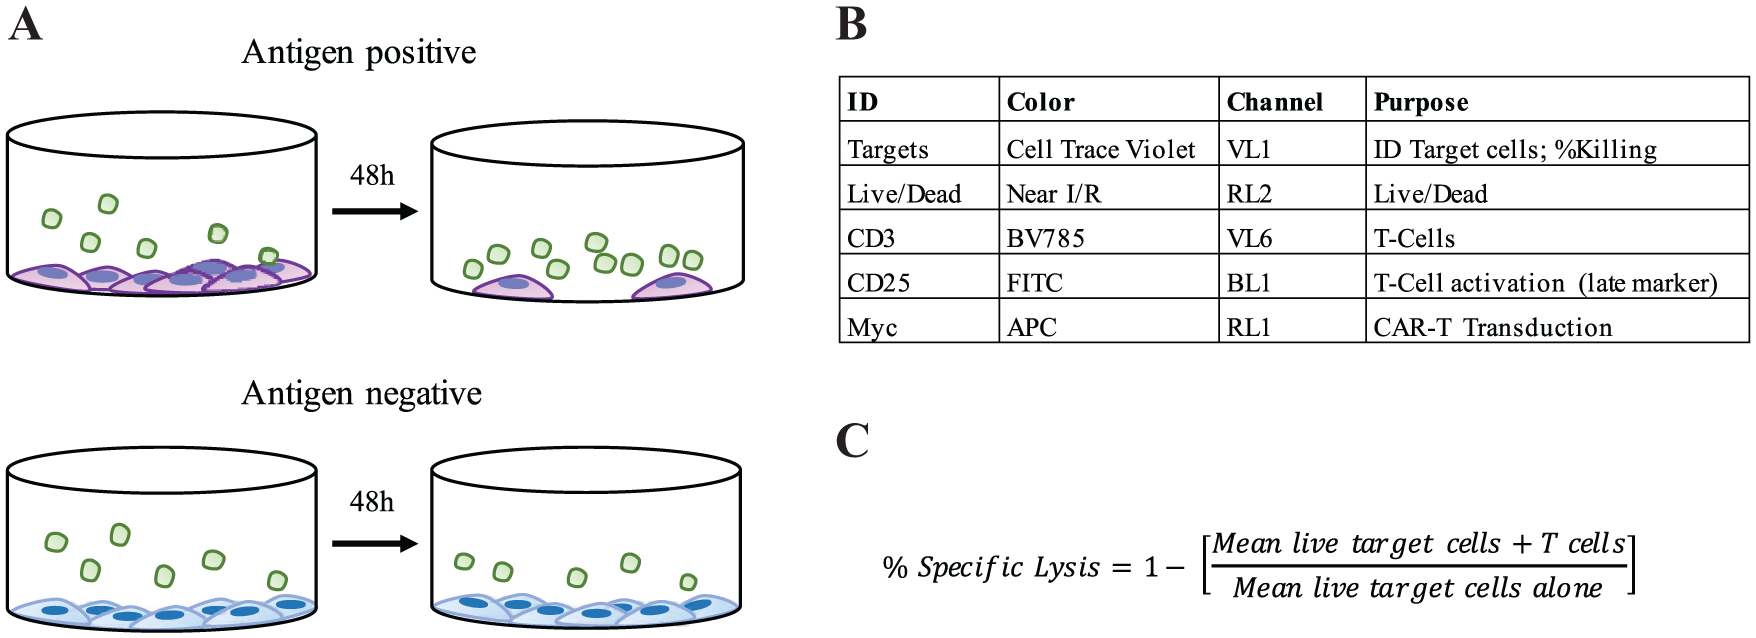
Assay schematic and flow panel. (
Specific Lysis Calculation and Data Analysis
Following acquisition, well identification for all assays was performed using ForeCyt Software (FCS, version 5.4.6180; Intellicyt), and FCS files were exported to FlowJo software (version 10.4; Tree Star, Ashland, OR) for further analysis. For cytotoxicity experiments, we calculated the percentage (%) of specific lysis from the relative loss of target cells in wells co-cultured with T cells according to this formula:
Data and statistical analyses were performed in GraphPad Prism (version 7.0c; GraphPad, San Diego, CA), and all results are reported as the mean plus one standard deviation.
Results and Discussion
Optimization of Adherent Cell Lines’ Conditions
Essential to the use of high-throughput flow cytometry (HTFC) to measure CAR-T-mediated cytotoxicity is the accurate counting of tumor target cell numbers throughout a plate. The calculation of specific lysis relies on the measurement of target cell numbers when co-cultured with CAR-T relative to target cells alone ( Fig. 1C ) and thus requires optimal preparation of adherent cell lines for analysis on the flow cytometer during the course of a 96-well assay. These cytotoxicity calculations are based on the loss of target cell populations and do not distinguish between cytolysis and cytostasis. It would be possible to distinguish these two mechanisms with a longer assay monitoring the proliferation of target cell populations labeled with Cell Trace Violet.
Our first step in the development of a HTFC cytotoxicity assay was the evaluation of four “gentle” cell dissociation buffers (Accutase, TrypLE, 0.5 M EDTA, and Cell Dissociation Buffer) for analysis of the 22RV1 and DU145 prostate cell lines. These four buffers are considered to be less harsh than other enzymatic reagents such as trypsin to maintain high cell viability and epitope preservation. Accutase dissociation buffer gave higher cell counts than any other buffer, accounting for both cell viability and cell release, for the 22RV1 and DU145 cell lines throughout a 96-well plate following a 48 h incubation ( Fig. 2A ). We selected Accutase as the dissociation buffer in subsequent experiments.
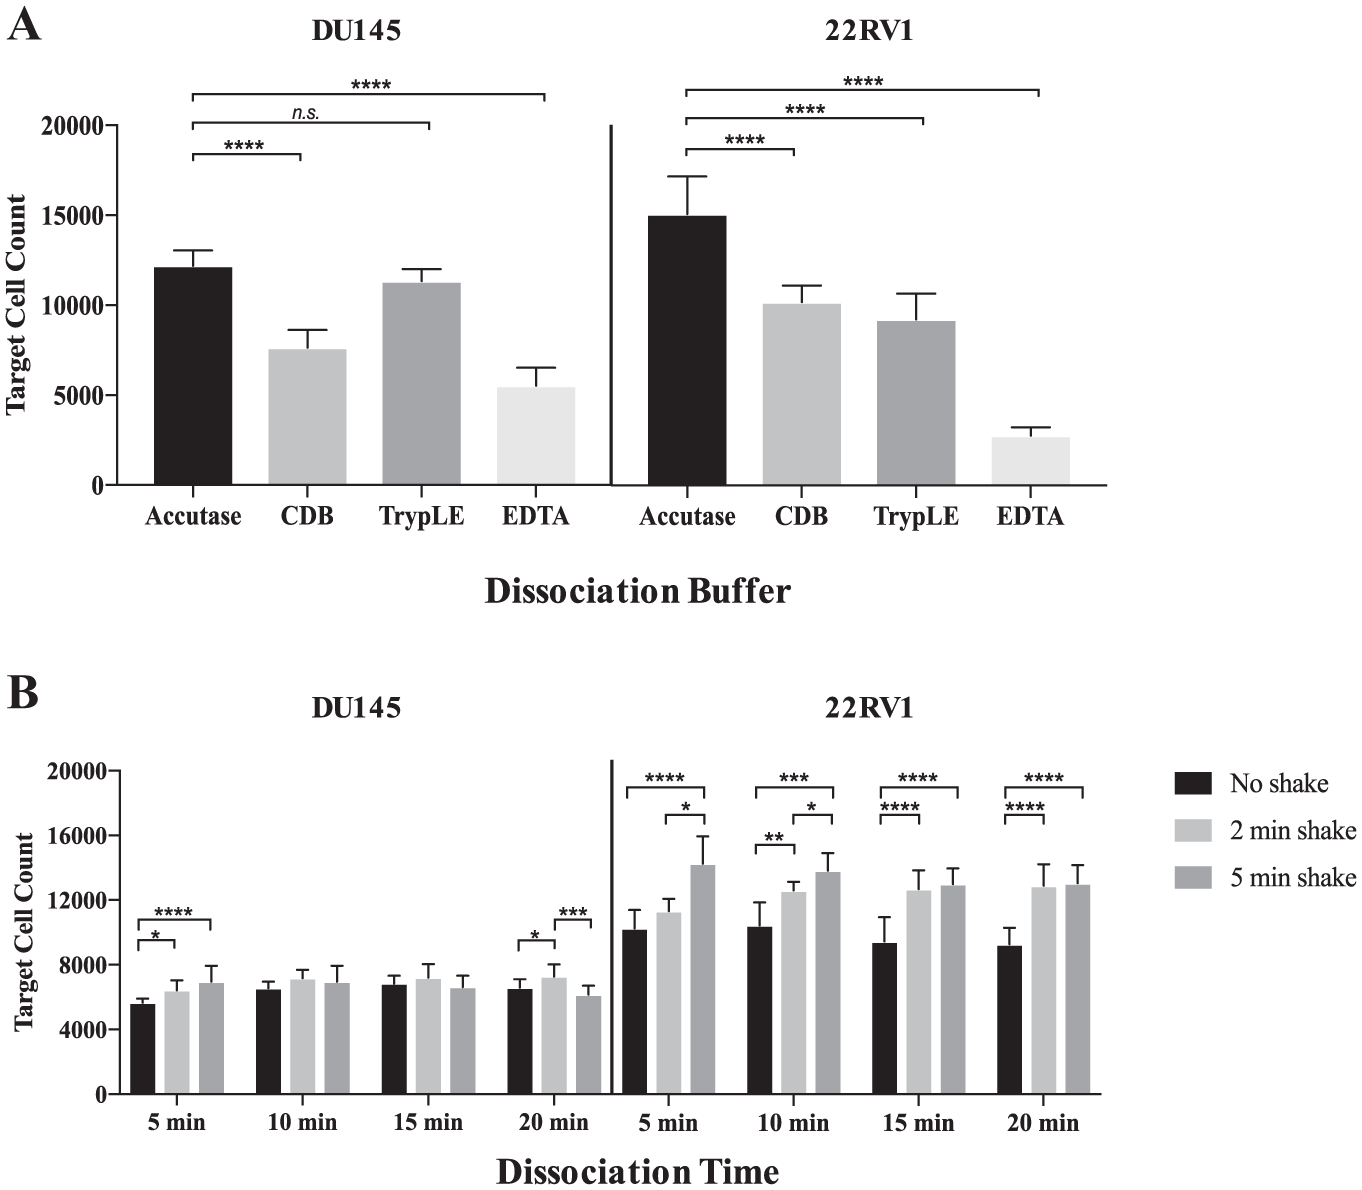
Optimization of adherent tumor cell dissociation. (
We next evaluated optimal cell dissociation buffer incubation time and shaking duration for the adherent cell lines evaluated. With respect to incubation times in Accutase, there were no significant differences in target cell counts during incubation periods of 10 min or more for any shake parameter, except for a minor decrease in DU145 counts for incubations between 10 and 20 min with a 5 min shake ( Fig. 2B ). We did, however, observe the trend that shaking (for either 2 or 5 min) at the end of the dissociation incubation resulted in higher target cell counts for both cell lines at the 5 min dissociation times and for all incubation times for 22RV1 cells ( Fig. 2B ). We selected an incubation time of 10 min with a 2 min shake period for the assay because, overall, these conditions gave high target cell counts with the shortest time duration to minimize assay length.
These experiments highlight that optimal cell dissociation duration and shaking may be cell line independent and should be taken into consideration when multiple cell lines are analyzed on a single 96-well plate with the same protocol. We did observe different absolute target cell counts between the two cell lines evaluated in this experiment. This may reflect different adhesion and density properties. Because cytotoxicity calculations are performed separately for each cell line, based on a respective target-only control, these differences in absolute target cell counts between the two tumor cell lines do not affect overall results.
Following the optimization of dissociation methods, we next evaluated shaking methods throughout a 96-well plate during sample acquisition on the flow cytometer to minimize intraplate variability. For each cell line, four 96-well plates were set up with equal cell numbers throughout the plate and incubated for 48 h. Following cell dissociation, target cell counts were measured throughout each plate (in rows) following instrument shaking for 2 s at 1400 rpm every 1, 3, 6, or 12 wells during sample acquisition. With less frequent shaking (every 6 to 12 wells), we observed a general trend of decreasing target cell counts in subsequent columns following shaking ( Fig. 3 ). With more frequent shaking, such as shaking every three wells, we observed more consistent target cell counts among columns in the plate ( Fig. 3 ). Also, when shaking every well for the 22RV1 cell line, we measured an increase in 22RV1 target counts throughout the plate, which may be the result of increased cells in suspension that are then acquired by the instrument. Overall, we found that shaking every three wells resulted in consistent target cell counts among the plates. This type of evaluation is key for a high-throughput cytotoxicity assay, which relies on the measurement of T-cell-mediated cytotoxicity relative to target count control wells. Inconsistent counts throughout the plate could bias the assay results, depending on the placement of samples and controls. For example, if we had run an assay shaking every 12 wells and placed our target only and irrelevant CAR controls in columns 1 and 2 and other constructs in subsequent columns, we may have erroneously calculated significant cytotoxicity because we measured decreased target cell counts in later columns, which would only be an artifact of the assay and shaking conditions and not be true biological results measuring T-cell-mediated cytotoxicity. Evaluations of target cell counts throughout a plate are essential for HTFC and also are useful parameters to monitor on a per cell line basis. A decrease in cell viability during sample acquisition throughout a 96-well plate may take place for sensitive cell lines and require further method optimization.
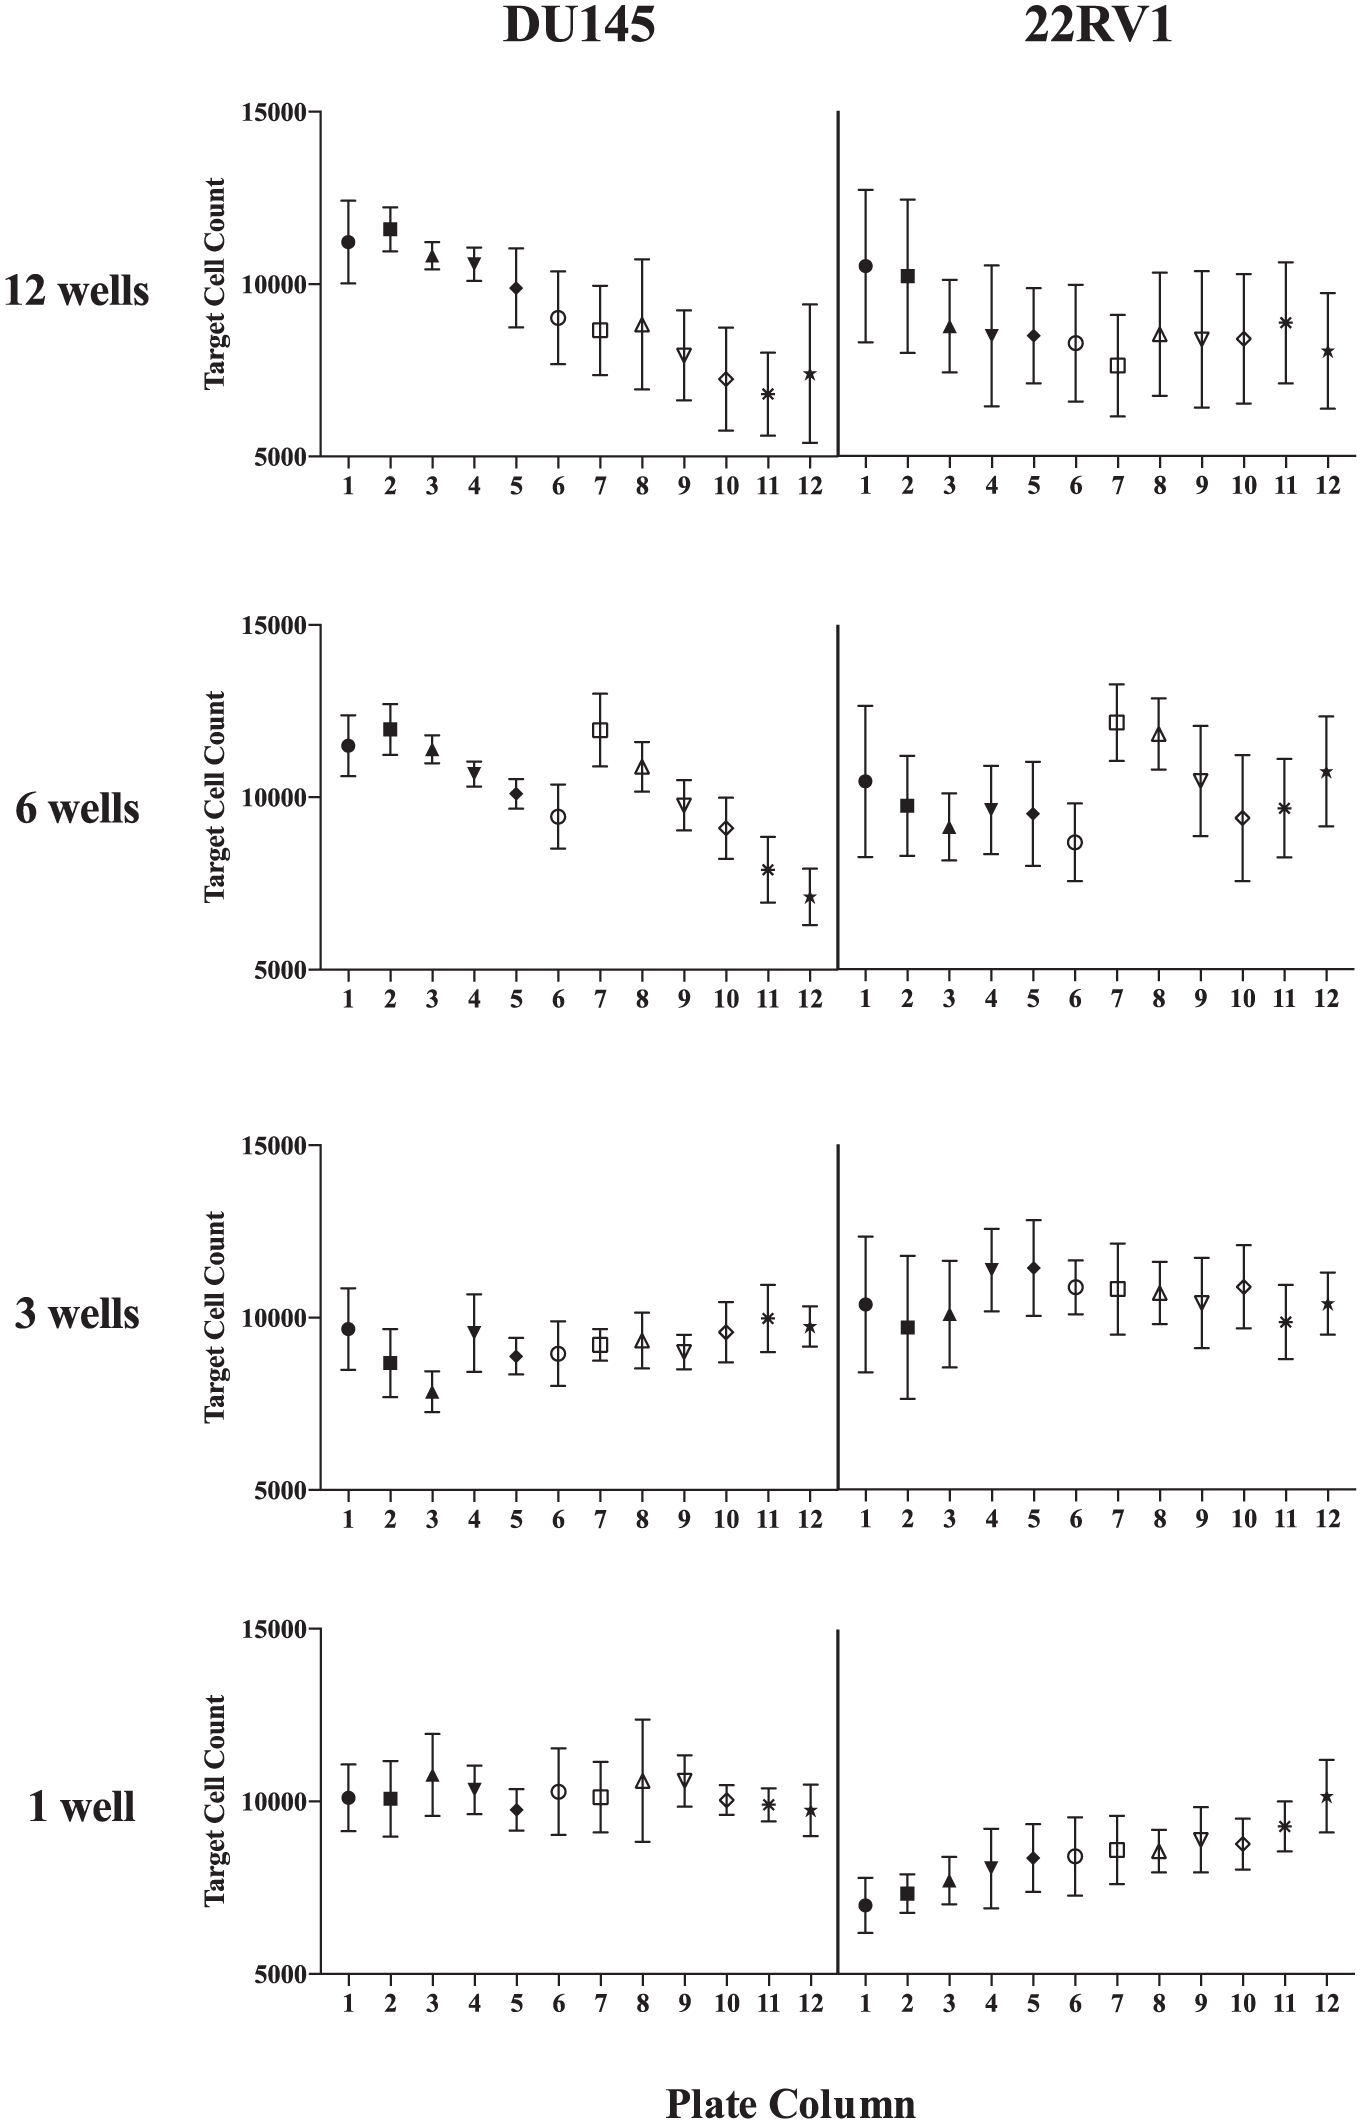
Optimization of plate-shaking parameters for adherent cells during high-throughput flow cytometry analysis. Four 96-well plates, containing 50,000 tumor cells per well, were plated with the adherent cell lines DU145 and 22RV1. After culturing for 48 h, cells were acquired following shaking every 1, 3, 6, or 12 wells during sample acquisition. For each plate, the cell counts in every column were averaged together. Samples were acquired row by row so that every well in each of the columns had the same condition, with respect to how recently the plate had been shook when the well was acquired.
We next evaluated the sensitivity of the instrument with respect to the minimum target cell numbers required for our T cell cytotoxicity and activation assay using a fixed E:T ratio of 3:1. Because this assay allows for the high-throughput evaluation of CAR constructs, it could be advantageous to minimize target cell numbers to cut down on cell-culturing requirements, particularly with respect to the number of primary T cells required. In these co-culture experiments, in which target cells were plated at densities ranging from 100,000 to 12,500 cells per well, we observed comparable results among all cell densities evaluated with respect to the measurement of T cell activation and cytotoxicity (
Fig. 4A
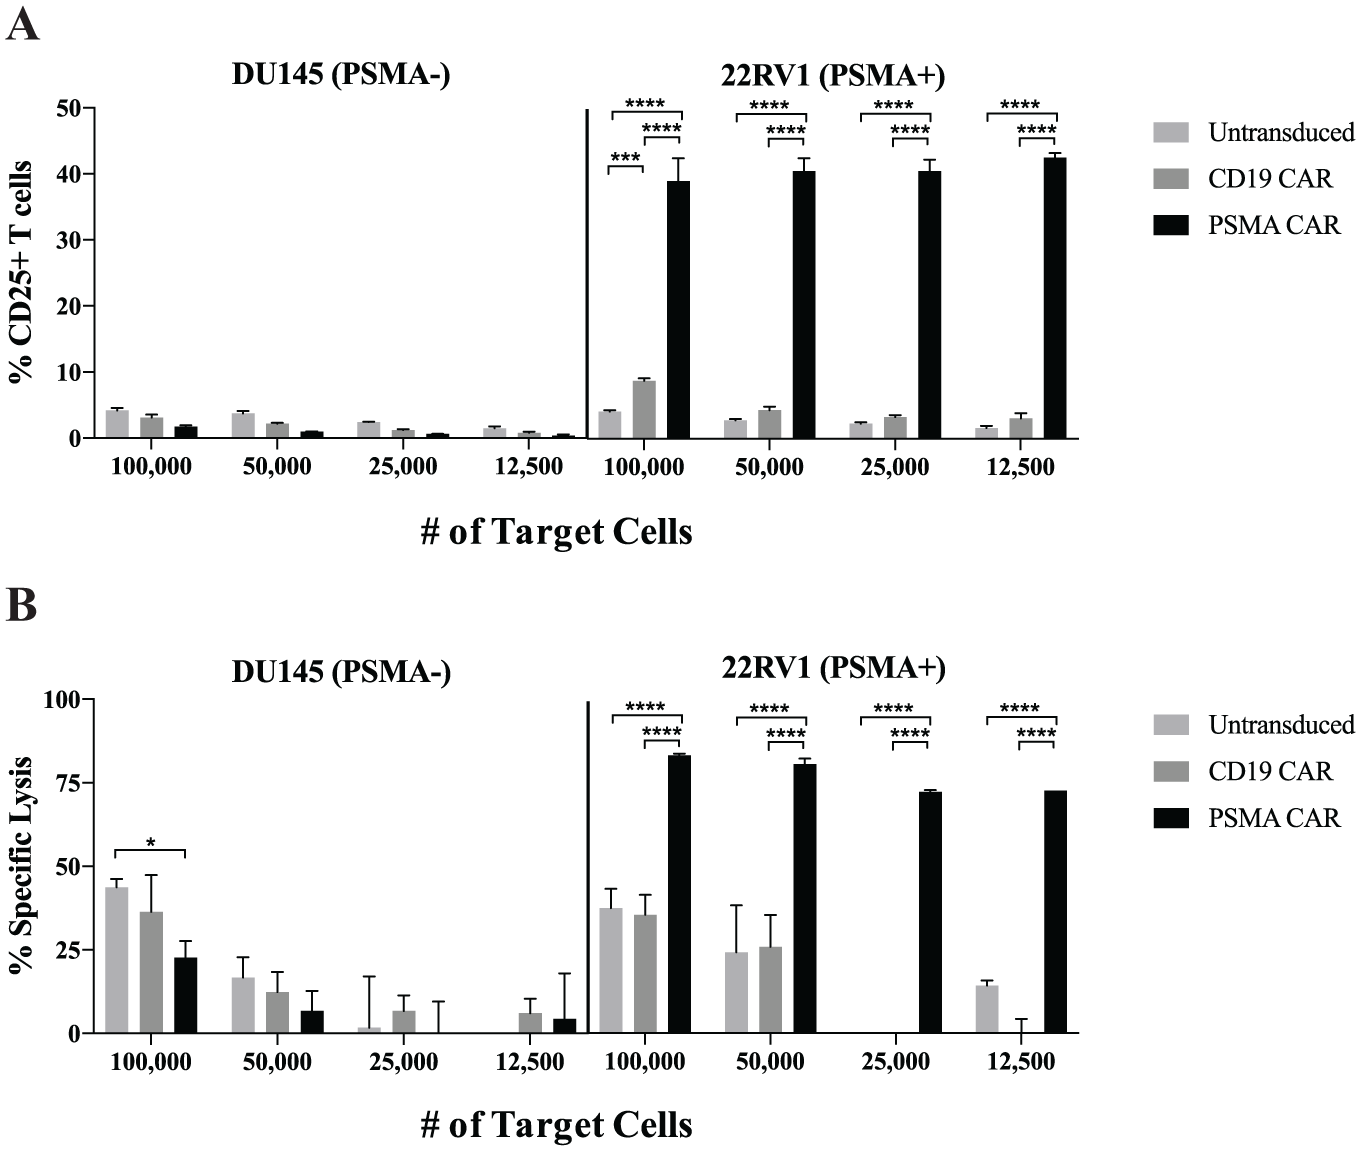
Optimization of cell density for T-cell activity and cytotoxicity. T cells expressing either CD19 or prostate-specific membrane antigen (PSMA) chimeric antigen receptors (CARs) were co-cultured with PSMA+ and PSMA− tumor cells for 48 h. Cells were plated with a fixed effector-to-target ratio of 3:1, with the number of target cells ranging from 12,500 to 100,000 per well. (
Consistency of Cytotoxicity Assay in a 96-Well Plate
On top of evaluating intraplate consistency of target cell acquisition ( Fig. 3 ), we evaluated the intraplate consistency in a functional assay to assess if significant differences in target cell counts were observed among target cells cultured alone (condition 1) and with either CD19 CARs (condition 2) or PSMA CARs (condition 3) within a single 96-well plate. In these assays, target cells were plated at 50,000 cells per well. We did not measure a significant difference in the number of target cells measured throughout columns when target cells were cultured with or without the antigen-irrelevant CD19 CARs in the same plate ( Fig. 5 ). This demonstrates that comparable results for negative controls would be measured throughout a 96-well plate. Importantly, cytotoxicity measurements of the PSMA CARs did not change in columns throughout the plate, with comparable target cell counts measured in columns 3, 7, and 11, which were approximately each one-third through the assay ( Fig. 5 ). In sum, we measured the specific TDCC of the PSMA CARs, and not untransduced T cells or CD19 CAR negative controls, consistently throughout a 96-well plate.
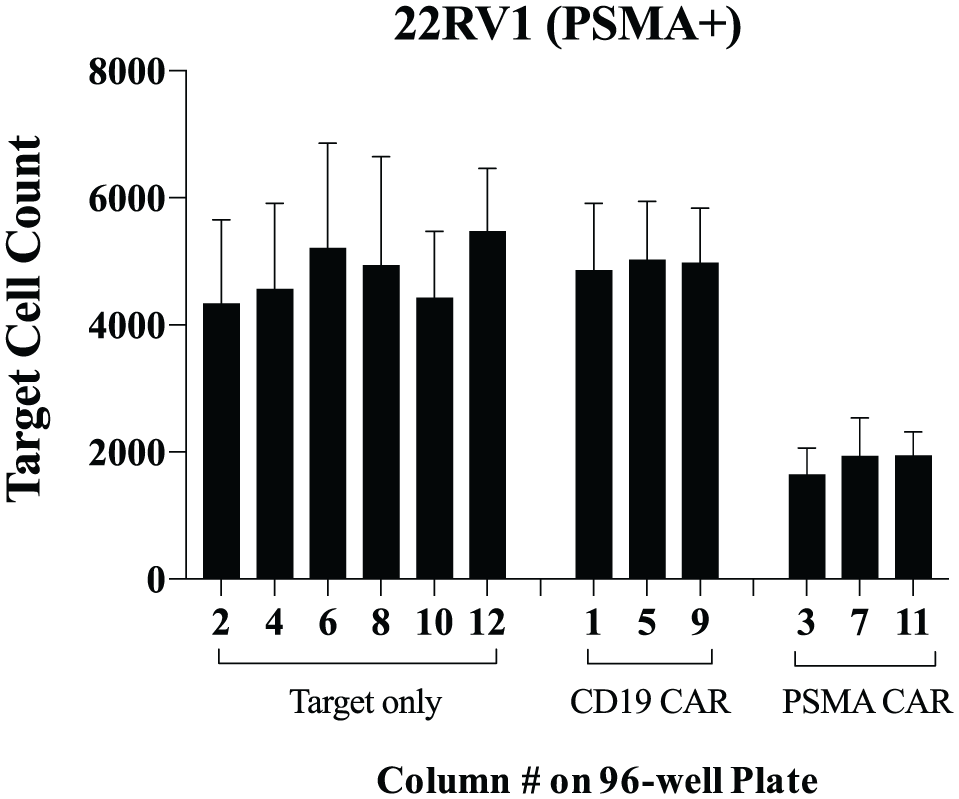
Intraplate consistency of cytotoxicity assay. Prostate-specific membrane antigen-positive (PSMA+) tumor cells (22RV1) were cultured either alone or with T cells expressing CD19 or PSMA chimeric antigen receptors (CARs) for 48 h, and wells were acquired by column on a 96-well plate. There are no significant differences between the column means within conditions, as determined by one-way analysis of variance (ANOVA) [targets only: F(5,41) =0.892, p = 0.495; CD19: F(2,21) = 0.0712, p = 0.932; PSMA CAR: F(2,21) = 1.36, p = 0.279].
Of note, in these and other cytotoxicity experiments, we measured a small (<5%) population of double-positive Cell Trace Violet and CD3+ cells ( Suppl. Fig 1C ). It is possible that this population represents trogocytosis, whereby the T cells are expressing some of the target cell membrane (Cell Trace Violet) rather than a compensation or other technical issue. Nonetheless, this small population is consistent among wells and excluded from all analyses.
Cytotoxicity and CAR-T Characterization Assay
Lastly, we report the results of the optimized flow cytometric method to characterize transduction efficiency, activation, and cytotoxicity of the PSMA CAR-T targeting prostate cancer cell lines. We measured CAR transduction for our CD19 and PSMA constructs to be approximately greater than 60% in human T cells from two independent donors ( Fig. 6A ). We did not measure a significant difference in the measurement of T cell transduction of PSMA CAR-T when CARs were co-cultured with either the DU145 PSMA-negative or 22RV1 PSMA-positive cell lines for 48 h ( Fig. 6A ). For CD19 CAR-T, we did measure a statistically significant difference for cells cultured with the DU145 and 22RV1 lines. Both of these cell lines are CD19 antigen-negative; it would be unlikely that these differences are due to antigen-induced proliferation, and they may not be biologically significant given they are within 10%.
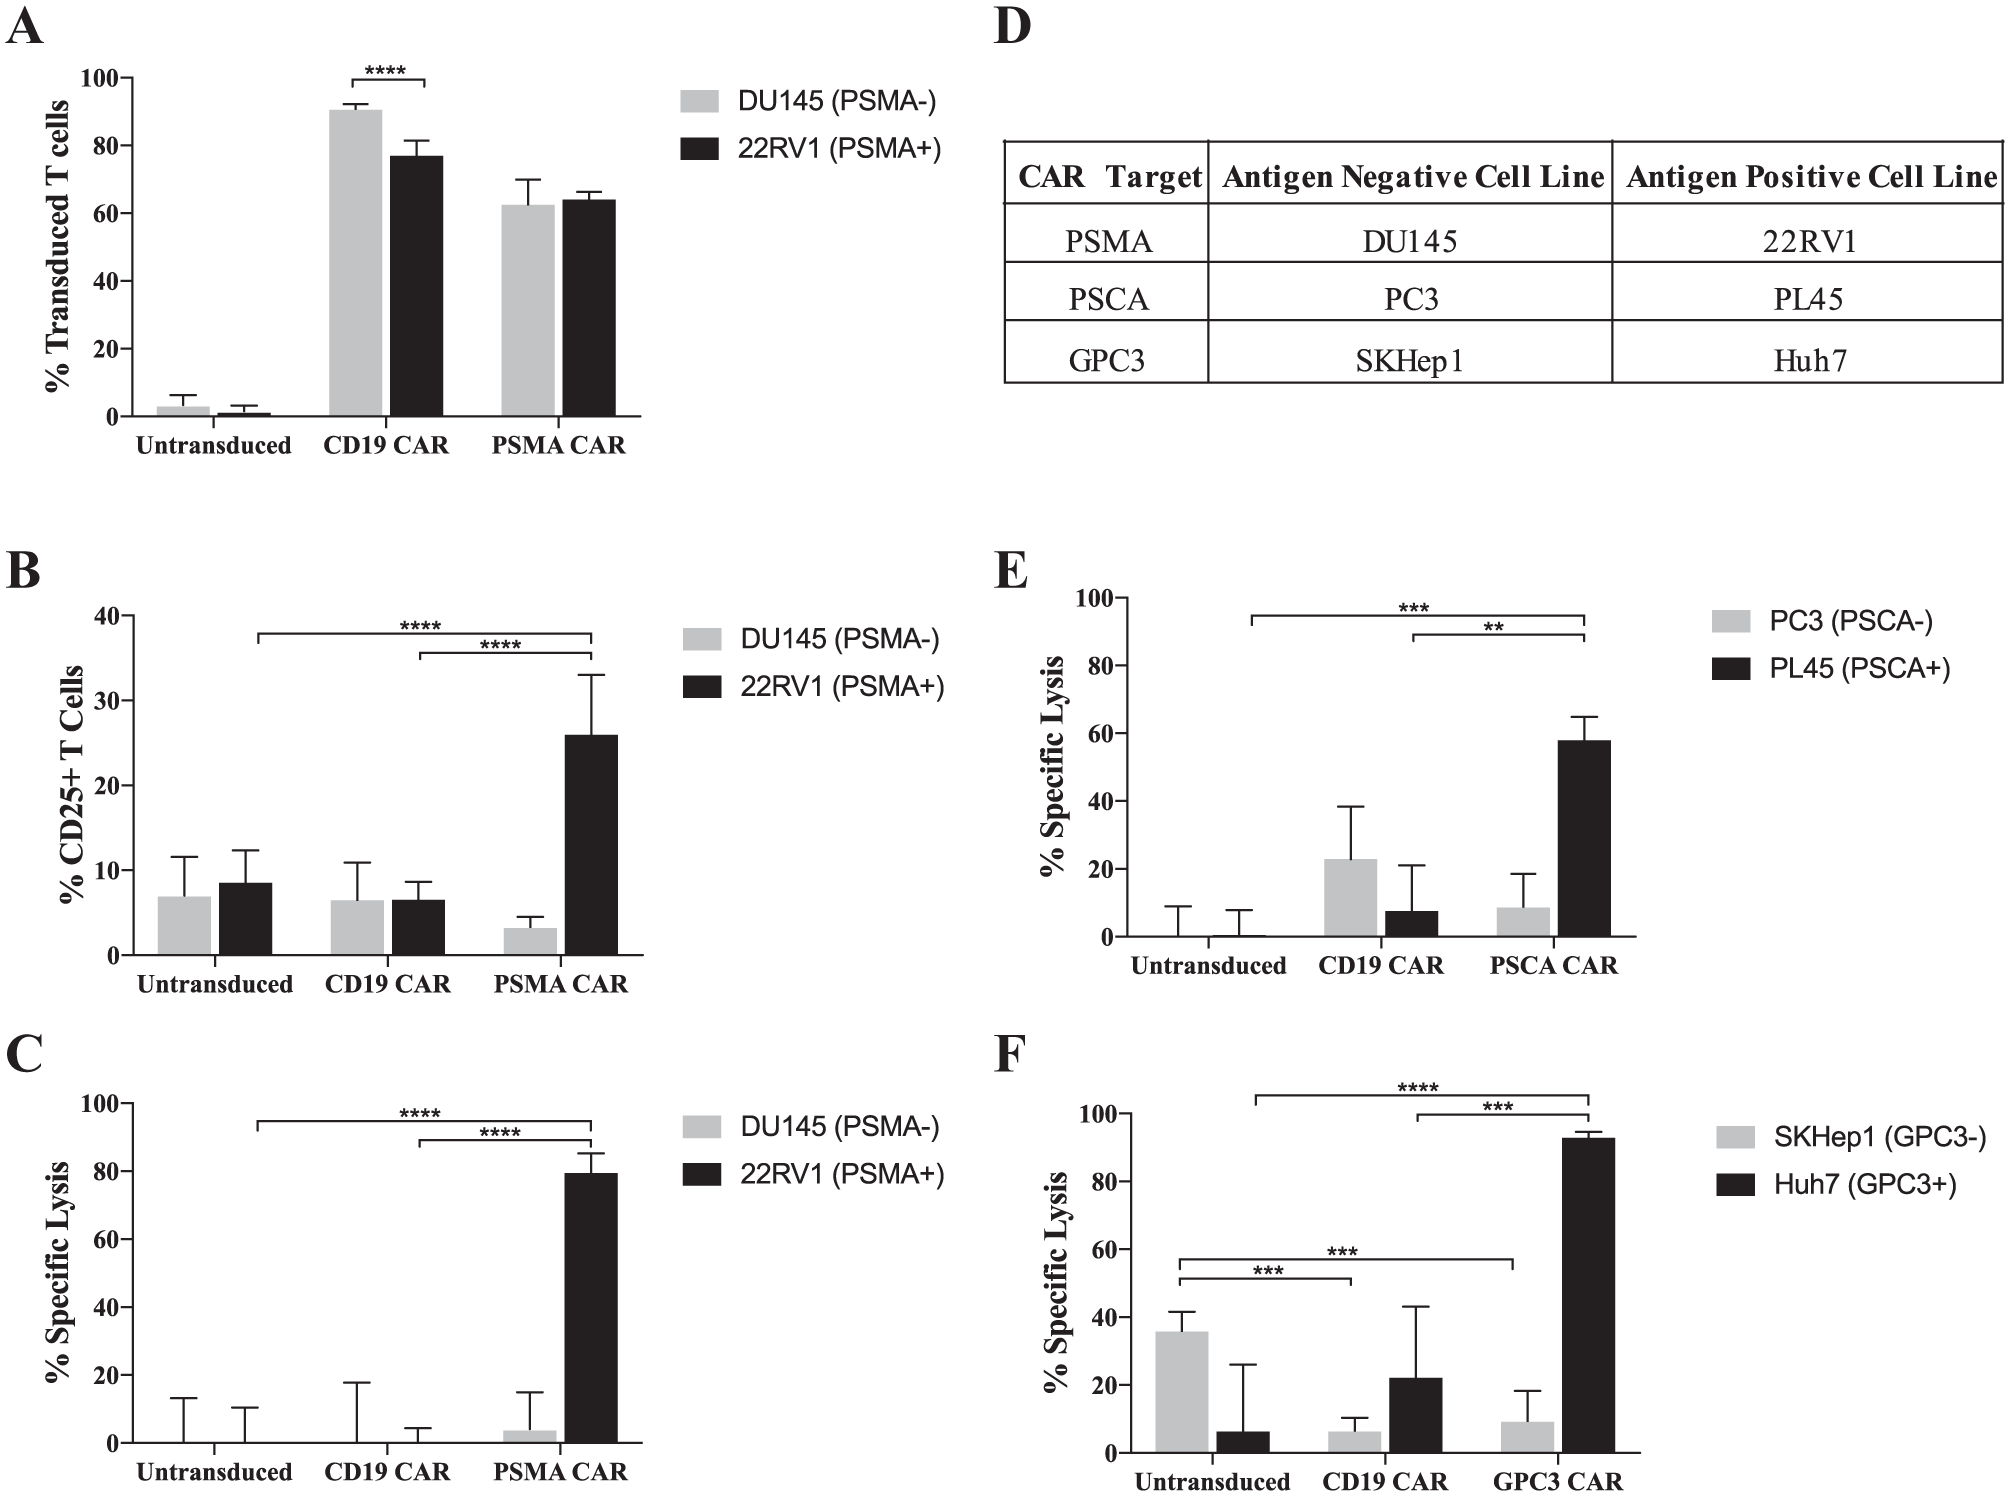
Representative assay results for solid tumor targeting chimeric antigen receptor (CAR)-T. Representative assay data from two donors showing: (
In this assay, the PSMA CAR-T was measured to have significant cytotoxicity relative to the nonspecific CD19 CAR and untransduced T cell negative controls when co-cultured with the antigen-positive 22RV1 cell line ( Fig. 6C ). These results showed concordance with cytotoxicity assays using an impedance-based platform, a method commonly used to measure solid tumor CAR-T cytotoxicity ( Suppl. Fig. 3 ). Notably, this assay had the sensitivity to measure TDCC against prostate cell lines expressing lower levels of antigen, such as PSMA, which was measured to have approximately 2000 copies on the cell surface of 22RV1 ( Suppl. Fig 2 ). We measured increased T cell activation, using the CD25 late activation marker, for the PSMA CAR-T when cultured with PSMA-positive cells compared to untransduced T cells and nonspecific CD19 CAR-T controls ( Fig. 6B ). Overall, we observed concordance with PSMA CAR-T cytotoxicity and T cell activation measurements.
We also evaluated T cell activation and cytotoxicity of the PSMA CAR-T when co-cultured with the PSMA-negative DU145 cell line. We did not observe any significant increases in T cell activation (CD25) or cytotoxicity when the PSMA CAR-T was co-cultured with the DU145 cell line compared to untransduced T cells and nonspecific CD19 CAR-T negative controls (
Fig. 6B
Lastly, we evaluated this assay to measure the cytotoxicity of two additional CAR-T’s against antigen-positive hepatocellular carcinoma and pancreatic cancer cell lines (
Fig. 6E
In sum, we describe the development and optimization of a multiparameter HTFC assay that allows for simultaneous characterization of engineered T cells and cytotoxicity. In this assay, the iQue instrument can acquire 96 wells within 30 min. This platform is amenable to the 384-well plate format and to further T cell characterization such as immunophenotyping. The addition of two markers in this assay, such as CD45RA and CD62L, could allow users to measure the composition of naïve central memory, effector memory, and effector T cells in these assays. This assay provides a multiparameter platform for the rapid evaluation of CAR-T against adherent cell lines with potential application for the evaluation of new cell-engineering approaches in the adoptive cell therapy field.
Supplemental Material
Supplemental_Info_for_HIgh-Throughput_CAR-T_Cytotoxicity_Assay_by_Martinez_et_al – Supplemental material for High-Throughput Flow Cytometric Method for the Simultaneous Measurement of CAR-T Cell Characterization and Cytotoxicity against Solid Tumor Cell Lines
Supplemental material, Supplemental_Info_for_HIgh-Throughput_CAR-T_Cytotoxicity_Assay_by_Martinez_et_al for High-Throughput Flow Cytometric Method for the Simultaneous Measurement of CAR-T Cell Characterization and Cytotoxicity against Solid Tumor Cell Lines by Emily M. Martinez, Samuel D. Klebanoff, Stephanie Secrest, Gabrielle Romain, Samuel T. Haile, Peter C. R. Emtage and Amy E. Gilbert in SLAS Discovery
Footnotes
Declaration of Conflicting Interests
The authors disclosed the following potential conflicts of interest with respect to the research, authorship, and/or publication of this article: All authors are employed by Kite Pharma (a Gilead company), and their research and authorship of this article was completed within the scope of their employment with Kite Pharma.
Funding
The authors disclosed receipt of the following financial support for the research, authorship, and/or publication of this article: All authors are employed by Kite Pharma (a Gilead company), and their research and authorship of this article was completed within the scope of their employment with Kite Pharma.
References
Supplementary Material
Please find the following supplemental material available below.
For Open Access articles published under a Creative Commons License, all supplemental material carries the same license as the article it is associated with.
For non-Open Access articles published, all supplemental material carries a non-exclusive license, and permission requests for re-use of supplemental material or any part of supplemental material shall be sent directly to the copyright owner as specified in the copyright notice associated with the article.