
Abstract
Biased agonists are defined by their ability to selectively activate distinct signaling pathways of a receptor, and they hold enormous promise for the development of novel drugs that specifically elicit only the desired therapeutic response and avoid potential adverse effects. Unfortunately, most high-throughput screening (HTS) assays are designed to detect signaling of G protein–coupled receptors (GPCRs) downstream of either G protein or β-arrestin–mediated signaling but not both. A comprehensive drug discovery program seeking biased agonists must employ assays that report on the activity of each compound at multiple discrete pathways, particularly for HTS campaigns. Here, we report a systematic approach to the identification of biased agonists of human apelin receptor (APJ). We synthesized 448 modified versions of apelin and screened them against a cascade of cell-based assays, including intracellular cAMP and β-arrestin recruitment to APJ, simultaneously. The screen yielded potent and highly selective APJ agonists. Representative hits displaying preferential signaling via either G-protein or β-arrestin were subjected to a battery of confirmation assays. These biased agonists will be useful as tools to probe the function and pharmacology of APJ and provide proof of concept of our systematic approach to the discovery of biased ligands. This approach is likely universally applicable to the search for biased agonists of GPCRs.
Introduction
Drugs targeting G protein–coupled receptors (GPCRs) are used in a wide range of diseases because of the diverse physiological roles of these targets. Indeed, modulation of GPCR function is one of the most common treatment modalities, with more than 33% of approved drugs targeting GPCRs. 1 These drugs were discovered through screening chemical libraries using a binary approach, either seeking agonists to mimic endogenous receptor activation or antagonists to block endogenous agonist binding. However, signaling networks downstream of GPCR engagement by the ligand are more complex, involving multiple responses, not all of which may have therapeutic benefit. 2 Biased agonism describes the phenomenon by which GPCR agonists do not equivalently activate all cellular signaling cascades coupled to a given receptor. This new paradigm in GPCR function suggests that biased ligands could be used as precision medicines that modulate receptor function in a clinically meaningful way, eliciting only the therapeutic effect desired and avoiding potential side effects or toxicity. 3
Exploiting this new paradigm for therapeutic application requires identifying ligands that show biased agonism for all potentially therapeutic targets. These critical tools, in which a ligand favors one response over another (either G protein or β-arrestin) compared with the neutral endogenous ligand will be needed to fully characterize the pleiotropic signaling of the target receptor, thus providing a guide as to which signals will elicit the desired outcome and which to avoid. To date, only a handful of truly biased agonists have been described (e.g., for calcitonin 4 and adenosine A3 receptors 5 ), and these have been largely discovered serendipitously. Indeed, the prototype biased agonist (Sar1Ile4Ile8)-angiotensin II (SII) was used for years as an angiotensin II type 1 receptor (AT1R) receptor antagonist 6 before its biased signaling properties were elucidated. 2 These studies led AT1R to be one of the most studied GPCRs for biased ligands and the ultimate development of TRV120027 as the first biased ligand to enter clinical trials. 7 TRV120027 is a β-arrestin–biased AT1R agonist that uses all three aspects of β-arrestin function: desensitization, internalization, and signaling. TRV120027 improves hemodynamic and structural parameters in cardiovascular syndromes characterized by hypertension and insufficient cardiac performance in vivo. 8 Another example of a serendipitously discovered biased agonist is carvedilol. Initially described as a “beta-blocker,” carvedilol also activates ERK pathways via β-arrestin–dependent signaling mechanisms, suggesting that it is an “activator” at the β2 adrenergic receptor for this pathway. 9 There is an ever-expanding body of research describing ligands whose biased signaling was previously unappreciated but are now shown to confer therapeutic benefit or pharmacological specificity. To fully realize the potential of biased agonism for drug discovery, a more systematic approach to the discovery of biased agonist tool compounds is required. Here we describe our strategy and implementation of a biased ligand discovery effort using the apelin receptor as an example.
Apelin is the endogenous ligand for the previously orphaned GPCR APJ (a.k.a. AGTRL-1, APLNR), a class A GPCR widely distributed in the brain, heart, and vasculature10,11 and an important regulator of body fluid homeostasis and cardiovascular functions.12–14 Elabela (a.k.a. apela or toddler), a second APJ ligand, 15 displays similar pharmacology and elicits many of the same effects of apelin in vivo.16,17 Importantly, elabela plays a critical and distinct role in early development long before apelin gene expression is present.15–18 Activation of apelin receptors by both apelin and elabela inhibits forskolin-stimulated cAMP, recruits β-arrestin, and stimulates internalization of APJ.7-21 Down-regulation of the apelin signaling pathway is associated with cardiovascular disease, including heart failure and pulmonary artery hypertension, 22 and a synthetic agonist could have therapeutic benefit in either condition. Many GPCR agonists produce desensitization, transient responses that may last for seconds or minutes but that return to baseline even in the continued presence of the ligand. One mechanism of this desensitization is internalization and silencing of the target receptor via the β-arrestin pathway, suggesting that apelin agonists that show G-protein pathway bias with reduced β-arrestin interaction may have therapeutic benefit via longer-acting activation, a concept that is being tested in human trials. 23 In addition to desensitization, APJ’s interaction with β-arrestin also produces signaling independent of interactions with the G-protein, including activation of MAPK signaling. We have recently reported that β-arrestin–dependent signaling via APJ leads to maladaptive cardiac hypertrophy in vivo. 24 Collectively, these observations suggest that a biased agonist of APJ that selectively activates G-protein–dependent signaling may yield the desired pharmacodynamic effects while avoiding deleterious outcomes. Indeed, in addition to the traditional high-throughput screening (HTS) approaches to APJ drug discovery that yielded a series of small-molecule APJ agonists,25–28 there has been an ongoing effort to prospectively design biased agonists of the apelin receptor. Brame and colleagues 29 used computer-aided molecular dynamics approaches to develop MM07, a peptide analog of apelin displaying G-protein signaling bias in vitro and in vivo. Similarly, the small-molecule compound CMF-019 displays G-protein bias at APJ and elicits a cardioprotective effect in rats with an experimentally induced myocardial infarction. 30
Using APJ as a prototypical receptor for which a biased agonist is desired, we applied a broadly applicable, optimized strategy to capture efficacy and categorize biased ligands using an HTS strategy that incorporated parallel primary screens (cAMP v. β-arrestin), followed by counterscreening against a related receptor and secondary assays to confirm bias and target engagement ( Fig. 1 ).
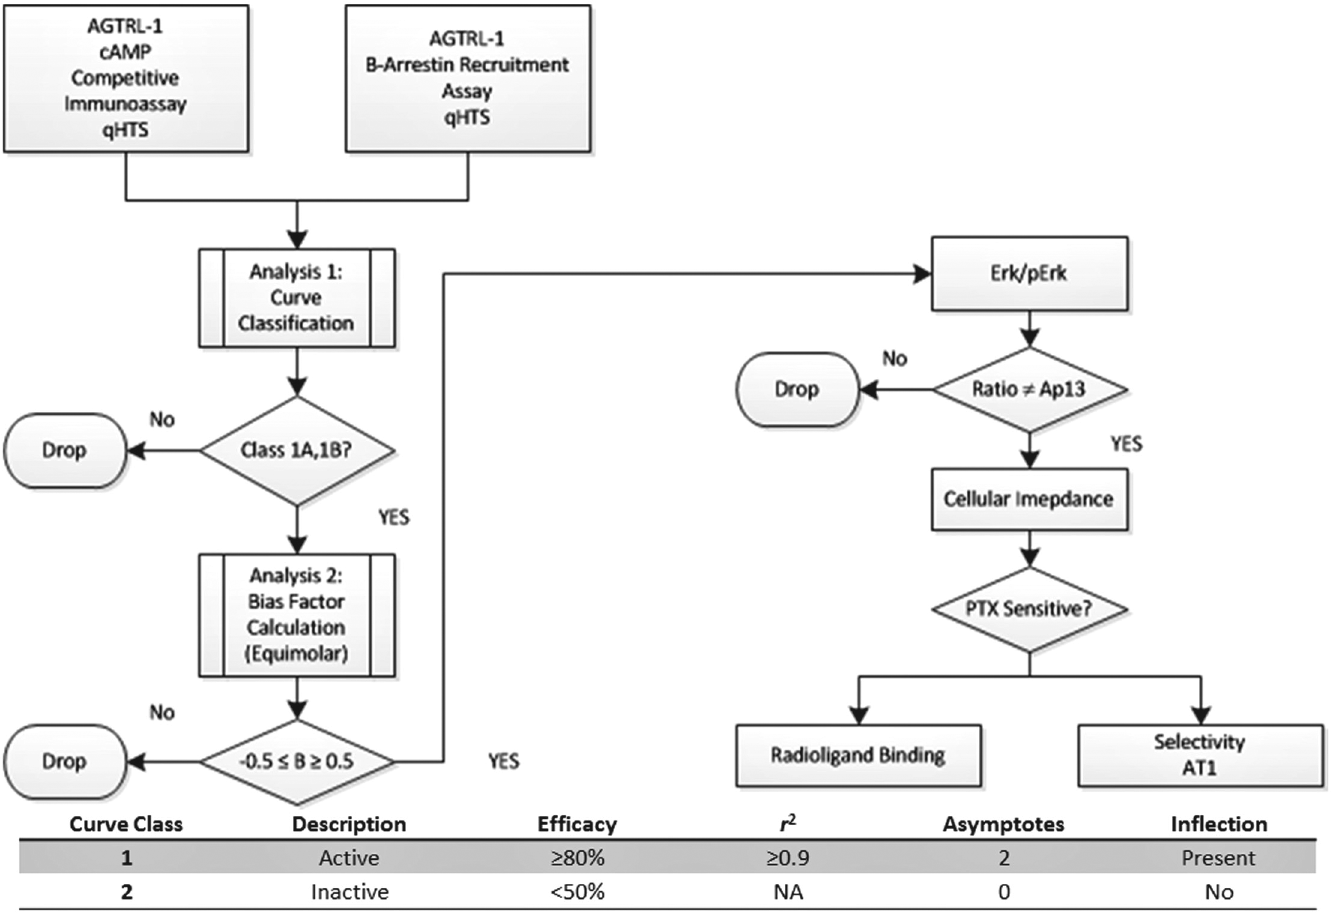
Screening strategy and assay performance metrics. To systematically identify compounds that exhibit biased agonism at APJ, we simultaneously executed two cell-based assays, each reporting on different pathways (G-protein or β-arrestin), in quantitative HTS mode. These primary assays were followed by a series of confirmatory assays to validate hits, confirm selectivity, and verify biased agonism. Curve classification criteria are provided in the nested table.
Materials and Methods
Reagents
Unlabeled Ang II and Ap13 peptides were purchased from 21st Century Biochemicals, Inc. (Marlborough, MA). [125I]-Glp65, Nle75, and Tyr77-Ap13 were purchased from PerkinElmer (Waltham, MA). All other chemicals and reagents were from Sigma-Aldrich (St. Louis, MO).
Peptide Library Synthesis and Preparation
A library of modified versions of the Ap13 peptide was designed using both a rational and a random side-chain substitution approach. Additional modifications included cyclization, PEGylation, and substitution of D-isomer or nonnatural amino acids. Four hundred forty-eight modified versions of human apelin-13 (Ap13, RPRLSHKGPMPF) were synthesized by 21st Century Biochemicals using Fmoc/t-Bu solid-phase peptide chemistry. The crude products were purified to >95% purity by preparative high-performance liquid chromatography and converted to an acetate salt to avoid the exposure of cells to trifluoroacetate. The final peptides were characterized by analytical high-performance liquid chromatography (purity >95%), nanospray mass spectrometry using a QSTAR XL Pro (Qo-TOF), and the sequence confirmed via tandem MS (collision-induced fragmentation). The peptides were dissolved in endotoxin-free water to obtain 10 mM stock solutions, before being compressed from 96-well plates to 384-well plates using an Evo Freedom 150 (Tecan, Morrisville, NC) equipped with a 96-well head to prepare plates at concentrations ranging from 2 to 10 mM in ligand buffer (0.1% bovine serum albumin [BSA], 10 mM HEPES, HBSS). Preparation of all concentration-response plates were also performed on the Evo Freedom 150 system, whereby 2 mM stock plates were used to prepare 10 µM concentrations and diluted threefold yielding a 10-point concentration-response curve.
Cell Culture
PathHunter GPCR Arrestin and cAMP Hunter cell lines (DiscoveRx Corp., Fremont, CA) were used to assay G-protein–dependent signaling and β-arrestin recruitment to APJ. CHO-K1 cells stably expressing APJ (CHO-K1-APJ) or AT1 (CHO-K1-AT1) with β-arrestin/β-galactosidase enzyme fragment complementation constructs were cultured in HAM’s F-12 medium (Hyclone, Logan, UT) supplemented with 10% fetal bovine serum (FBS), 1X penicillin-streptomycin-glutamine (Invitrogen, Carlsbad, CA), 300 µg/mL hygromycin (EMD Biosciences, San Diego, CA), and 800 µg/mL Geneticin (Cellgro, Manassas, VA). CHO-K1 cells stably expressing APJ (CHOK-APJ) alone, without β-arrestin/β-galactosidase enzyme fragment complementation, were grown in HAM’s F-12 medium supplemented with 10% FBS, 1X penicillin-streptomycin-glutamine, and 800 µg/mL hygromycin. All cells were incubated at 37 °C (5% CO2, 95% relative humidity) and maintained at less than 70% to 80% confluence (approximately 75,000 cells/cm2).
cAMP Assay
All reagents unless otherwise specified are components of the cAMP HitHunter (DiscoveRx) kit. Ligand buffer + 60 µM forskolin (Cayman Chemical, Ann Arbor, MI) was made fresh on the day of the experiment and used for the dilution of positive and negative controls as well as all peptides. CHO-K1-APJ cells were dispensed into a 384-well tissue culture microplate (Corning, Corning, NY) using a Multidrop at a seeding density of 10,000 cells/well and returned to the incubator. The next day, the cell culture media were removed and replaced with 15 µL/well of assay buffer (1X HBSS, 10 mM HEPES) containing anti-cAMP antibody (DiscoveRx). Using the Janus Automated Workstation (PerkinElmer), 5 µL of AP-13, ligand buffer (vehicle), or peptide (10-point concentrations) were added to all wells and subsequently incubated at 37 °C for 30 min. A working solution of ED/lysis/CL substrate (20 µL/well) was added to all wells and incubated for 1 h at room temperature in the dark prior to a final addition of EA reagent (20 µL/well). Plates were incubated at room temperature in the dark for 3 h prior to chemiluminescence detection on an EnVision (PerkinElmer) using a counting time of 1 s/well.
β-Arrestin Recruitment Assay
CHO-K1 cells engineered to overexpress APJ and β-arrestin were removed from flasks using TrypLE Select (1X), no phenol red (Life Technologies, Grand Island, NY), centrifuged, and resuspended in CP2 Reagent (DiscoveRx, Fremont, CA). Cells were counted using a Countess Automated Cell Counter (Invitrogen, Carlsbad, CA), and 5000 cells/well were plated in a 384-well tissue culture treated microplate (Corning). All plates were incubated overnight at 37 °C, 5% CO2 in a final volume of 25 µL/well. Following incubation, 5 µL of peptides (10-point concentrations) and controls prepared in ligand buffer (1X HBSS, 10 mM HEPES, 0.1% BSA) were added to cells and incubated at 37 °C for 1.5 h. Using a Multidrop Combi Reagent Dispenser (Thermo Scientific, Waltham, MA), 12 µL of detection reagent (DiscoveRx) composed of substrate and cofactors was added to all wells and incubated at room temperature in the dark for 1 h. Chemiluminescent signal was detected on an EnVision multilabel plate reader (PerkinElmer) using a counting time of 1 s/well. The robustness of data from each screening plate and run was monitored by Z′ and signal window calculation. 31
Quantitative HTS Data Analysis
A standard formula (Eq. 1) for normalizing raw data to neutral and negative controls was used (see https://www.ncbi.nlm.nih.gov/books/NBK53196/):
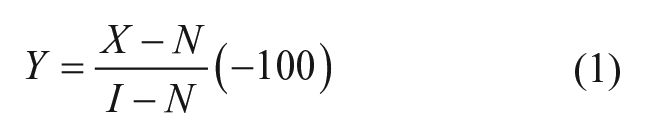
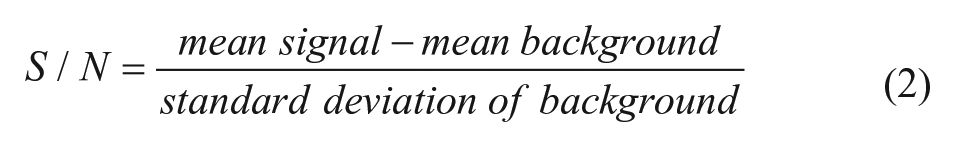
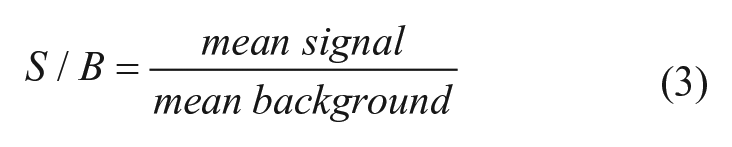
where Y = percentage activity (negative for inhibition and positive for activation), x = data value, N = median of negative control, and I = median of inhibitor control. Signal to noise and signal to background were calculated as
Titration Curve Fitting
Curve fitting was performed using either CBIS (Cheminnovation Inc., San Diego CA) or Prism 6 (GraphPad, San Diego CA), both of which apply the standard Hill equation:
where
Calculating Bias
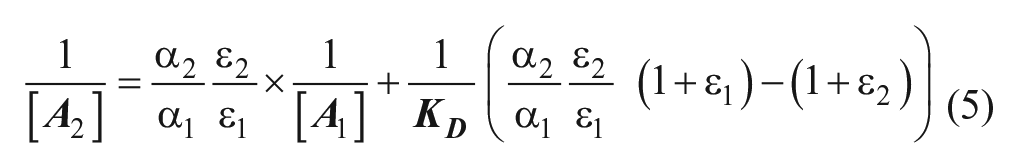
Ligand bias was quantified using the equimolar comparison approach originally proposed by Christopoulos and colleagues 32 and subsequently employed by Lefkowitz and colleagues 33 (Eq. 5). In this approach, the concentrations of ligand required for an equiactive response for pathway 1 ([A1]) and 2 ([A2]) are extrapolated from fits of each concentration-response curve, and the linear relationship between the inverse of these concentrations is then determined with
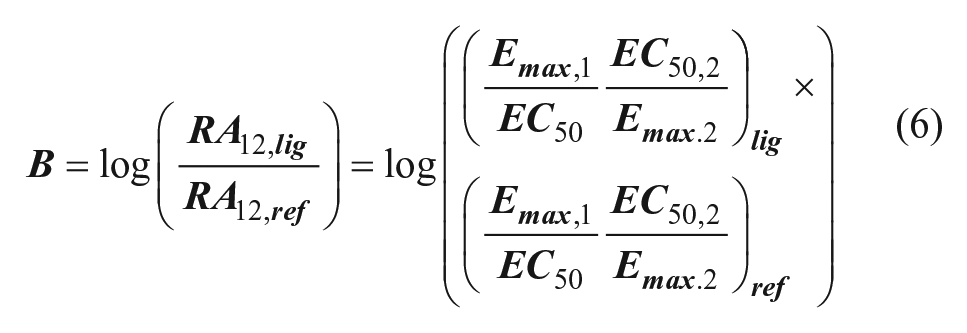
A bias factor (B), which quantifies the relative stabilization of one signaling state over another compared with the reference agonist, can then be calculated from
ERK1/2 Activation Assay
Quantification of phosphorylated ERK1/2 levels was performed exactly according to the HTRF-Cellul’erk one–plate assay protocol (CisBio). U2OS cells overexpressing AGTRL1, (DiscoveRx# 930710-P3) were seeded onto 384-well low-volume, white, opaque plates in EMEM medium containing 2% heat-inactivated serum at a density of 10,000 cell/well and cultured overnight. The next day, cells were incubated with agonists for 15 min at room temperature. This was followed by 15 min incubation with the supplemented lysis buffer. Anti-phospho ERK1/2-d2 (acceptor) and anti-ERK1/2 Eu3+–Cryptate (donor) were added to each well, and plates were incubated in the dark for 2 h. Time-resolved fluorescence resonance energy transfer signals were measured using an EnVision multimode plate reader (PerkinElmer). Data are presented as HTRF ratios, which are based on the fluorescence ratio emitted by the d2-labeled anti-phospho-ERK1/2 (665 nM) over the light emitted by Eu3+–Cryptate-labeled anti-phospho-ERK1/2 (620 nm).
Cellular Impendence Assay
The xCELLigence system (Acea Biosciences, San Diego, CA) was used to measure changes in cellular impedance (CI) in response to compounds. This label-free assay platform uses an array of microelectrodes embedded at the bottom of wells of a microtiter plate. Impedance between the electrodes is in part dependent on cells and the extent to which they are attached to the electrode. In the absence of cells, impedance is dictated by the ion environment both at the electrode/solution interface and in the bulk solution. Cells attached to the electrode surfaces alter this environment, leading to an increase in the impedance. The magnitude of this effect is dependent on cell density, morphology, and the extent to which cells are attached to the electrodes. Thus, any changes in cell physiology that modulate the physical contact between cell and electrode, such as changes in morphology and/or adhesion, will be reflected by changes in the measured impedance. CI is quantified using algorithms to transform complex data into simple kinetic traces 34 using the following formula:
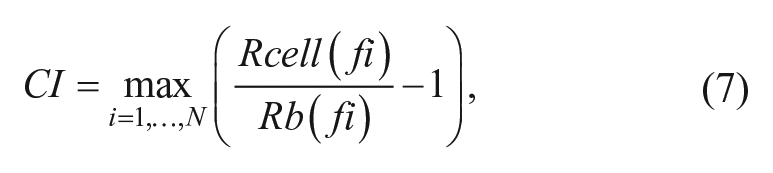
where Rb(f) and Rcell(f) are the frequency-dependent electrode resistances (a component of impedance) in the presence or absence of cells, respectively. N is the number of the frequency points at which the impedance is measured. Thus, CI is a quantitative measure of the status of the cells in an electrode-containing well. A delta cell index at a given time point is calculated by subtracting the cell index at the time of peptide addition from the cell index at the time point:

The delta cell index is calculated for vehicle as well and then used subsequently in the delta delta cell index formula at a specific time:

To measure CI in response to compound addition, a background CI is assessed in the presence of cell plating or low-serum medium prior to cell seeding. After, cells were plated at a cell density of 30,000 cells/well and cultured for 16 h before removing all media and replacing with ligand buffer. Compounds were then added to cells following a 1 h equilibration period. CI is continuously monitored with the plate remaining in the device station until the end of the experiment. When cells were exposed to pertussis toxin (PTX), they were plated at a cell density of 30,000 cells/well, exposed to PTX after 4 h, and stimulated with compound 16 h after seeding. Experimental variation in cell index values at the time of treatment was limited to 20%, which considerably increased the reproducibility of the CI and compound responses. Cells were treated with compounds as indicated, and cell index values were obtained immediately following compound addition every 30 s for a total time of 60 min. Cell index values were normalized as described above using the maximal response under each experimental condition as equal to 100%. All data presented in figures represent the mean of at least three independent experiments.
Radioligand Binding
Prior to the initiation of the assay, soaking buffer (50 mM Tris-HCl pH 7.5, 0.5% polyethyleneimine), assay buffer (25 mM HEPES pH 7.5, 10 mM MgCl2, 1mM CaCl2, 0.5% BSA, protease inhibitor), and wash buffer (50 mM Tris-HCl pH 7.5, 0.5% BSA) were prepared. Soaking buffer (300 µL/well) was added to a 96-well GF/C filter plate (MultiScreen Harvest plate; Millipore, Billerica, MA) and left to equilibrate at room temperature for 3 h. Briefly, 25 µL of peptide (eight-point concentrations), 25 µL of 0.2 nM [125I] Glp65, Nle75, Tyr77-Ap13 (PerkinElmer), and 150 µL APJ membrane (PerkinElmer) diluted 1:150 in assay buffer were added to a 96-well HB OptiPlate (PerkinElmer) and incubated at room temperature for 45 min. Following incubation, contents were transferred from the OptiPlate to the prewet GF/C filter plate and immediately underwent vacuum filtration. The filter plate was washed five times with 200 µL ice-cold wash buffer and left at room temperature overnight to equilibrate. The next day, 20 µL scintillation liquid (Microscint 20, PerkinElmer) was added and radioactivity quantified using a TopCount NXT (PerkinElmer) microplate scintillation and luminescence counter.
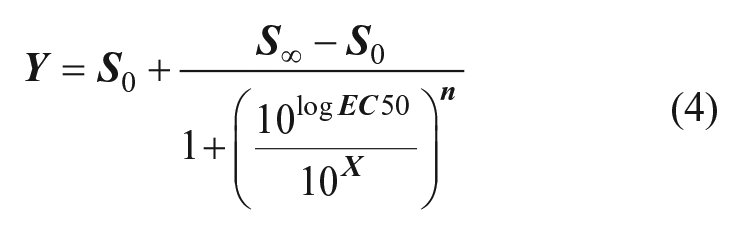
Competition binding analysis for the agonist [125I]-Glp65, Nle75, Tyr7-Ap13 by SBI-612 in the absence and presence of Ap13 (100 nM) was performed according to the following equation (GraphPad Prism version 6):
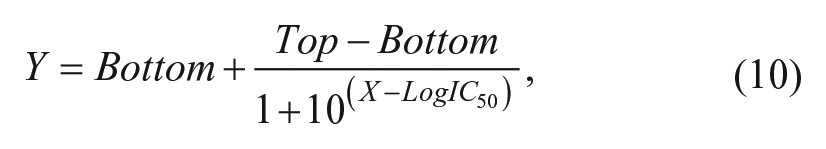
where Y represents specific binding of the radioligand, Top is the specific binding of the radioligand in the absence of competing ligand, Bottom is the specific binding of the radioligand equivalent to nonspecific binding, IC50 is the concentration of competing ligand that produces radioligand binding halfway between the Top and Bottom, and X is the logarithm of the concentration of the competing ligand. The Cheng & Prusoff equation was used to convert IC50 estimates to equilibrium dissociation constants. 35
Results
Screen Design and HTS: cAMP and β-Arrestin
Biased agonism is a complex phenomenon that arises from the calculus of ligand-receptor concentration-response relationships, including potency, efficacy, and signal transduction efficiency. 36 We therefore designed our screening approach to test for drug titrations (also known as quantitative HTS), as opposed to single-dose screening ( Fig. 1 ). To capture the full dose-response curve, compounds were tested over 10 concentrations (from 10 µM to 0.01 nM, depending on the assay) in threefold dilutions.
We screened a 448-peptide library containing modified versions of Ap13 peptide by performing β-arrestin and cAMP assays in parallel to determine whether different ligands showed a bias toward stimulating one pathway or the other. Both the β-arrestin recruitment assay and cAMP assay have been described in detail elsewhere37,38 with detailed protocols provided at PubChem Bioassay (AID No. 2580 and 2569).
Both β-arrestin and cAMP assays showed suitable assay performance characteristics,
39
including high signal-to-noise and signal-to-background ratios and average Z-scores of 0.63 (β-arrestin) and 0.73 (cAMP) across the entire screening campaign. Individual plates also showed suitable Z-scores, indicating acceptable intra-assay variability (
Concentration-Response and Bias Analyses
Automated analysis of quantitative HTS data revealed a variety of concentration-response curves elicited by each peptide in either β-arrestin or cAMP. To broadly define and encompass the diversity of these curves, we devised a simple approach to classify compound bias based on the quality of a given compound curve fit in one assay platform relative to the other. This classification system is adapted from that previously reported
40
and takes into account the curve fit (r2), magnitude of the response (efficacy), and presence of an inflection point (EC50, potency). Compounds with efficacy <50% or no response or no inflection point were classified as inactive. Because of the single-replicate nature of this experiment, each curve was visually inspected to invalidate any obvious outliers. Thus, every compound was defined as either active or inactive. Compounds that were classified as inactive (
Fig. 1
, criteria 2) were not analyzed further. All compounds that met curve classification criteria 1(
Fig. 1
, criteria 1) were considered “active” (
Fig. 2A
). Subsequently, we segregated and classified the active compounds into two groups: 1) compounds that were inactive in cAMP but active in β-arrestin (class 1A,
Fig. 2B
) and 2) compounds that were active in cAMP but inactive in β-arrestin (class 1B,
Fig. 2C
). This yielded a total of 274 “actives” (see
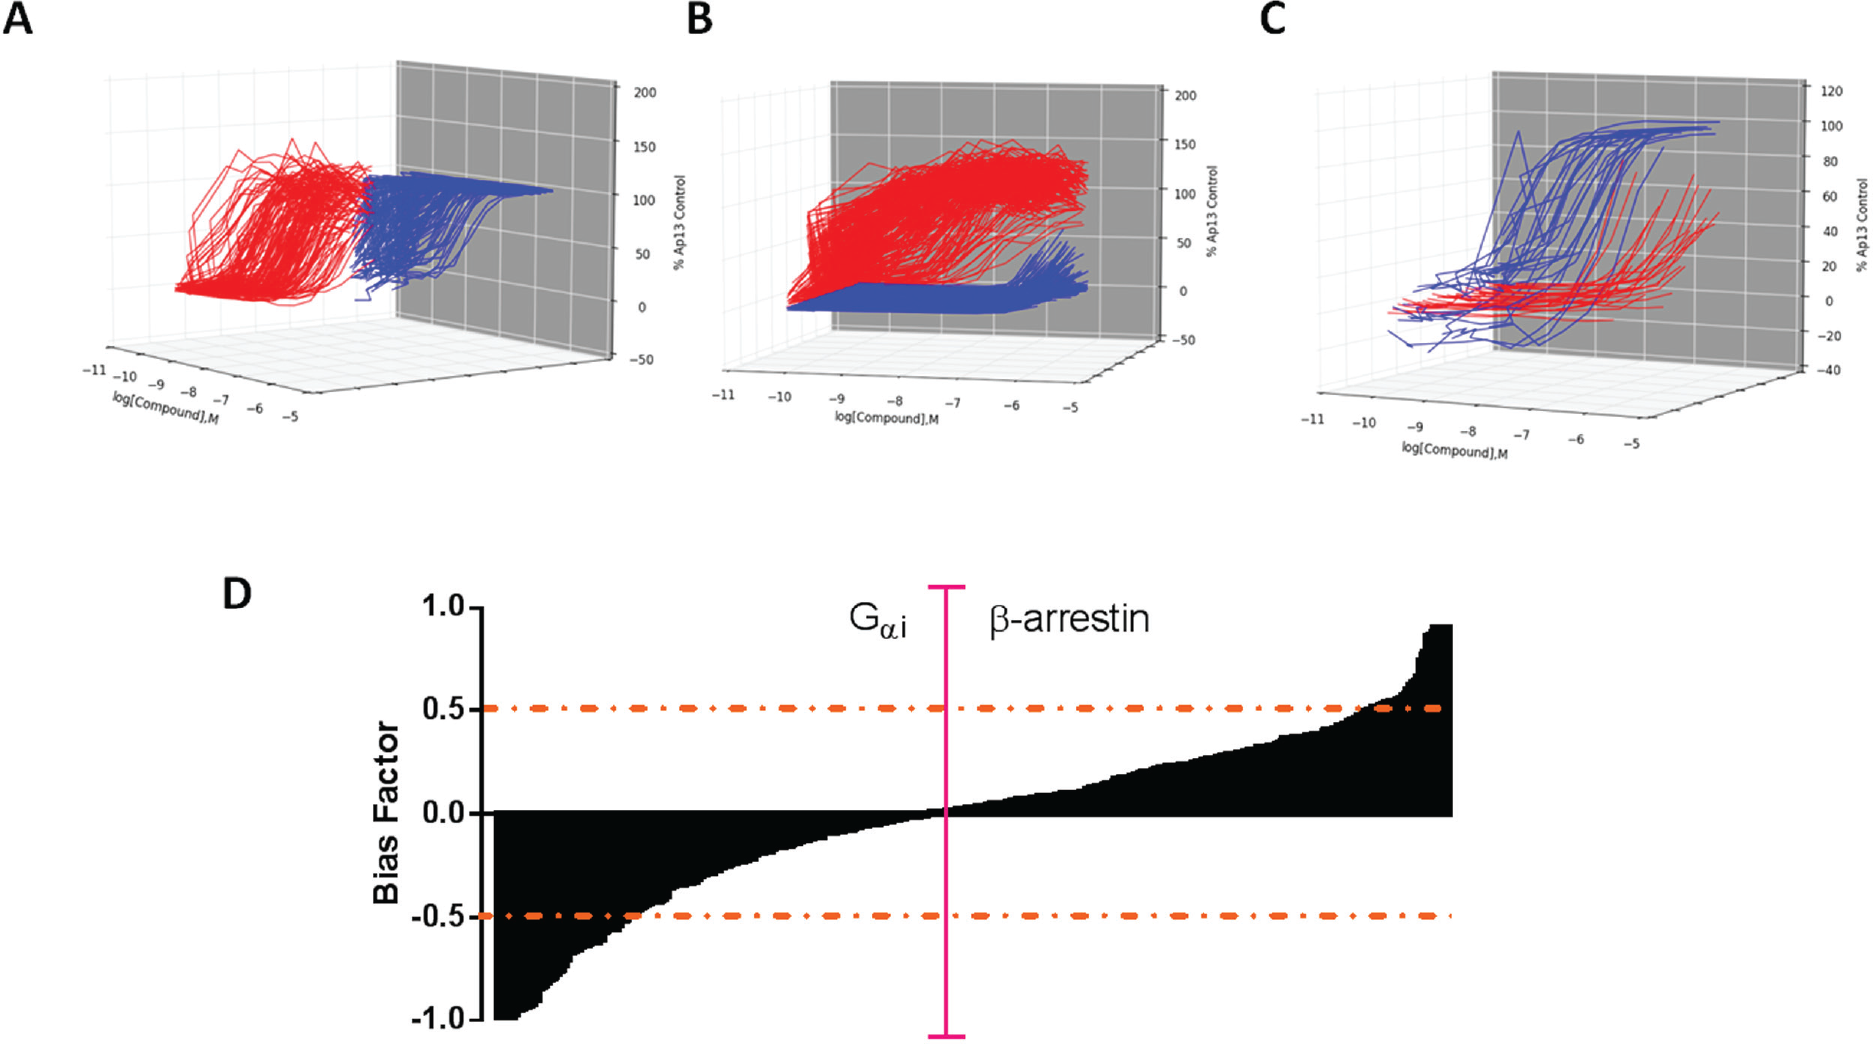
Classes of titration curves obtained from biased agonist screen performed in quantitative high-throughput screening mode. (
Hit Confirmation
All four compounds identified and confirmed as biased agonists of APJ were resynthesized, and hit confirmation assays were performed on freshly obtained dry powder compounds. Table 1 summarizes the reconfirmation results for lead compounds of each scaffold, and potency values from fresh solids ( Fig. 3 ; EC50 values in Table 1 ) closely match those obtained from fresh solutions in house (HTS EC50 values, data not shown).
Summary of Biased Agonist Characteristics.
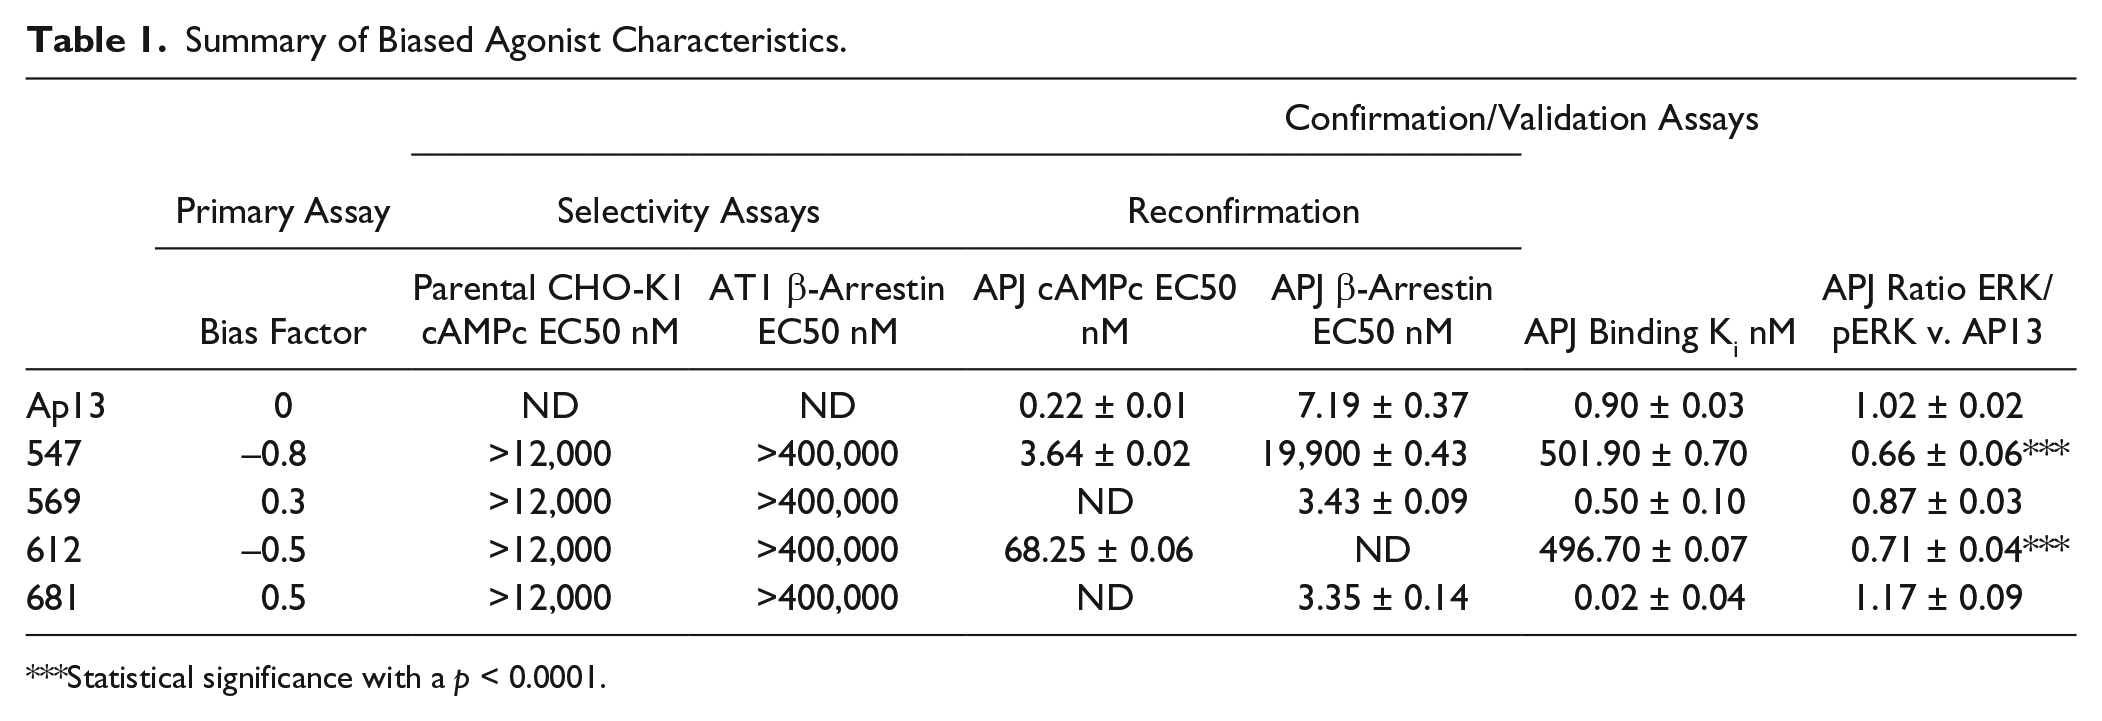
Statistical significance with a p < 0.0001.
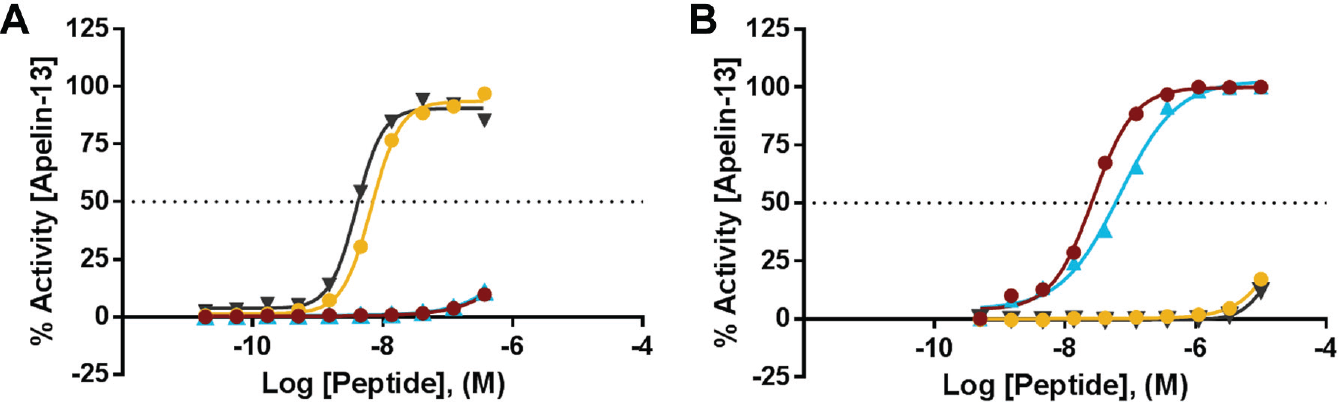
Hit reconfirmation. Compounds selected for advancement were resynthesized as dry powders and subsequently tested in the β-arrestin (
Selectivity of Primary Actives
To assess the selectivity of compounds for APJ across related members of the peptide receptor family, assays were developed for human angiotensin II type 1 receptor (AT1) and the human neurotensin type 1 receptor. The AT1 selectivity assay (PubChem AID 2580) was implemented as an integral part of the hit optimization process. The selectivity data for the four representative compounds obtained are summarized in
Table 1
. Moreover, these peptides also were inactive in parental cells not transfected with the apelin receptor. The full concentration-response data are provided in
ERK1/2 Phosphorylation Pattern Confirms Bias
Apelin13 signaling via the apelin receptor activates ERK1/2 MAPKs21,41,42 via both G-protein–dependent and β-arrestin–dependent signaling pathways. We therefore examined the ERK1/2 activation patterns induced by apelin13 and selected biased agonists identified in the screen using U2OS cells overexpressing AGTRL1 in an HTRF-based sandwich immunoassay. Ap13-mediated ERK1/2 phosphorylation was evident at 5 min and peaked at 15 min (data not shown). At 15 min, Apelin 13 concentration-dependently induced ERK1/2 phosphorylation, yielding an EC50 value of 1 nM. At the same time point, treatment with both SBI-’569 and SBI-’681 stimulated ERK1/2 phosphorylation, whereas treatment with SBI-’612 and SBI-’547 did not, at least at 1 µM ( Fig. 5 ).
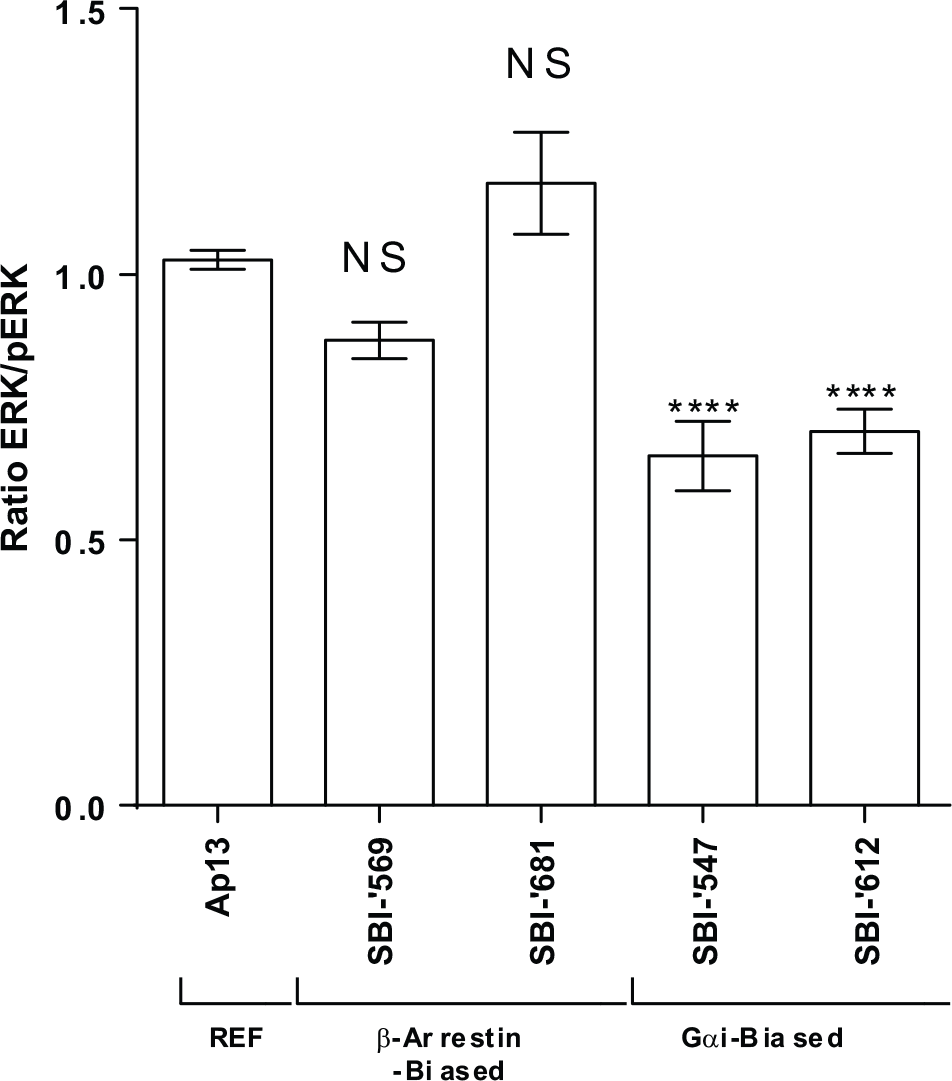
Differential activation of ERK by Ap13 and biased agonists of APJ. Confirmed, biased compounds were tested for their ability to activate ERK. Differences in ERK1/2 phosphorylation were assessed in U2OS cells overexpressing AGTRL1 using a homogeneous time-resolved fluorescence–based immunoassay. Cells were treated with 1 µM of each of the compounds, and the fluorescence resonance energy transfer response was normalized to that induced by 10 nM Ap13. Data are means and SEM from three independent experiments. ****p < 0.0001.
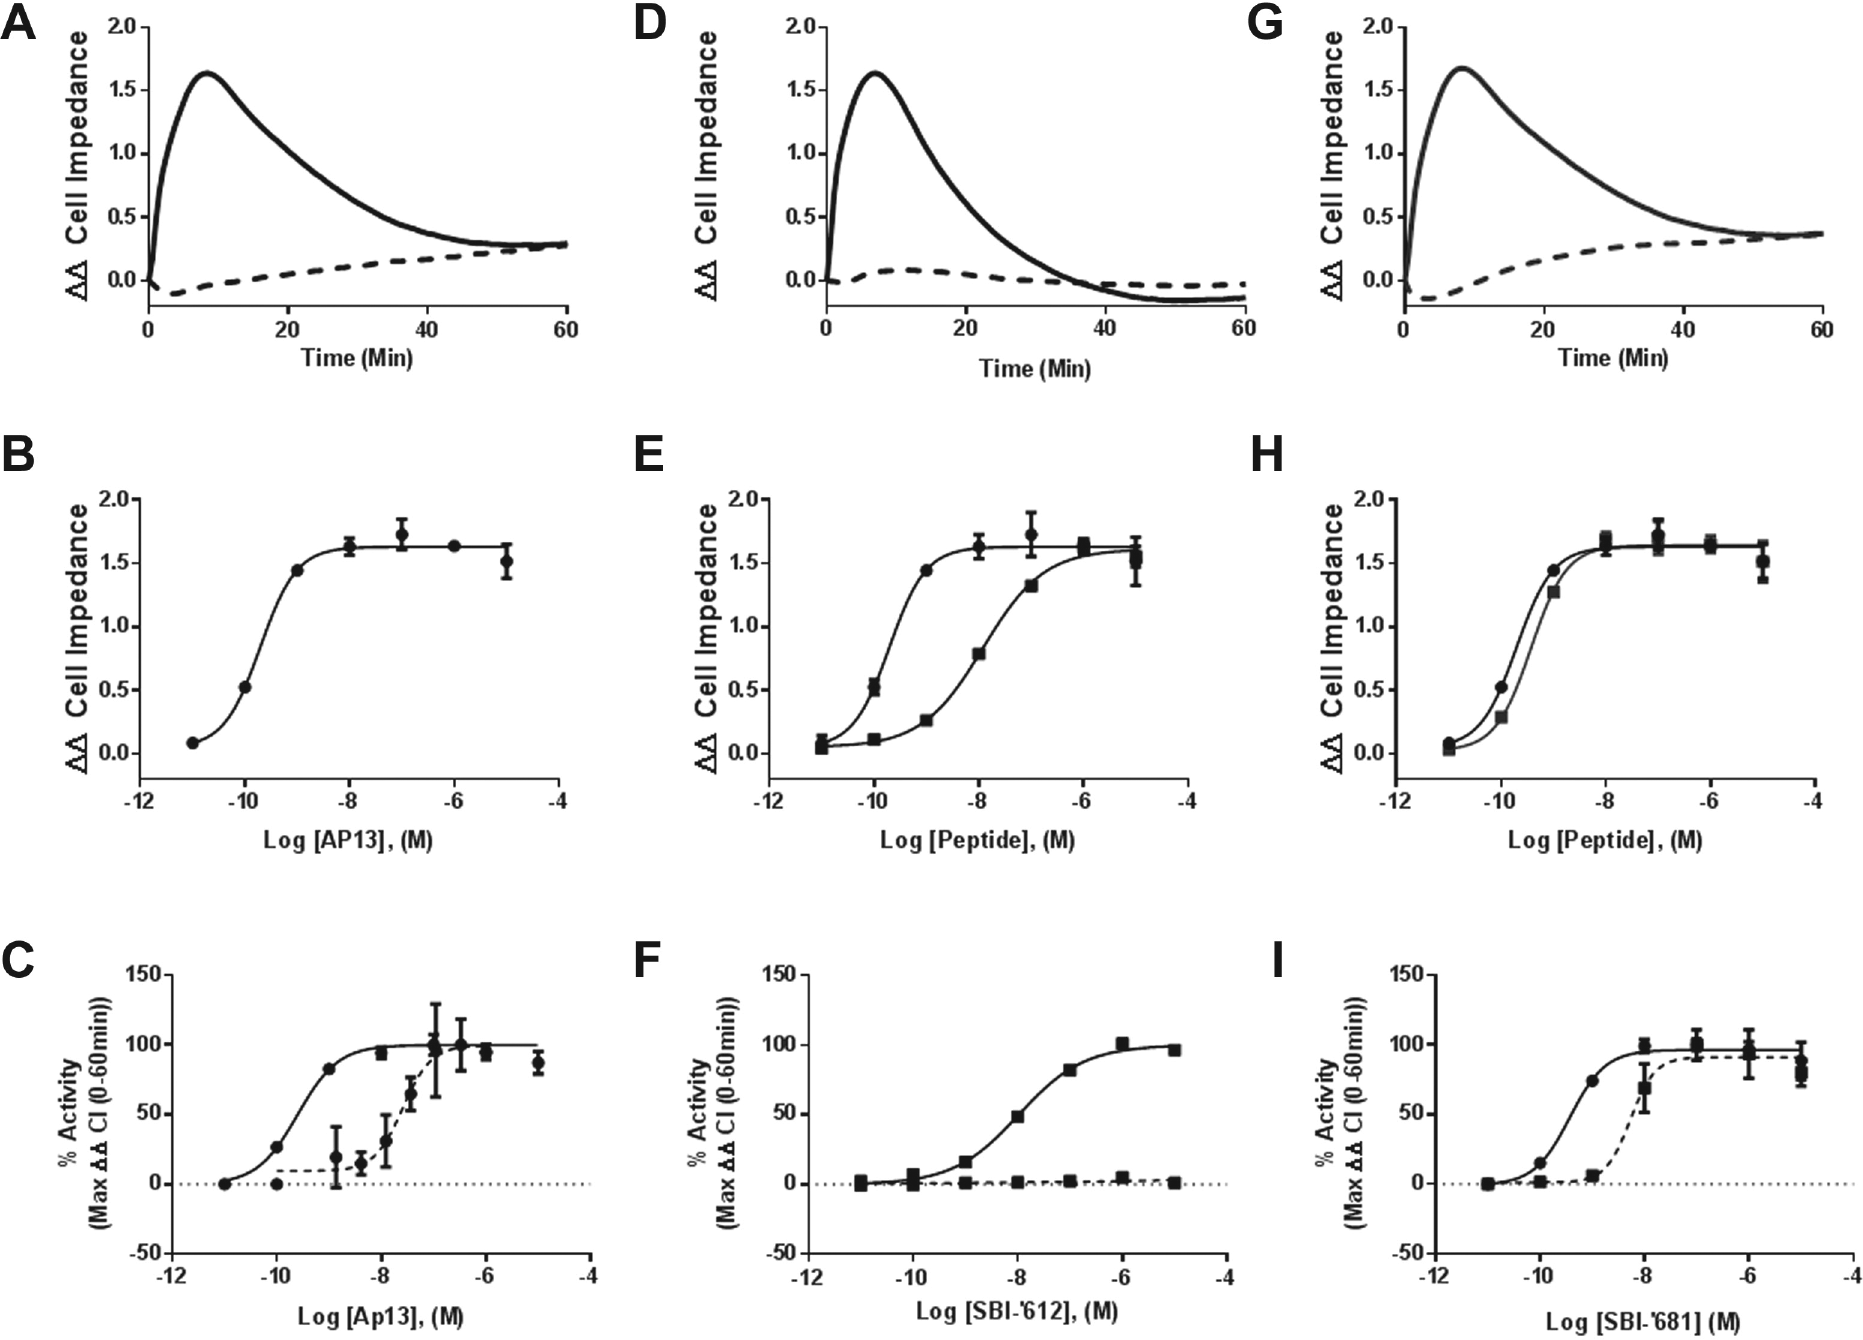
Confirmation of signaling bias via cellular impedance. (
Radioligand Binding
Competition radioligand binding studies were performed to confirm target engagement, APJ affinity, and specificity of the identified biased agonists. SBI-’569 and SBI-’681 decreased binding of [125I]-Glp65, Nle75, Tyr7-Ap13 to membranes expressing human APJ in a concentration-dependent manner, with a calculated Ki that was equivalent to that of the endogenous ligand (cold, unlabeled Ap13,
Table 1
). SBI-’547 and SBI-’612 also effectively competed for binding to APJ but with much lower affinity (
Table 1
;
CI Analysis
The downside of our primary screening platforms is that they do not capture dynamic interactions; measurements are possible only when receptors and β-arrestins are actively engaged or at a single time point of cAMP production. Therefore, we next applied a label-free, real-time analysis of the cellular response to Ap13 and our lead biased agonists. The xCELLigence instrument measures CI to monitor the global cellular response to stimulus and has been used to study 7TMR signaling34,43,44 and to elucidate general mechanisms of drug action. 45 We first performed a comprehensive analysis of the impedance response to Ap13 in CHO-K1 cells overexpressing human APJ (CHO-K1-AGTRL1). Ap13-mediated activation of APJ elicited a concentration-dependent, time-resolved, multifeatured impedance response profile ( Fig. 5 ). Immediately following the addition of ligand, Ap13 elicited a rapid increase in CI response (rapid ascending phase) that peaked at t = 4.0 min and was followed by a sustained response. This response decayed at a slow rate over time (slow descending phase) but did not return to baseline before terminating the experiment at t = 60 min after adding ligand. Successive decreasing concentrations of Ap13 elicited similar response profiles, although the overall magnitude of the response was decreased and the slope of the lines representing the ascending and descending phases of the response were modestly decreased. This response was found to be APJ specific because it was not observed when parental cells lacking the APJ receptor were exposed to Ap13. The increase in CI observed in response to Ap13 is consistent with that of other Gαi-linked 7TMRs. 44 Pretreatment with PTX caused the Ap13-induced rapid ascending phase to be replaced with a transient negative phase that dips below zero before reverting to a positive slope that ultimately becomes a slow ascending phase. It is important to note that the different impedance response profiles obtained in the presence and absence of PTX yielded different maximal CI values and that this is reflective of the maximal response obtained when Gαi-dependent signaling is inhibited by PTX. This difference in maximal response reflects the different features of the response curve obtained under each condition (i.e., positive transients versus negative) and is not necessarily reflective of efficacy. Parental cells lacking APJ showed no response to Ap13 with or without PTX.
Next, we established the impedance response profiles of our biased agonists. SBI-’612 and SBI-’681 elicited CI responses that shared some similarities with that observed in response to Ap13. All three ligands shared the rapid ascending phase, and a peak response of ~1.6 ΔΔCI, immediately following the addition of ligand. For SBI-’612, this response was transient. And unlike Ap13 and SBI-’681, SBI-’612 did not elicit a plateau phase. Instead, the rapid ascending phase was followed by a rapid decay phase that returned to baseline by t = 30 min. Pretreatment with PTX completely eliminated the CI response to SBI-’612. In contrast, SBI-’681 showed an almost superimposable impedance profile to Ap13, in the presence and absence of PTX ( Fig. 5 ). Both SBI-’612 and SBI-’681 elicited a similar concentration-dependent change in peak impedance as Ap13, but SBI-’612 was less potent.
Discussion
Apelin is a potent inotropic agent, with significant effects on in vitro human heart assays as well as cardiac contractility in vivo, including animal models of ischemic cardiomyopathy and myocardial injury. 46 Apelin agonists could therefore potentially help patients with ventricular failure secondary to pulmonary hypertension by decreasing pulmonary vascular resistance and improving cardiac output, as shown for heart failure patients treated systemically with [Pyr1]apelin-1323 or clinically for apelin-biased ligands. 29
We hypothesized that ligands at the apelin receptor designed to display bias toward either the G-protein pathway or β-arrestin could produce favorable clinical outcomes (e.g., for G-protein–biased ligands, improved vasodilatation and increased cardiac output with less desensitization, or for improved apelin-dependent angiogenesis induced by ligands that stimulate β-arrestin). However, we first had to determine a strategy for identifying these biased ligands using an in vitro screening approach.
To achieve this goal, we developed and miniaturized a series of cellular assays of APJ function and conducted a series of high-throughput assays in parallel to screen a proprietary library of modified apelin peptides. Briefly, ~500 “apelin-like” peptides were screened for their ability to selectively activate discrete APJ signaling pathways. All peptides were tested in 10-point concentration-response curves. The screen was robust, with each assay exhibiting a strong Z′ value of 0.6 to 0.7 and an average signal-to-noise ratio >8. Using this quantitative HTS approach, we identified 36 potentially biased agonists (a hit rate of ~7%). This high hit rate is reflective of the peptides within the library screened and not likely to be indicative of the potential hit rate observed from a collection of small molecules or unrelated peptides. Ultimately, from this effort, we identified and confirmed biased agonism of two peptides displaying bias toward G-protein–dependent APJ signaling and two peptides displaying bias toward β-arrestin–dependent APJ signaling. The identification of novel biased agonists of APJ using this approach is proof of concept of our systematic approach to the discovery of biased ligands in early stages of the drug discovery process and suggests that it is likely universally applicable to the search for biased agonists of other peptide 7TMRs. Further, these biased agonists will be useful tools to probe the function and pharmacology of apelin in normal physiology and disease, as well as to validate APJ as a therapeutic target deserving of further drug discovery efforts.
The hypothesis that biased agonists of APJ will have significant therapeutic potential over neutral agonists was recently confirmed in a paper that was published during the preparation of this article. CMF-019 is a small-molecule agonist of the apelin receptor that serendipitously displays G-protein bias at APJ. CMF-019 improved cardiac contractility in vivo. 30 Those observations demonstrate the value that our systematic approach to the discovery of biased agonists can have in the early drug discovery process. The discovery, synthesis, and characterization of CMF-019 was likely an expensive and time-consuming process. Although those efforts, and others, ultimately validated APJ as a drug target for the treatment of heart failure, the biased signaling that presumably is essential for the observed improved cardiac function was a serendipitous characteristic of CMF-019. It was not deliberately produced through iterative medicinal chemistry efforts to determine the structure-activity relationship of the compound. Our screen identified APJ agonists biased against both G-protein and β-arrestin signaling that can readily be used to validate APJ as a drug target for heart failure but also to understand, at least in part, the exact signaling mechanisms that need to be activated to improve cardiac inotropy.
Ligand bias may be a general strategy that can dissect the biology of GPCRs as both research tools and investigational new drugs.47,48 This has important implications for GPCR-targeted drug discovery as the optimal evaluation of GPCR ligands requiring characterization across a range of signal transduction pathways, linking the resulting profiles to the relevant pathophysiological setting. The findings presented here demonstrate successful identification of biased ligands with unique pharmacology. Such biased ligands allow an unprecedented level of control of receptor functions, enabling both basic research into GPCR signal transduction mechanisms and potential development of safer, more efficacious therapeutics.
As with any paradigm-shifting discovery, advances have been fitful and required progress on multiple fronts, from developing tools to dissect receptor signaling to identifying biased ligands to appreciating unmet medical need that aligns with pharmacological profiles that a biased ligand might deliver. A particular problem confronting the field is the absence of simple criteria to determine when a ligand is intrinsically biased, functionally selective in meaningful settings, or merely selective only in the model system undergoing investigation but completely undifferentiated in more physiologically relevant settings. In addition, there are still relatively few well-characterized examples of pathway validation. As the concept of biased ligands progresses, we expect further validation of these pathways, particularly for challenging GPCR targets with potentially beneficial effects but significant issues as drug development targets because of on-target adverse events. Further work to establish the functional selectivity and ligand bias could improve the attractiveness of these targets for drug discovery. Final acceptance of this concept, however, will likely require further clinical validation of intentionally selected biased ligands (i.e., that are pharmacologically distinct from a balanced ligand but offer therapeutic benefit). Biased ligands may deliver differentiated therapeutics at validated targets but also require an understanding of which pathways to target. Here, we describe a strategy for identifying molecules to add to the “toolbox” for measuring the physiological impact of these biased ligand strategies.
We designed our primary screen for β-arrestin to identify the pharmacology of drug-induced β-arrestin interactions. The platform benefits from using a stable indicator (meaning that assay timing is more flexible) and does not require specialized equipment for processing. However, these platforms are optimized for the detection of “hits” and may not reflect the physiological function or interaction of the receptor. For example, we used 1.5 h incubation with agonist prior to substrate addition. Because most GPCRs have engaged in endocytic pathways, and because class A receptors (such as opioid receptors, adrenergic receptors, dopamine receptors, etc.) do not maintain the association with β-arrestin2 during the internalization process, we would detect only the β-arrestin2 interaction within the receptor population that is maintained from the moment the substrate is added, potentially underestimating the degree of activation of this population. Receptor down-regulation may also occur during agonist incubation. Similarly, the cAMP assays are measured at a single time point that reflects a mix of activation, desensitization, and other regulatory mechanisms, and neither assay may be useful to understand these temporal changes. To overcome these limitations, we used a label-free impedance assay to allow us to explore temporal differences in the ligand responses. Finally, we validated hits with a downstream functional assay (ERK signaling) and radioligand binding, which showed the selectivity of the ligands we identified. As discussed above, it is important to translate the biases of the compounds identified in this approach into more physiologically relevant systems. The current screening strategy uses existing heterologous overexpression systems to probe APJ function. Thus, the observed biased agonism of our hits may not extend to other cell types or be recapitulated in vivo. Future efforts will apply the biased agonists of APJ reported here to animal models to test this hypothesis.
In conclusion, we have demonstrated that parallel screening of receptor response at both G-protein and β-arrestin signaling pathways, followed by label-free impedance assays, is a productive approach to the identification of biased agonists.
Footnotes
Acknowledgements
We wish to thank Dr. Michel Bouvier and Dr. Ray Price for valuable discussions and commentary. We thank Sarah Lardizabal for administrative and artistic assistance in preparation of the article and figures.
Declaration of Conflicting Interests
The authors declared no potential conflicts of interest with respect to the research, authorship, and/or publication of this article.
Funding
The authors disclosed receipt of the following financial support for the research, authorship, and/or publication of this article: This work is supported in part by a Novo Nordisk Diabetes Innovation Award (187852), National Institutes of Health grant (R21 NS059422), and the Florida Translational Research Program (FL DOH COHK8).
References
Supplementary Material
Please find the following supplemental material available below.
For Open Access articles published under a Creative Commons License, all supplemental material carries the same license as the article it is associated with.
For non-Open Access articles published, all supplemental material carries a non-exclusive license, and permission requests for re-use of supplemental material or any part of supplemental material shall be sent directly to the copyright owner as specified in the copyright notice associated with the article.