
Abstract
Humans produce different rates of sweating depending on the intensity level of a given activity. The clothing worn during the activity has a significant effect on the latent heat loss that can occur before, during, and after the activity. The water adsorption and spreading properties of a material yield differences in the amount of heat exchange that can occur between the person and the environment. Current test methods evaluate this using a value known as evaporative resistance, which is used to determine the heat exchange potential of a material. However, this value is only taken once the material has reached “steady state” and does not consider the sweating period before steady state is reached, or the drying period after steady state is reached. Therefore, an area under the curve (AUC) value was derived during these periods to compare the heat exchange properties of different materials. A sweating guarded hot plate was used to simulate different sweat rates, and therefore activity levels, to compare materials constructed of cotton, viscose, polyester, and wool. The overall latent heat loss of the hydrophobic wool was much less compared to the other samples with a gentler slope and lower AUC values than the other samples. It was found that the segment of time analyzed has a significant impact on the conclusion drawn about the latent heat loss of a material, p < 0.0001. Sweat rate also has a significant impact on the heat loss value, p < 0.0001, but is perhaps less useful when comparing samples to each other. It was found that comparing the different periods of the test could yield different conclusions when comparing materials for latent heat loss. Several current test methods do not consider phases outside of the steady state period and therefore miss valuable information pertinent to user comfort during these phases, especially in the post-exercise phase.
Introduction
Different activities yield physiological reactions and are influenced by the clothing worn by the user, which together play a significant role in determining the thermal comfort of the system in the given environment. 1 However, people generally do not stay in stable, non-changing conditions for long periods of time. For example, in the post-exercise period, a garment with accumulated sweat can result in an undesirable post-exercise chill, which causes discomfort. This effect can be especially unpleasant in cooler environments. 2 In “stop–go” sports where there is repetitive cycle of active and rest phases, such as rock climbing or cycling, this can lead to several periods of discomfort during the entire duration of the activity. Various ISO and ASTM standard test methods utilize apparatuses such as the sweating thermal manikin and sweating guarded hot plate to better understand the impact of garments on thermoregulation in humans3,4 These procedures are useful in determining the thermal impact of textiles in different applications, such as sports and leisure 5 or personal protective equipment. 6 These test methods, such as the one for evaporative resistance (Ret), have been developed to accurately measure the steady state of heat and moisture vapor transport using a semi-permeable membrane between the sample and plate surface. They do not consider the behavior of the materials before or after steady state is achieved, nor do the Ret tests consider the combined liquid and vapor transport effects in fabrics. Therefore, Ret values taken from these tests neglect the sweating during the initial exercise period and the subsequent effects during the post-exercise phase. Oswald and DenHartog 7 addressed some of these concerns in a modified testing protocol that evaluated transient heat loss on a sweating guarded hot plate. They found their method to better assess the effect of fabric liquid transport and adsorption on heat loss. 7
The sweating guarded hot plate and sweating thermal manikin both are both used to evaluate the heat exchange properties of textiles. 8 Sweating thermal manikins imitate the shape of the human body and give a comparison of heat exchange, more so than other testing methods. 9 However, standard test methods, such as ASTM F1291 10 and ISO 15831, 11 utilize a membrane to simulate human skin and spread the liquid sweat across the fabric. This results in the fabric wicking properties being of less effect as the membrane is between the sample and the surface; this interferes with the inherent liquid adsorption and transport properties of the fabric. Alternatively, standard test methods using a sweating guarded hot plate can be used to evaluate the thermal properties of textile materials, such as ASTM F1868 12 or ISO 11092. 13 They are able to simulate sweating through water secretion via the pores on the surface of the apparatus. During the process of sweating, the apparatus uses power to maintain a temperature of 35°C, which is approximately the temperature of human skin. 14 These test methods also yield an evaporative resistance value, Ret, which is a representation of the average latent heat loss once the sample reaches steady state. However, none of the test standards account for the behavior during the entire sweating period before steady state is reached or during the drying period after the sweating has ceased. DIN SPEC 60015 is a test method that uses a similar apparatus and procedure to ASTM F1868 and ISO 11092, but reports values derived from the entire sweating and drying period. 15 The procedure in this study follows a similar ideology to Oswald and DenHartog 7 and DIN SPEC 60015 but, as the test apparatus described in the DIN method wasn’t available for use at the time, the test method could not be followed verbatim. In addition, the “activity phases” were only performed once, due to available resources, but the whole procedure could be adjusted to include several repetitions to simulate unique activity cycles, such as “stop–go” sports.
Methods
Five fabrics were tested on the sweating guarded hot plate (Thermetrics, Seattle, WA, USA) at North Carolina State University. The ambient conditions of the test chamber were 21°C and 65% relative humidity. Table 1 summarizes the characteristics of the fabrics and sample code. Samples of cotton, viscose, polyester, and wool were selected for their differences in perceived cooling properties. The sample was placed on top of the sweating guarded hot plate, which is heated to 35°C. The hot plate measures how much power is needed to maintain the plate surface at 35°C as well as the heat that is released from (or added to) the plate and expresses its test results as heat flux in W/m2. Materials that promote heat loss to the environment will generate a higher high flux value as the hot plate will require more power to maintain the surface temperature of 35°C. The inverse is true for materials that inhibit heat loss to the environment. In these tests, water is secreted through the “sweat pores” in the plate itself. In these experiments, there is no semi-permeable barrier between the plate and the fabric and thus the water is allowed to spread in and around as well as be absorbed by the fabric and will evaporate from the plate and/or the fabric. The resultant value is in the same units (W/m2) but is a culmination of latent (evaporative) heat transfer in addition to dry heat transfer.
Sample characteristics.
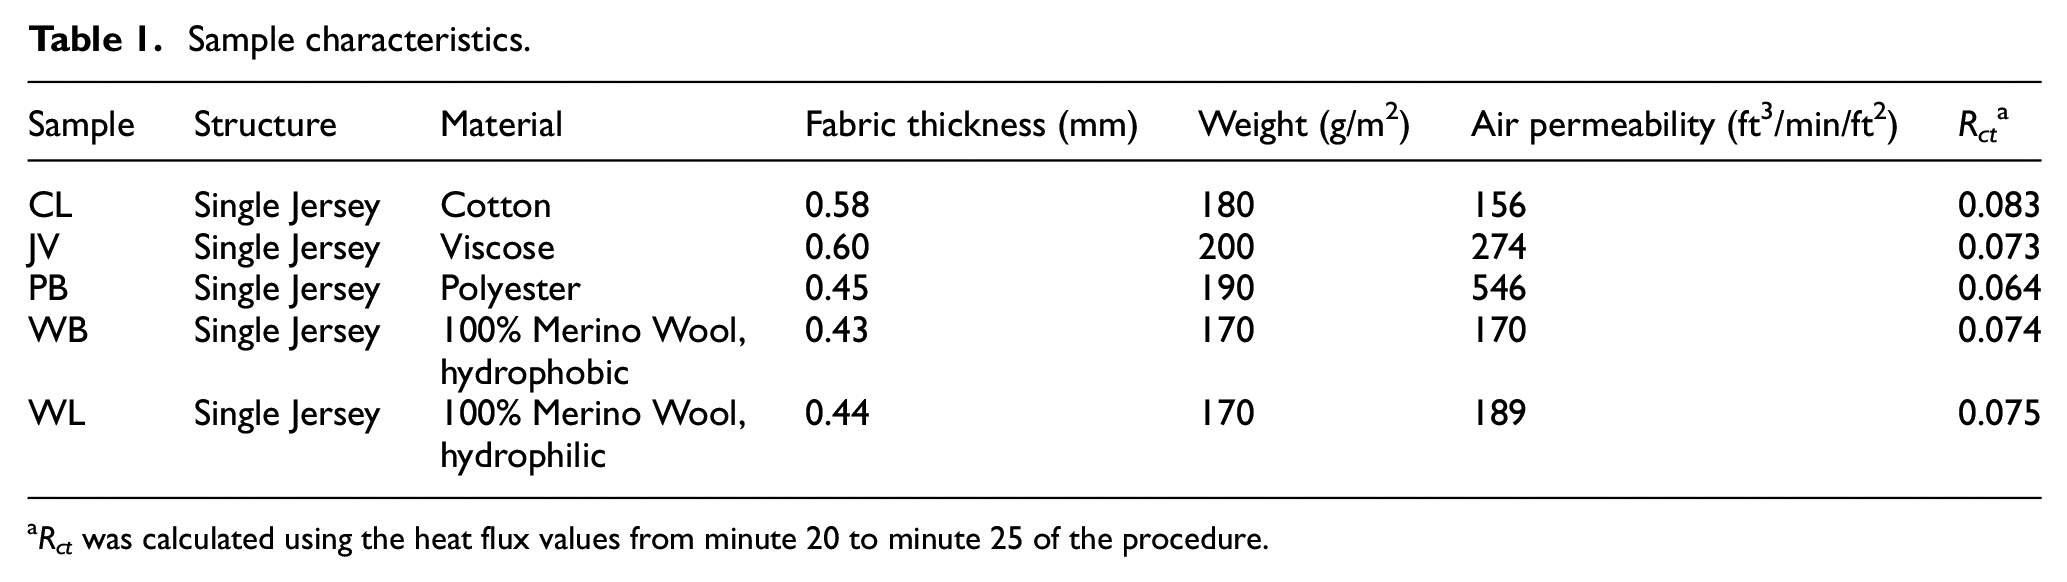
Rct was calculated using the heat flux values from minute 20 to minute 25 of the procedure.
The test consisted of a 30 min dry period, followed by a 30 min sweating period, and finally a drying period. The length of the drying period was dependent on the drying rate of the material being tested and typically lasted from about 30 to 60 min. Materials that returned to their dry state quicker after the sweating ceased, such as the polyester, would have a shorter total test time than materials that took longer to return to their dry state. Three replicates of each combination were performed. The area under the curve (AUC) of the materials was then calculated using the open source software R. The AUC was calculated by subtracting the baseline (Dry) heat loss from all results. The baseline was determined in minute 20 to minute 25, prior to the sweating, while stable heat flux occurred. Equation (1) defines how the adjusted heat flux values were calculated

where Yi* = adjusted heat flux values, Yi = original heat flux values, x = time in minutes, and n = number of items in sample.
A few different regions of the heat flux curves during and after sweating were analyzed: the sweating phase (minutes 30–60), the first 30 min of the drying phase (minutes 60–90), and from the beginning of the test until the material returned to its original dry-state heat flux value (variable), These periods are referred to as sweat, drying, and total, respectively. The AUC was assumed to be the total evaporative cooling energy that occurred during the entire sweat period until the material reached the initial dry condition again. Two different conditions were explored: a sweat rate (SR) of 550 g/m2/h and an SR of 200 g/m2/h; both conditions were exposed to a 1.0 m/s wind speed. All results shown below are the averages of the three replicates tested.
Statistical Analysis
SAS software, JMP Pro 17, was used to compare the area AUC values from the samples. The parent effects were considered to be sample, SR, and the period during which the AUC value was calculated (sweat, drying, or total portions of the test). Ad hoc analysis was conducted using Tukey’s honestly significant difference (HSD) to determine where the differences in the levels were occurring. Results were considered significant at an alpha of 0.05.
Results and Discussion
Figure 1 demonstrates the results of sweating hot plate hot plate trials at 200 and 550 g/m2/h. Figure 2 shows the adjustment of these graphs using equation (1) in order to isolate the effect of latent heat loss.
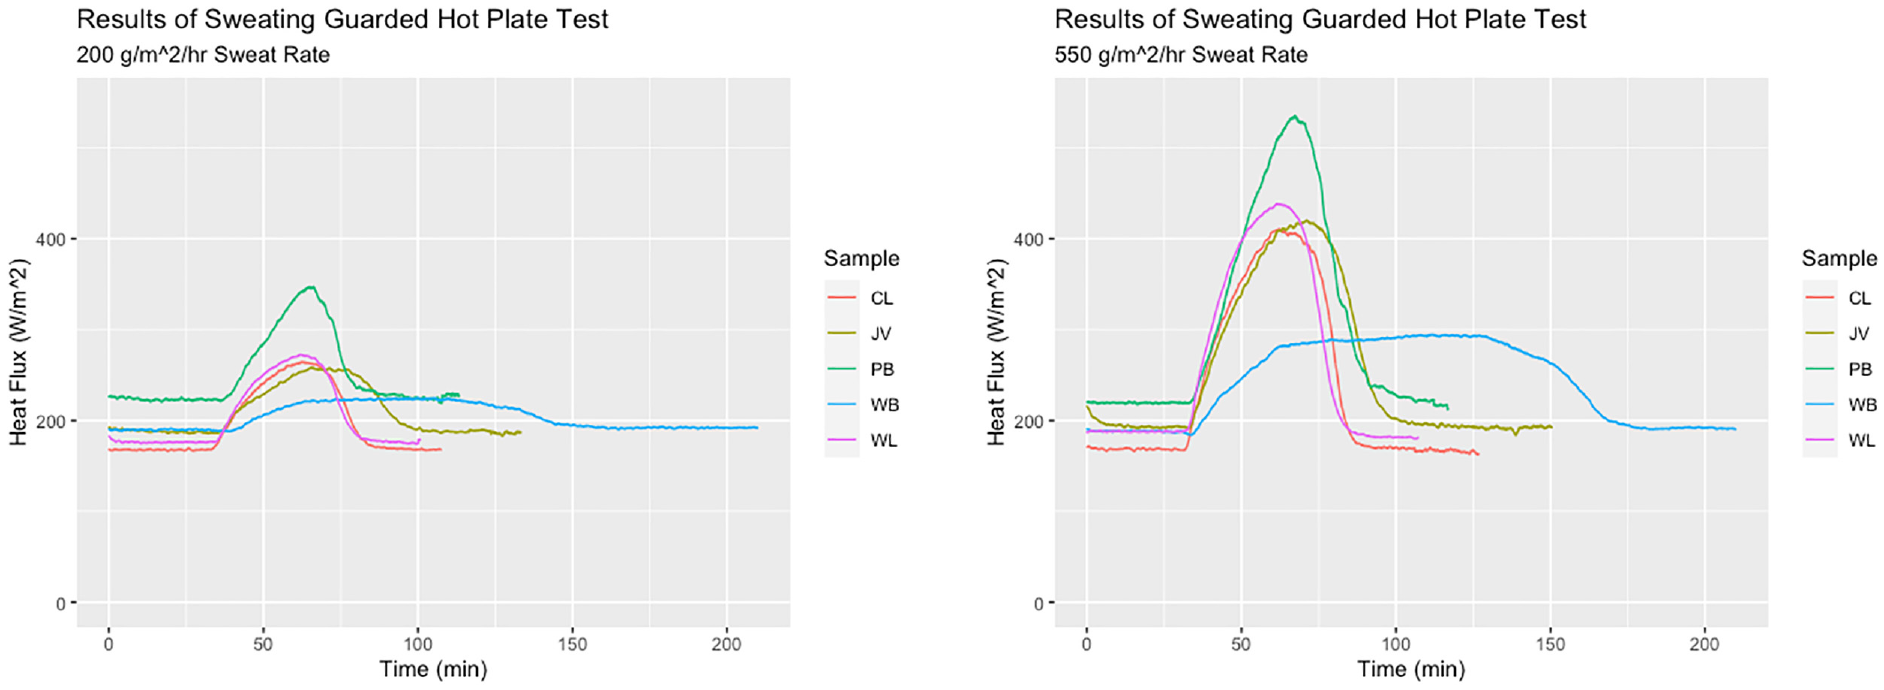
Results of the sweating hot plate trials at 200 g/m2/h (left) and 550 g/m2/h (right).
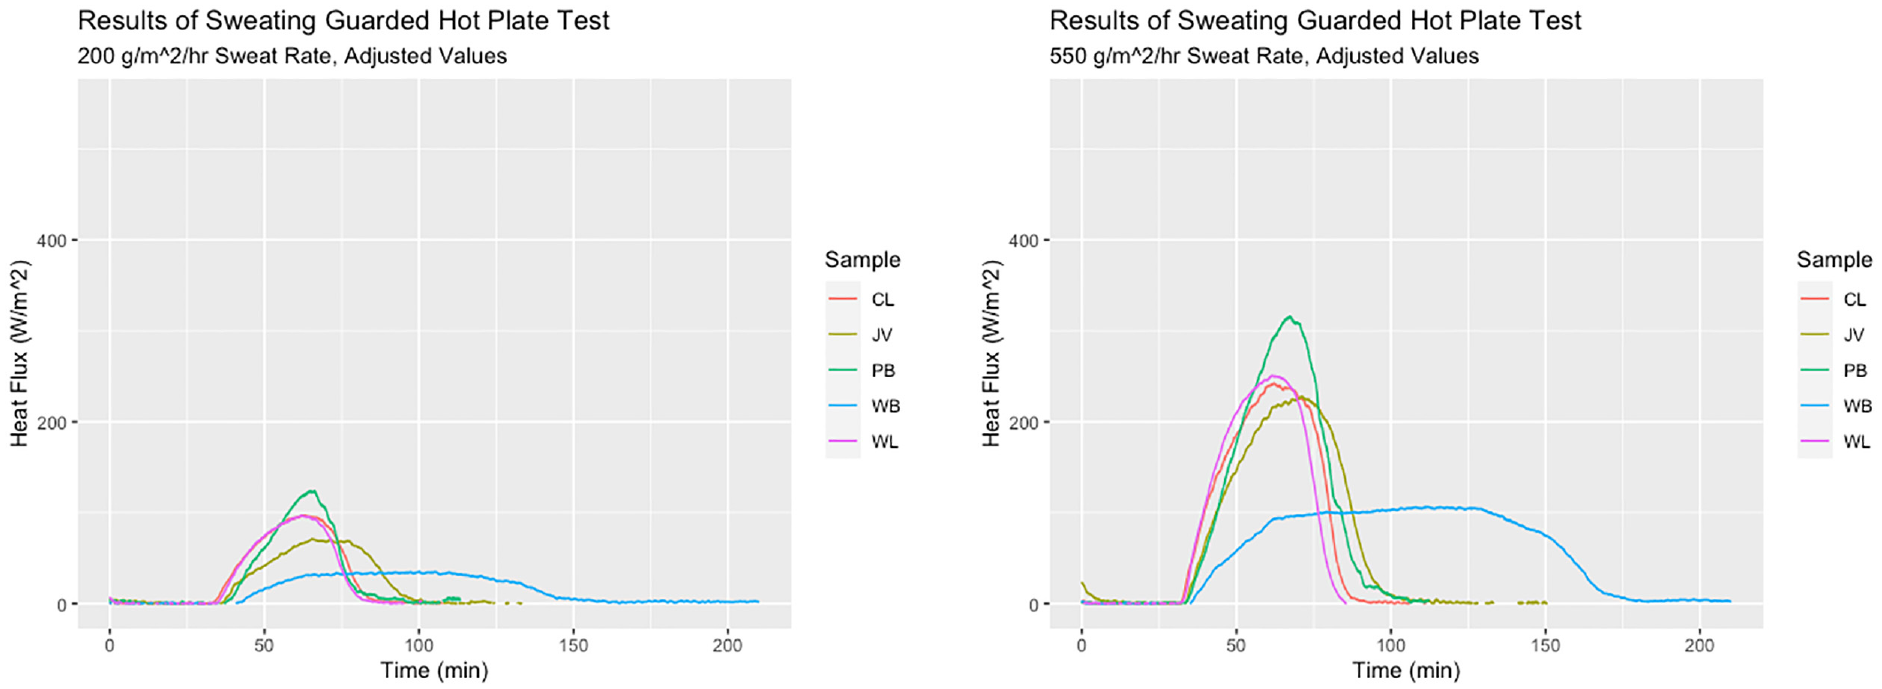
Normalized graphs of sweating hot plate trials using equation (1), 200 g/m2/h (left) and 550 g/m2/h (right).
It can be seen from Figures 1 and 2 that most materials had similar total test times (namely in terms of the final drying period), but WB tended to have a longer total test time than any of the other materials. By comparing only a 30 min segment after the sweating ceased, this prevents the long test time of WB from skewing the AUC values for the drying period. In test methods such as ASTM F3628, the entire drying phase after sweating is considered for the test results. But samples such as WB showed that this approach can result in misleading interpretations during this phase of the test. It was observed that regardless of the SR, the general slope and relative differences between heat flux profiles of the materials remained similar. That is to say sample PB consistently yielded the highest heat flux values during the sweating period while sample WB demonstrated the lowest heat flux values. The Rct value, taken during the initial dry period for steady state to be reached, did not appear to have much influence on the latent cooling potential of the samples relative to each other. For example, in Figure 2, CL did have a higher Rct value than WB, but this did not result in a higher peak heat flux value during the sweating phase. Therefore, the adjustment is helpful in minimizing the influence of the starting heat flux values during the first 30 min of the procedure. Figures 3 and 4 show the AUC (“cooling”) results of each sample at the various test periods for the 550 g/m2/h and 200 g/m2/h SR, respectively, after the adjustment using equation (1) was made.
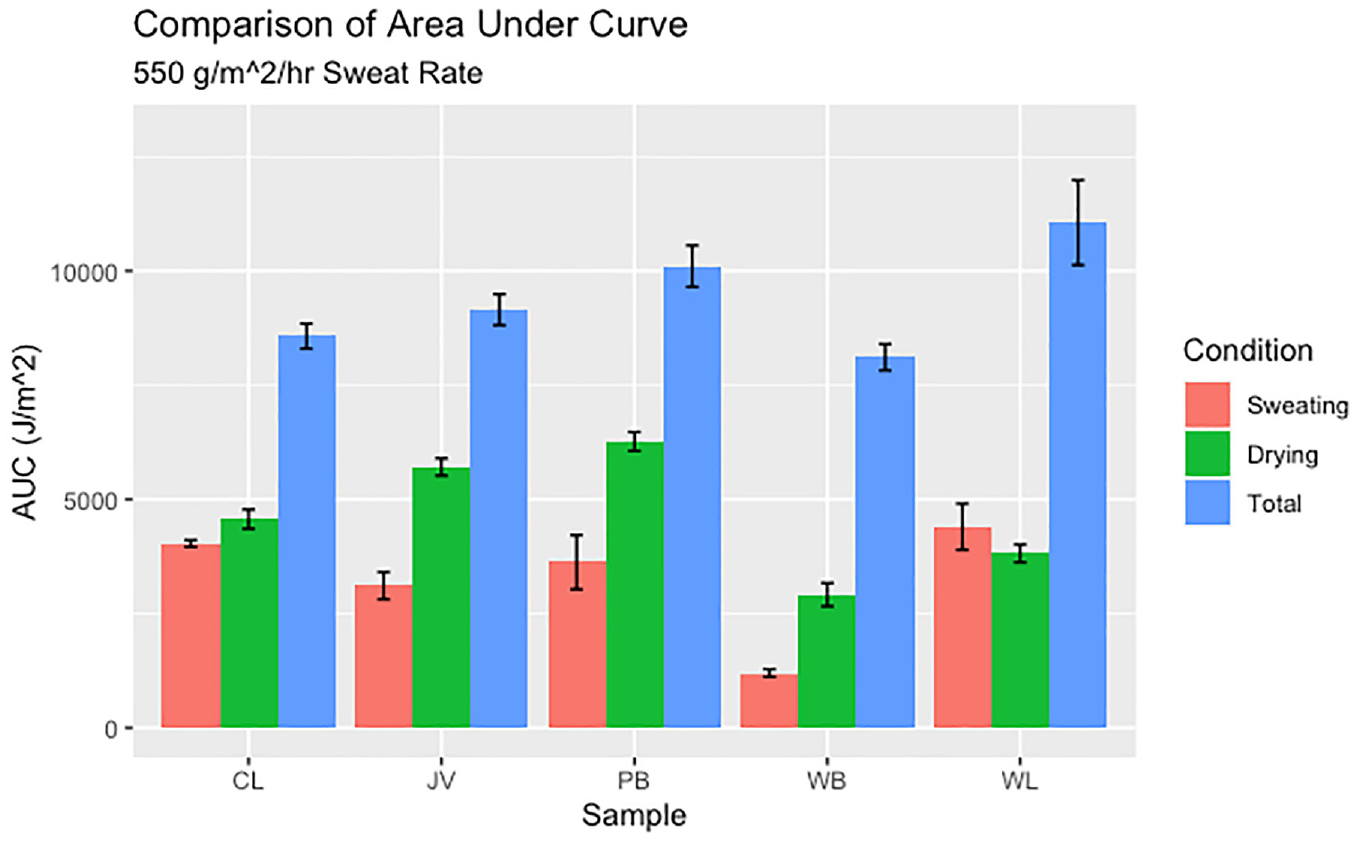
Comparison of AUC values for all samples and test periods at 550 g/m2/h sweat rate, error bars are 95% confidence intervals.
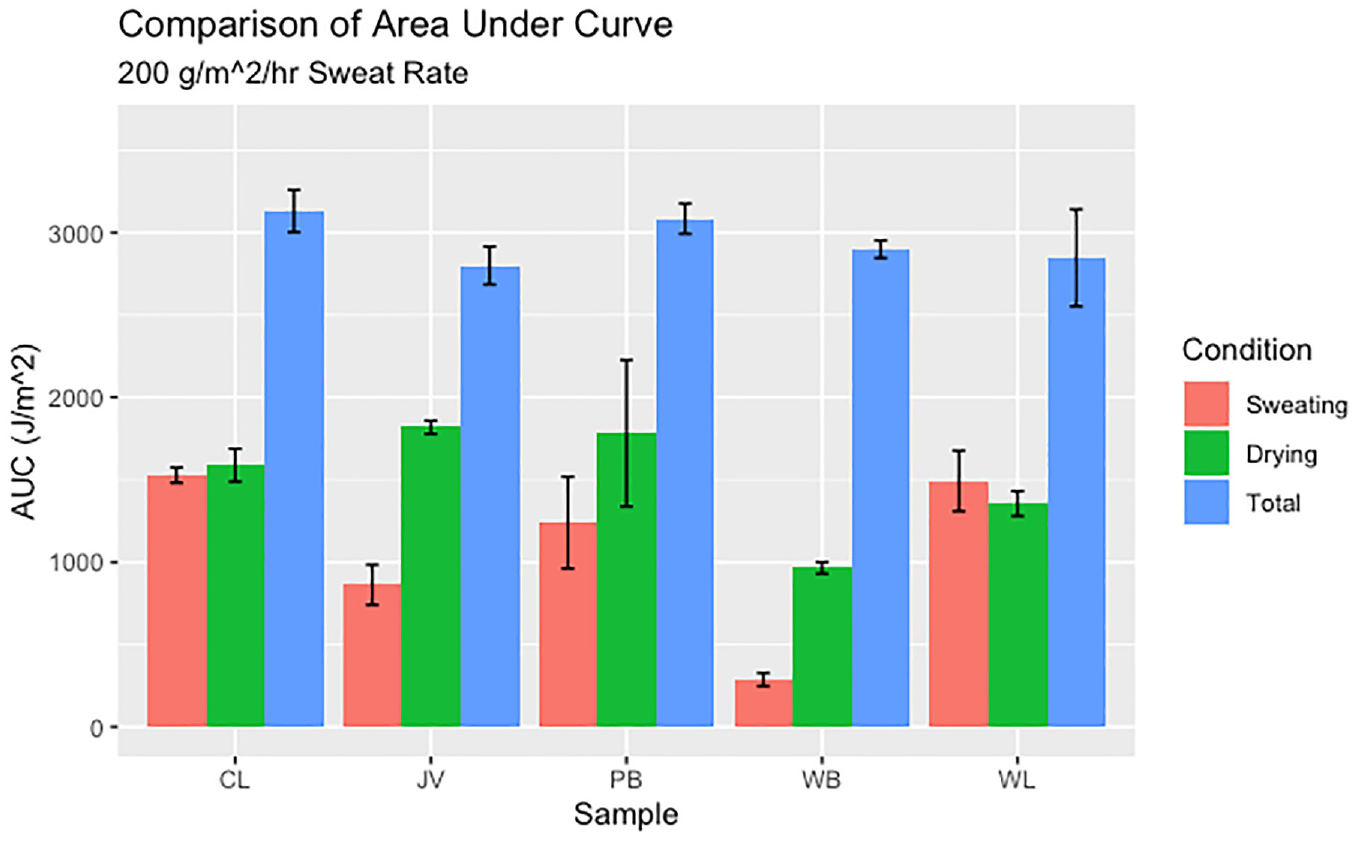
Comparison of AUC values for all samples and test periods at 200 g/m2/h sweat rate, error bars are 95% confidence intervals.
Figures 3 and 4 show that for most materials the drying period, minutes 60–90, tended to have a higher average AUC value than the sweating period (minutes 30-60), with the exception of sample WL at both SRs. This could be the result of high variation during the sweating period or an inherent limitation of the procedure. It could also be that sample WL has exceptional wicking properties but does not dry quite as quickly as the other samples after the sweating period ends. This does not quite coincide with the PB properties, however, that show better wicking as well as higher peak heat loss, which is also associated with better wicking. In all we do not yet have a clear explanation for why the WL AUC results were highest in the first phase. The hygroscopic and moisture retention properties of wool may also explain these observations. If the test were to be conducted for longer, different slopes and AUC values may have been observed in the samples relative to each other. The different curves in Figures 1 and 2 show that sample WB takes much longer to absorb and spread the water, due to the hydrophobic nature of the fabric. This leads to the highest discrepancies between the sweat and dry period bars in Figures 3 and 4. However, the AUC values during the sweating phase could be indicative of which material would provide the most cooling during the initial phases of activity, which may be more relevant in high heat conditions. Sample CL was the most balanced in terms of AUC during the sweat period versus the dry period at both SRs, most likely due to the fast water take-up and spreading of cotton, but seemingly less spreading than the PB sample. WB had the largest differences between these periods, likely due the inverse characteristic of slow water take-up by the hydrophobic wool material, potentially combined with exothermal effects due to its hygroscopic effect. 3 WL was a hydrophilic wool and therefore did not exhibit this large difference between the sweating and drying periods. WL and CL had the highest AUC values during the sweating period, which is likely due to the hydrophilic properties of these materials. However, the viscose and polyester had the highest AUC values during the drying period, which would suggest that they would experience the highest chill effects.
In Figure 1, sample PB has higher heat flux values than the other samples. This may indicate that there is a limit to the maximum heat loss and the method might be limited for high cooling fabrics during the sweating phase. This could be due to slightly better wicking properties of these materials, allowing for a larger area of the fabric to evaporate the water from the plate, that is, these fabrics may still be wicking the available water during the drying phase, increasing the evaporation area and this overall cooling. WB had the lowest AUC values in both periods likely due to the hydrophobicity of the sample blocking water absorption and therefore lowering the latent heat loss potential.
Interestingly, the general magnitude of differences between the AUC values did not vary much between the SRs. While the absolute values are clearly different, the trends between the materials tend to remain the same. This indicates that different SRs are not necessarily more informative when comparing samples to gauge relative cooling performance between materials. It would perhaps be more advantageous to increase the sample number as opposed to increasing the SR conditions, especially as there was a series of tests conducted at an SR of 1100 g/m2/h, but water began seeping out of the test area, which therefore yielded variable and unreliable results; for this reason, they were excluded. It is also possible that at very low SRs the volume of water would be insufficient to observe differences between samples.
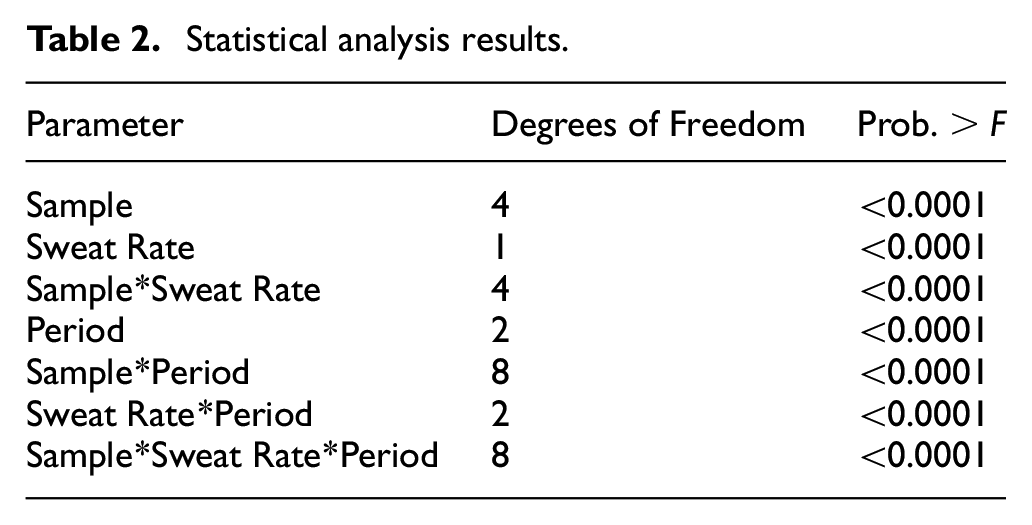
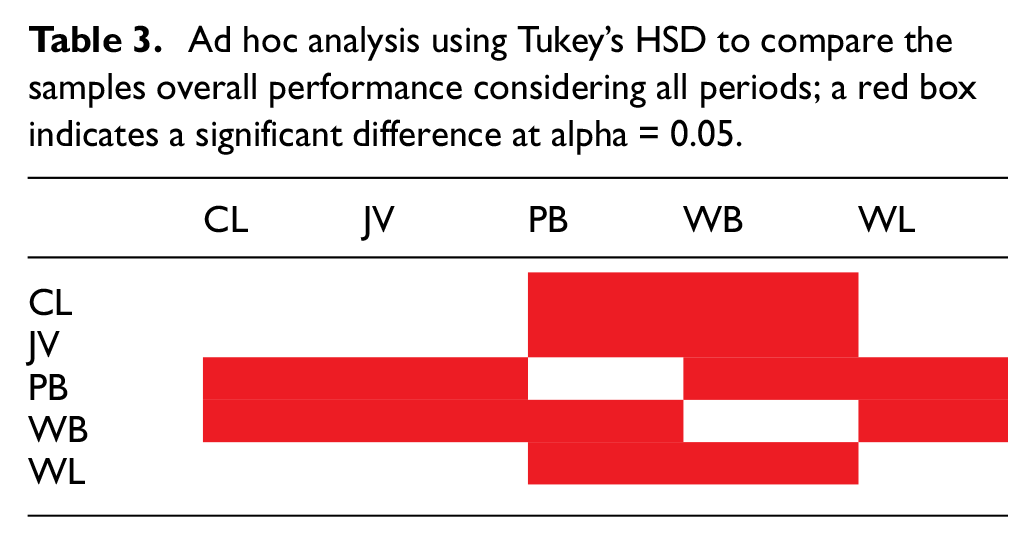
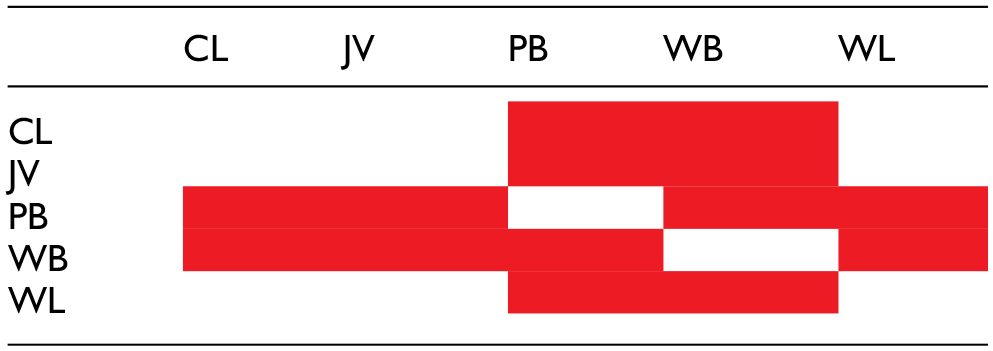
Table 2 demonstrates that the parameters, sample, period, and SR all have a significant effect on the resultant AUC value, all with test statistic values <0.0001. Furthermore, two-way and three-way interactions were also observed at the same level of significance. The SR effect is not of much interest in these interactions, as it is known that a higher SR is going to lead to more latent heat loss. Therefore, not much value is added other than confirming that the SRs do have an effect on the AUC values. However, it is relevant that period had a significant effect as well. This indicates that depending on which period is being observed, different conclusions may be drawn from the results. This echoes the points made from observing Figures 3 and 4, that looking at the different segments of the test affects the conclusion. In Table 2, the Sample × Period interaction specifically indicates that the segment being analyzed can influence the conclusion about the AUC value. Table 3 demonstrates the statistically significant differences found between the samples. WB was different from all other samples, due to the hydrophobic nature of the material and the resultant curve being much different than the other samples. Likewise sample PB was different from all the samples as well, likely due to the superior liquid water wicking capabilities of polyester which led to high heat flux values in this kind of test setup. Otherwise the performances of WL, JV, and CL were all quite similar to each other when considering the experiment as a whole.
Statistical analysis results.
Ad hoc analysis using Tukey’s HSD to compare the samples overall performance considering all periods; a red box indicates a significant difference at alpha = 0.05.
Overall, the results show that in cool conditions, only considering the sweating period is not necessarily representative of the different phases of exercise and how sweat interacts with clothing to provide cooling. Especially during the post-exercise period, which is not separately evaluated in some currently proposed ISO and ASTM tests, the DIN SPEC test analyzes in a slightly different way. In a hot climate sample PB or CL would likely be the material of choice based on the cooling during the sweating period but may result in some discomfort post-exercise due to the “after-chill” (drying period). This could vary based on the preference of the person. However, in cooler climates, the after-chill would be more undesirable, and thus, sample WB would be the superior choice for reduced after-chill effects, at least for a period up to 30 min. Therefore, the climate of the intended end use should be considered when evaluating the after-chill period. For “stop–go” activities in cool climates, a lower after-chill effect would likely be much more desirable to reduce the cold sensation and discomfort experienced by the wearer. In hot climates, the after-chill may be preferred to be higher to help alleviate the heat buildup of the user. It has also been found in previous experiments 3 that human subjects were not able to detect differences between clothing material during exercise as the psychological effect of the activity can outweigh the physical perception. But in the post-exercise period, the effect of the clothing became more apparent as mental engagement was no longer a factor. In these cases, the reduced after-chill may actually be of benefit both practically and psychologically. Regardless, the effect of clothing during the post-exercise period is valuable information that should be considered when comparing materials.
Conclusion
These experiments demonstrated that considering the entire duration of a sweat period and portion of a dry period can have a strong influence on the comparisons between materials for their latent cooling ability. Materials that have quick water uptake and spreading show less of a difference between the sweating period and drying period than materials that are slower to absorb and spread water, based on the samples tested. Wicking data would perhaps aid to explain the results, but numerous wicking tests exist and correlating the most appropriate test for these results would be a subsequent project. Generally, the drying period showed higher AUC values as the samples have likely reached full or near-full saturation from the sweating. While the sweating rate has an impact on the absolute values, the relative performance of the materials remained largely the same, as did the general trend of the curves. Only looking at the total AUC values may not fully encapsulate the performance of the material in the different phases during and after sweating, and therefore in exercise. Incorporating analysis of materials during these different phases may be appropriate in more standard test methods to help select optimal fabrics for a variety of environmental conditions. While only one cycle of activity and rest was simulated, the method could be expanded to include several repetitions to represent the dynamic nature of different activities, such as “stop–go” sports. Or include different sweating and drying times.
Footnotes
Acknowledgements
The authors thank Mrs Sophie Guevel and The Textile Protection and Comfort Center for support in conducting these experiments.
Declaration of conflicting interests
The author(s) declared no potential conflicts of interest with respect to the research, authorship, and/or publication of this article.
Funding
The author(s) disclosed receipt of the following financial support for the research, authorship, and/or publication of this article: The work of this publication was funded by Australian Wool Innovation Limited, Australia.