
Abstract
Foot morphological changes induced by degenerative processes are commonly found in old people. Such changes in foot anthropometry may adversely affect foot health and footwear comfort, and prolonged use of ill-fitting footwear may even cause foot deformation. This study compares foot anthropometric measurements between young and old women to determine key foot measurements, which can also act as indicators for developing footwear appropriate for the elderly. Using a three-dimensional handheld scanner, 11 foot anthropometric measurements are captured and used to characterize the dimensions and foot shape between young and old women. Eighty-two women between the ages of 20 and 95 years—that is, 41 young women (mean = 24.0; standard deviation = 3.5) and 41 old women (mean = 82.1; standard deviation = 7.2)—were recruited for this study. The results indicate that old women have a significantly longer and wider heel than young women as well as significantly larger ball and instep circumferences after normalization for foot length. Old women also exhibit larger deformity in the degree of hallux valgus and more pronated feet than young women do. A discriminant analysis linear equation has also been established to classify their foot type based on heel length and heel width with reference to their age group.
Introduction
Human feet are complex anatomical structures. Each foot is composed of 26 bones, 33 joints, muscles, tendons, ligaments, and a network of blood vessels, nerves, skin, and soft tissues. These components work together to provide the entire body with support, balance, and mobility. They function as a flexible shock absorber during gait, adapting to uneven surfaces and allowing the transmission of force between the lower limb and ground.1,2
As people become older, degenerative processes induce foot morphological changes and deformities; the enlargement of the foot width (FW) and height because of toe deformities or thickened nails is commonly found in old women. 3 A recent local study revealed that approximately 80% of the studied elderly people have at least one foot problem and/or various types of foot deformities, such as callus, hallux deformity, dystrophic nail, nail onychomycosis, and foot pain. 4 Older people possess a significantly larger ball circumference than younger people, and a slight reduction of medial foot arch is found. 5 An early study, however, indicated that older people in Japan exhibit significantly larger mean values in foot girth, foot breadth, and heel breadth than younger people. 6 As compared with men, older women have larger values of the first toe angle, which can be explained by the higher prevalence of hallux valgus found in women.
However, the choice of measurement method can influence the accuracy of foot anthropometrics obtained and lead to inconsistent results.7,8 Compared with conventional measurements, modern three-dimensional (3D) scanning methods with anatomical landmarks exhibit relatively higher precision, accuracy, and robustness, and they have been recommended for collecting foot anthropometric data.5,7,9 These methods are non-contact and flexible such that accurate and repeatable digital representations of 3D foot shape of numerous participants can be scanned quickly and efficiently. They have been successfully used in medical, ergonomic, and footwear development applications.10,11
Despite the fact that footwear can provide support for the lower extremity muscles and foot protection from injuries, due to deformed feet and ill-fitting footwear, many older people may prefer walking barefoot or in socks for comfort, leading to a higher risk of falling. Specific information on age-related changes in foot shape and characteristics is therefore critically important for the 3D ergonomic design of shoe lasts that cater to different ages and foot sizes. 12 Precise anthropometric measurements and the morphology of the foot therefore not only contribute to improved footwear fit and comfort but also enhance the protection and support of the foot. This study investigates age-related differences in foot geometry; the foot anthropometric measurements of the old and young women are compared. With reference to Wunderlich and Cavanagh’s 13 study, a discriminant function will be established to find out the key predictors for predicting the age classes of the women based on their foot characteristics. Given the recent development of 3D scanning technology, a handheld 3D scanner is adopted, which may increase existing knowledge on improving direct tangible measurements for fitting and designing women’s footwear. This study hypothesizes that the foot morphology of young and old women differs in terms of various dimensions, such as width, perimeter, length, and angle. Older women generally have wider, more pronated, and longer feet than younger women because of foot problems and degenerative processes.
Method
Participants
Eighty-two female subjects were recruited for this study. Forty-one healthy young women aged 20–35 years (mean = 24.0; standard deviation (SD) = 3.5) were chosen to form the young women group. Forty-one elderly women aged 65–95 years (mean = 82.1; SD = 7.2) were selected from a self-care elderly residence center. The young women group included women aged 20–35 years, healthy, without musculoskeletal problems in the lower extremities, and without history of foot injury during the past 2 years. The old women group consisted of women aged 65 years or above who could walk independently across a distance of at least 6 m with or without a walking aid. 14 The body mass index of the old women group ranged from 14.1 to 34.1 kg/m2 (mean = 23.9; SD = 4), whereas that of the young women group ranged from 17.0 to 26.9 kg/m2 (mean = 19.5; SD = 2.1). The foot sizes were 35–42 and 34–39 (European) for the old and young women group, respectively. All participants provided written informed consent before participating in the study. The experiment was approved by the Human Subjects Ethics Sub-Committee at The Hong Kong Polytechnic University prior to beginning the study.
Foot Anthropometric Measurements
In this study, all foot shapes and characteristics were captured using an Artec Eva 3D handheld scanner with high 3D resolution up to 0.5 mm and 1.3 Mpx for texture resolution (Artec Group, Luxembourg) (see Figure 1). Eight anatomical landmarks were drawn with a red ballpoint pen with a 0.5-mm line weight on each foot by the same examiner, and they were visible to the laser of the scanner (see Figure 2). The landmarks were selected on the key anatomical locations of the foot and could be used to characterize the external shape of each foot and facilitate the calculation of 11 anthropometric measurements.7,15 During scanning, the subjects were given instructions to stand on their bare feet with their feet shoulder width apart (their weight evenly distributed across both feet) and place their arms by their side to separately acquire images of the left and right foot.
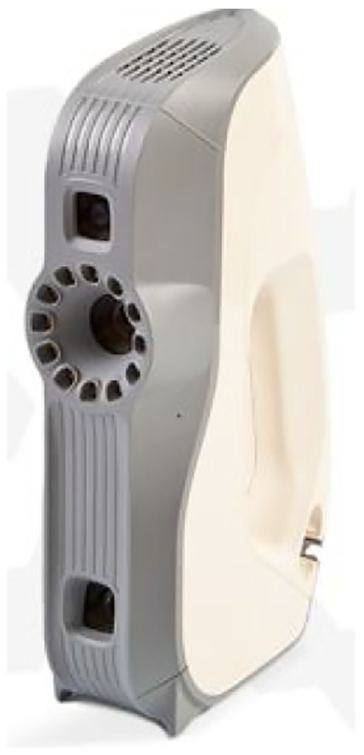
Artec Eva 3D handheld scanner.
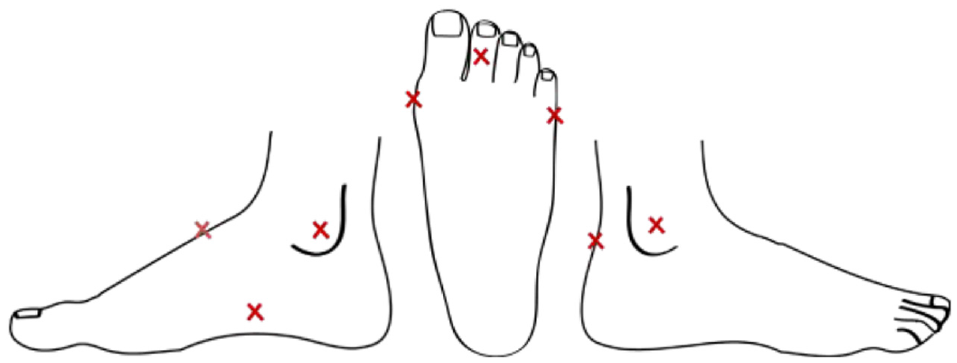
Example of 3D foot image with eight anatomical landmarks.
Foot Measurements
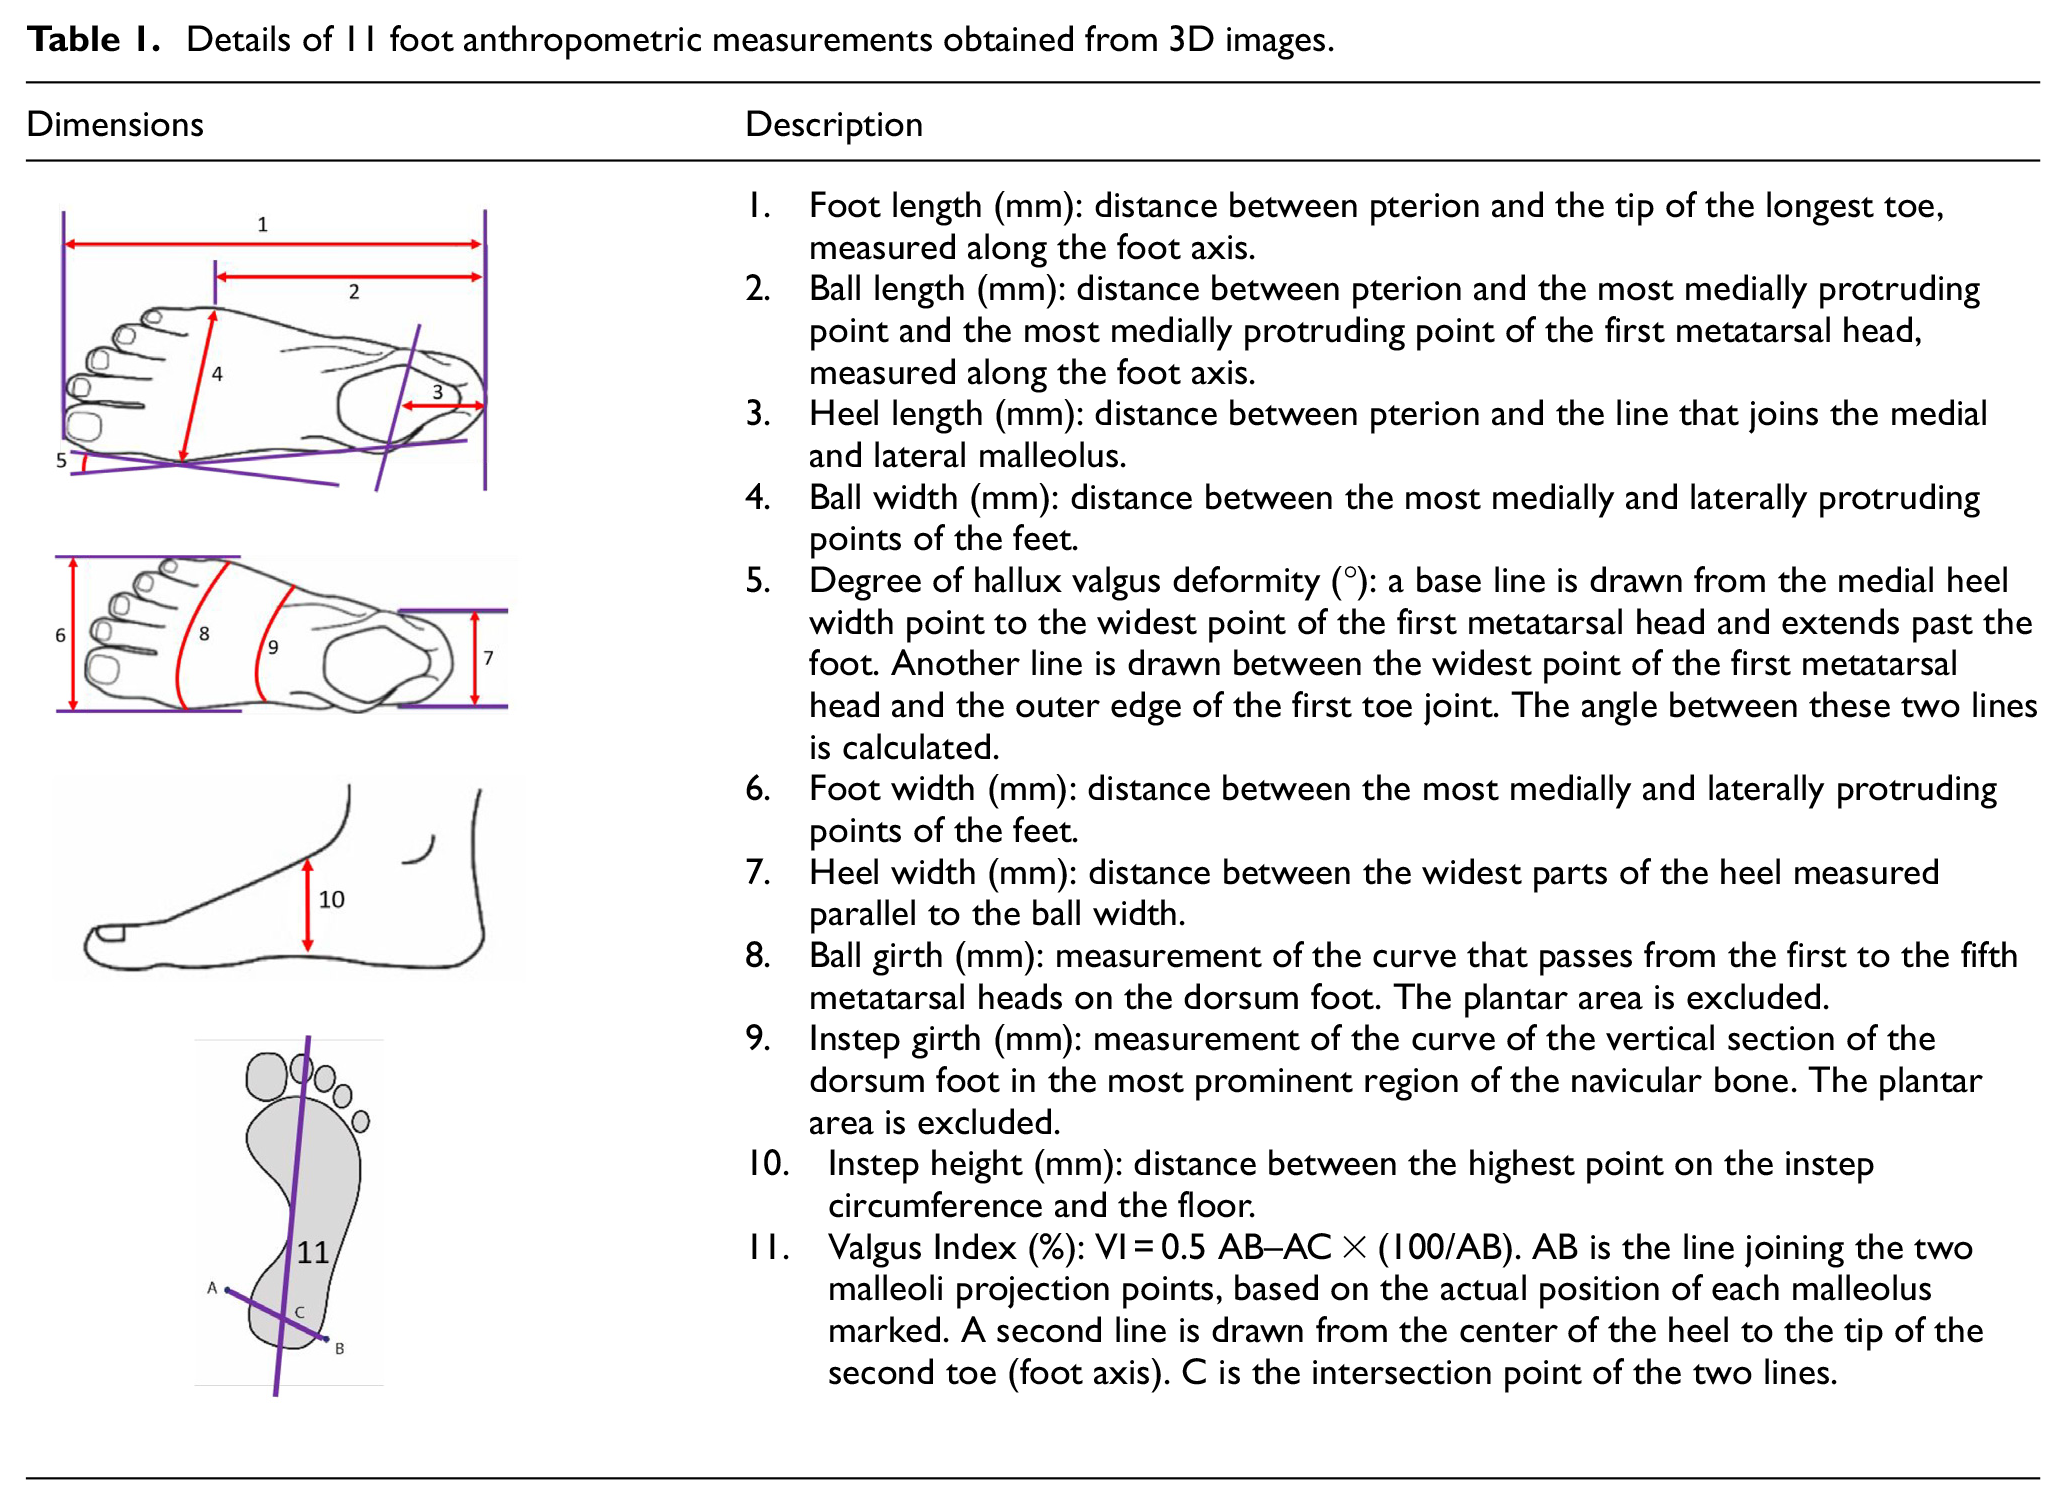
Eleven foot anthropometric measurements were obtained from the 3D foot images by the same examiner through the Rapidform software XOR3, including the foot length (FL), heel length (HL), ball length (BL), FW, ball width (BW), heel width (HW), ball girth (BG), instep girth (IG), instep height (IH), degree of hallux valgus deformity (HVD), and valgus index (VI) (see Table 1).14,16–18 The software was also used for aligning the foot images with the floor and XYZ coordinate to obtain the measurements more accurately. Foot anthropometric measurements were obtained from the dominant leg (all from the right foot) of each participant to ensure that the assumption of data independence is met.13,19
Details of 11 foot anthropometric measurements obtained from 3D images.
Reproducibility of Foot Measures
Intra-tester measurement error was conducted to assess the reliability of using the 3D scanner with anatomical landmarks. The foot dimensions of four subjects from the young women group were repeatedly analyzed five times. The root mean square error (RMSE) was calculated using equation (1) for the BL, HL, BW, IH, and HVD expressed in % FL or degrees.18,20 Relative measurement error was also quantified according to equation (2):18,21
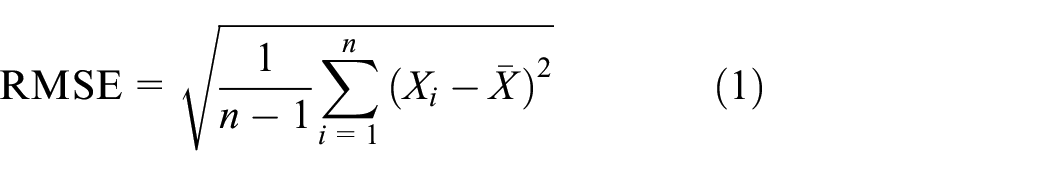

where VAV is the variable average value (arithmetic mean of all measures for each subject, sum of all subjects divided by the number of subjects).
The results were between 0.15% and 0.30 (% FL) for linear measures and 0.32° for the angle measure (see Table 2).
Absolute and relative intra-tester root mean square error (RMSE).
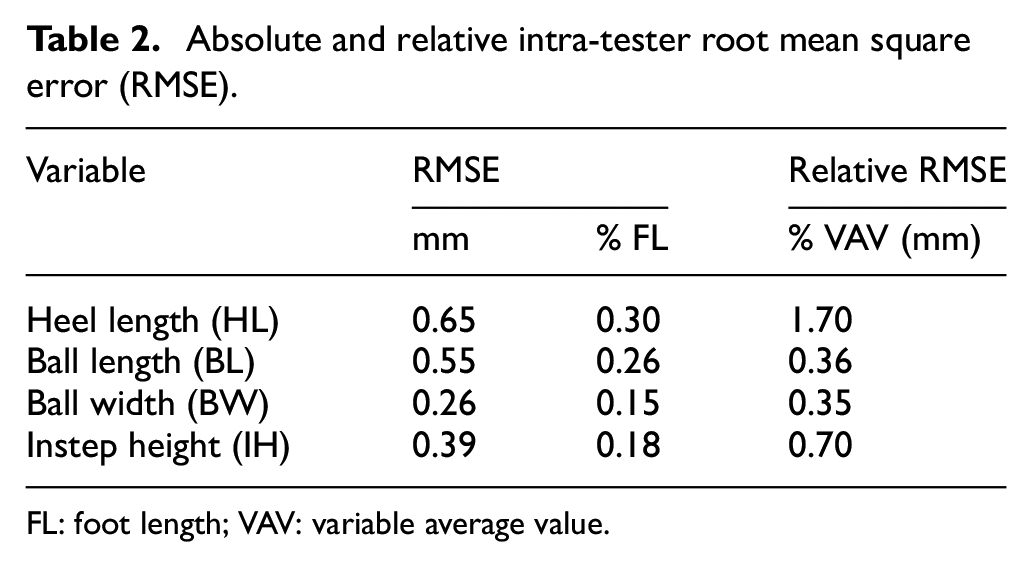
FL: foot length; VAV: variable average value.
Statistical Analysis
Independent t-tests were conducted using the Statistical Package for the Social Sciences (SPSS) Version 19.0 (SPSS Inc., Chicago, IL, USA) to assess the statistical significance of the differences in the measurement outcomes between young and old women before and after the measurements were individually normalized for the FL. Normalization for FL was carried out in all foot anthropometric measurements, except for HVD and VI. A discriminant analysis was performed on the normalized foot anthropometrics to determine the key foot anthropometric measurements that are distinct between ages using the SPSS software. A discriminant analysis linear equation was also formulated and derived from the discriminant analysis (stepwise method) by inputting age as a grouping variable and all normalized foot anthropometric measurements as independent variables. The level of significance was set at 0.05.
Results
Differences between Young and Old Women
Table 3 indicates that the old women generated larger absolute and normalized mean values for all foot anthropometric measurements than the young women did. Significant differences in absolute values between young and old women were found for all foot measurements, except FL. However, after normalization of mean morphological values for FL, statistical significance of differences was only observed in the HL and HW as well as the perimeters of ball and instep. Apart from linear measurements, old women showed a significant difference in HVD compared with that of young women. Both young and old women exhibited negative values in VI, implying a lateral shift of the ankle. However, old women had a significant reduction in negative VI compared with young women, indicating that old women had relatively more pronated feet than young women had.
Anthropometric measurements of young and old women.
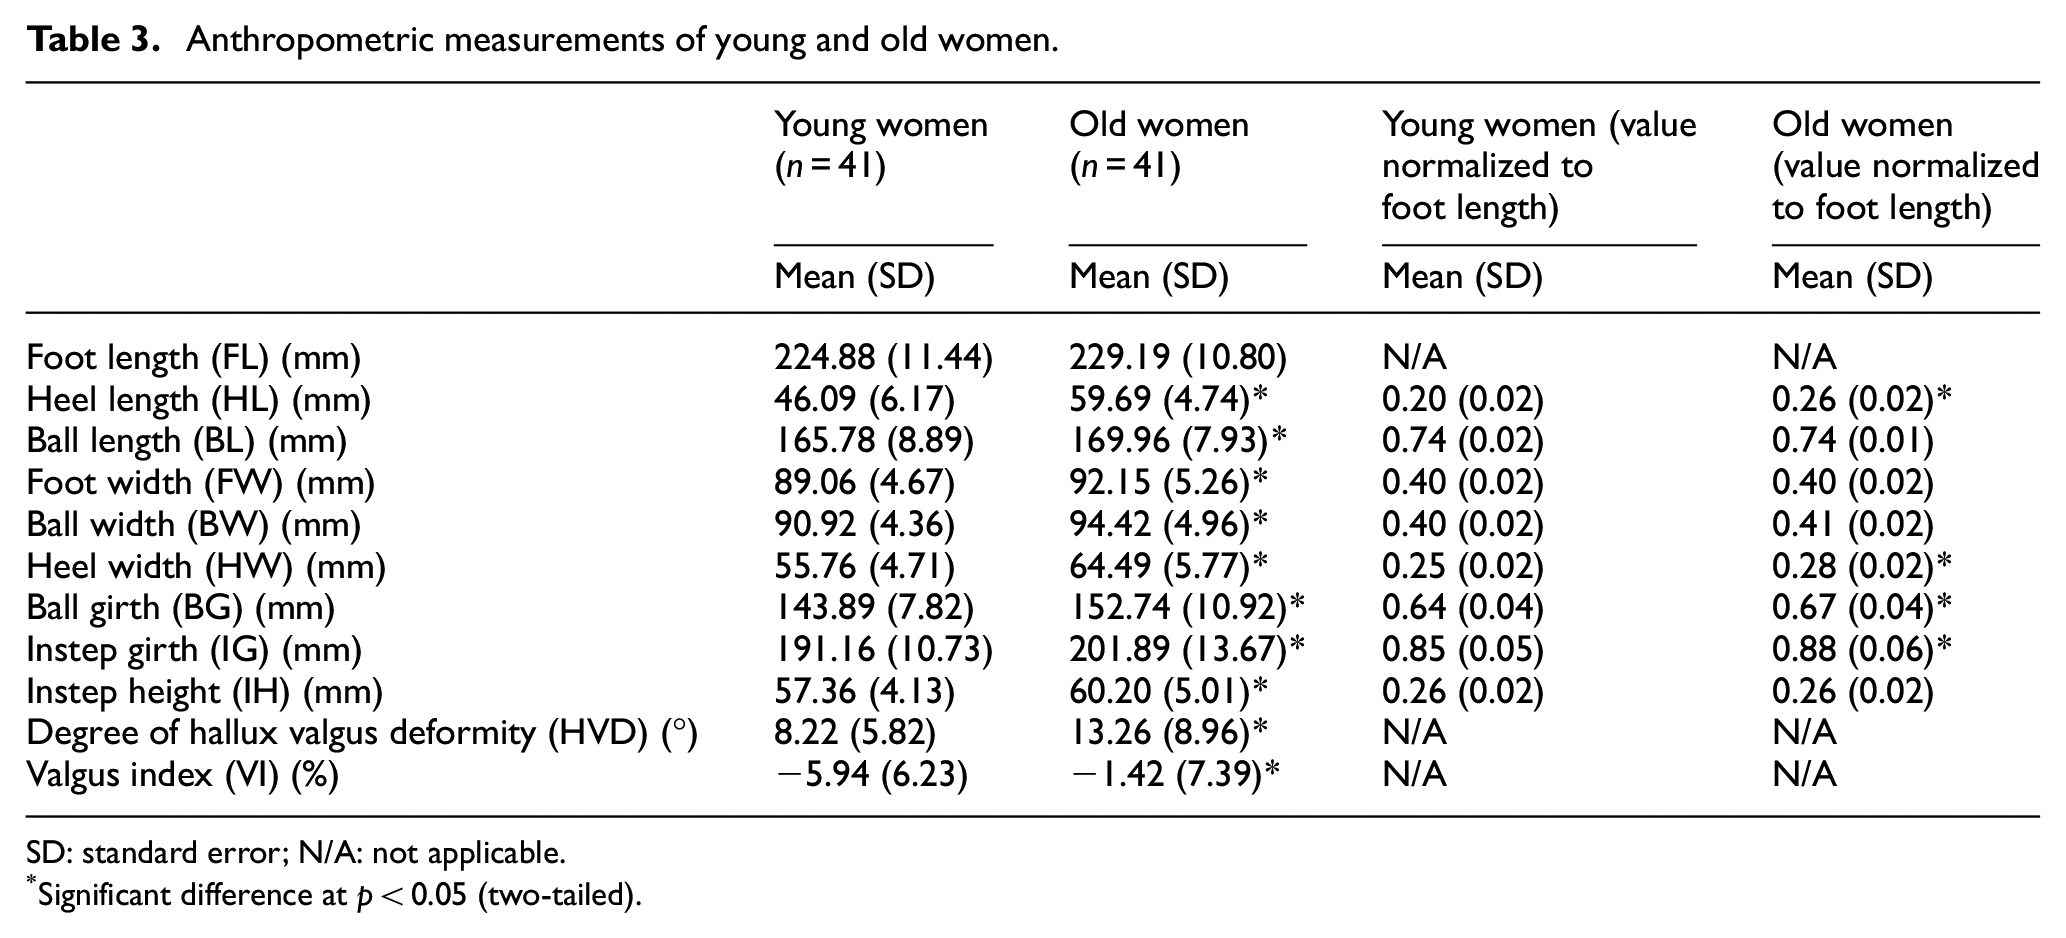
SD: standard error; N/A: not applicable.
Significant difference at p < 0.05 (two-tailed).
Differences between Young and Old Women
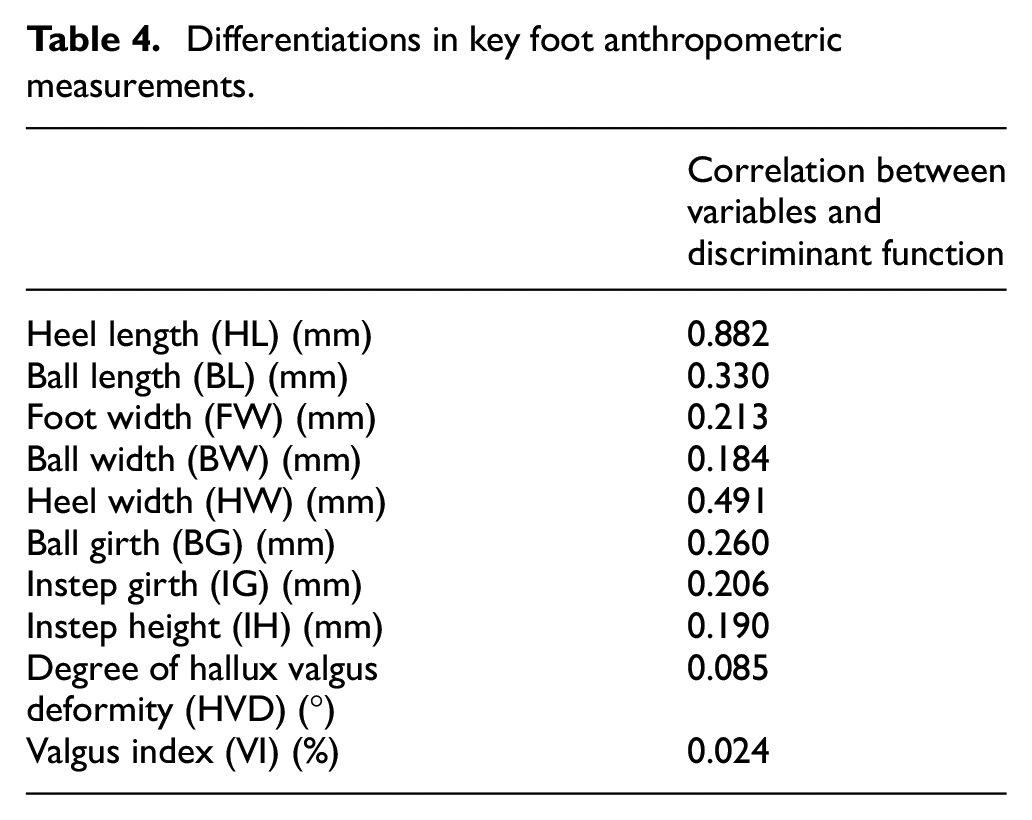
The discriminant analysis indicated that the predictors presented in this section could be effectively used to differentiate foot characteristics between young and old women (p = 0.000); the overall effect size for the analysis (η2 = 0.69) was large. 22 Table 4 presents the correlations between the variables and the overall discriminant function, which suggests that the HL, HW, and BL contribute most to differentiate those of young women from those of old women. A discriminant analysis linear equation was also formulated to classify foot type with reference to their age using equation (3). For example, the result of the discriminant function scores for old women was 1.65 (positive) and for young women was −1.95 (negative). The cross-validated classification showed that 92.7% of the subjects could be correctly classified by the analysis based on HL and HW:

where D is the discriminate function (scores), HL is the normalized heel length (fraction of heel length/foot length), and HW is the normalized heel width (fraction of heel width/foot length).
Differentiations in key foot anthropometric measurements.
Discussion
Measuring foot anthropometric data and morphology is crucial for the design and production of well-fitting footwear. Foot morphology gradually changes with age and health conditions because the feet bear body weight and are exposed to daily strains. Considering that degenerative changes on feet that are common among old people, this study pursues highly accurate foot anthropometric measurements by scanning foot surfaces with the aid of an image analysis system. In doing so, the age-related differences in foot anthropometry among women are determined, along with the key foot measurements, to aid the footwear industry. The results of this study are in line with the hypothesis that feet present important anatomical differences according to age. The findings in absolute values imply that the foot dimensions from the two groups would be affected by their different foot sizes, which refer to the mechanism of allometry that the foot proportions change according to size.18,23 After normalization, an alternative indication of age-related differences in foot shape resulted in that the old women were found to have significantly larger foot anthropometric dimensions than the young women in terms of HW, BG, IG, and HL. These findings are similar to those in Kouchi (1998) to a certain extent stating that the foot anthropometric measurements of older women have significantly larger means in foot girth, foot breadth, and heel breath than those of younger women. Females aged over 60 years and above also have significantly larger means in these three measurements for the same FL (e.g. 220–230 mm) than younger women have. 6 In the study conducted by Tomassoni et al., 5 the ball circumference shows the most relevant age-related difference among females. The slight inconsistencies between studies may be due to different measuring methods or true ethnic differences.7,24 A significant increase in the first toe angle of elderly women in Hong Kong was similar to that of elderly women in Japan because of the presence of hallux valgus, which occurs more frequently in women. 25 In another study, older people with moderate–severe HVD had significantly increased BG and BW, medial and lateral BLs, heel bone, and first toe angles. 14 Therefore, the significant increase of BG in this study might be due to the presence of mild hallux valgus and other deformities around the forefoot regions of the women. The significant increase in BG and HW might also be due to the excess fluid present in the foot region. 14 The outcome that older women had more pronated feet in this study is consistent with the finding of Scott et al.; 26 this characteristic is associated with flat feet and changes in instep and medial malleoli, which resulted in a significant increase in IG and HL.
The differences in foot dimensions found in this study may be caused by social, occupational, and aging factors. Feet with fairly rigid structures carry heavy physical workloads, including both static and dynamic. At the same time, the feet are forced by the environment (e.g. flat and hard surfaces) to absorb shock which creates prolonged periods of micro and repetitive trauma. Foot problems magnify as age increases and multiple chronic diseases occur that may result in inflammatory changes in bone and soft tissue. The age-related differences in foot characteristics also imply that the shoes available in the market may not fit both young and old women. According to a survey, approximately 59% of female consumers reported that finding shoes that fit “right” is difficult. 27 This difficulty may be because shoe manufacturers normally utilize data from the feet of young adults when designing shoes for all women. 28 Most of the outdoor footwear available in the market generally fails to accommodate the foot dimensions of old people, which may cause discomfort or eventually result in foot deformities and high risk of falling. As found in this study, adjustments should be made to the forepart of the shoes so as to match the “flex angle” of the forefoot for better accommodating the extra girth of the forefoot. To further improve the fitting of footwear to accommodate the degenerative foot problems, the back part of the shoe last designed for geriatric footwear should also be adjusted because it is normally not modified unless heel height changes. 29
In this study, it is apparent that properly fitting footwear can only be achieved by including not only the length and width but also the 3D foot data and shape morphology. The key foot measurements obtained in this study for age difference are different from those for gender difference in older people, where first toe height, first toe angle, fifth toe angle, ball of foot height, medial BL, and instep circumference (in order of importance) are the domensions most associated with gender. Foot measurements in this study can also be used to predict the foot shape of older women for shoe last production because they are similar to those in Luximon and Goonetilleke 30 stating that the foot shape is modeled and predicted using only the length, width, height, and the curvature of the metatarsophalangeal joint (MPJ), which has a mean accuracy of 2.4 mm. The results also indicate that the traditional measurements of FL, BG, or FW adopted in footwear sizing and grading should not be the only key dimensions for designing a correct size for feet from different ages. HL, BL, and HW should also be considered. At least four regions—that is, toes, MPJ, arch, and rear foot—should be considered to accurately describe fit and comfort. Using the equation and key indicators in this study, footwear manufacturers can modify the design elements of geriatric footwear to provide better fit and comfort for elderly women. For example, the width of geriatric footwear, such as in the forefoot and heel areas, should be extended to provide extra space for the feet for enhancing comfort and fit. Knowing the dimensions and location of the MPJs (e.g. BL) is also important for designing shoes with an appropriate grade of flexibility.
The plantar side of the feet was not scanned in this study because all anthropometric measurements were obtained under full-weight bearing conditions. However, accurate scanning of the foot plantar and prints can be incorporated into future research to provide more comprehensive information and analysis of the foot shape between young and old women. The number of subjects in this study is also relatively small, and thus may affect the generalizability of the results. Nevertheless, the study offers evidence of age-related differences among women exploiting the current development of 3D scanning technology, thereby providing information for future studies to develop more complex prediction models related to foot anthropometry and design well-fitting footwear for women with different ages. The results of this study may not be representative of all populations because the participants are of Asian origin; they may only be valid for this population. Future studies can consider a wider range of populations, such as European and American. More subjects in different genders, age groups, and foot conditions could be recruited for scanning in the near future so as to enlarge the anthropometric database of the foot for prediction of 3D foot models and the corresponding geometry features, foot types, and problems.
Conclusion
Foot characteristics of old women differ from those of young women. Shoe manufacturers should consider such age differences when designing the last dimensions of footwear for old women, especially in terms of the length and width of heel, perimeters of ball and instep, degree of HVD, and VI. Apart from FW, HL, BL, and HW are common predictors used to differentiate foot characteristics between young and old women. Changes in the foot shape geometry caused by aging have exacerbated the problems of footwear fit and comfort, resulting in inappropriate footwear design and sizing systems for old women. Considering the increasing population of old women and thus strong demand for geriatric footwear, the findings of this study provide valuable foot anthropometric information to footwear manufacturers. Such information can assist the manufacturers to improve the design of footwear for older women, and ultimately provide them with optimal fit and comfort. Future work with more subjects is recommended to extend the generalization of this study.
Footnotes
Declaration of conflicting interests
The author(s) declared no potential conflicts of interest with respect to the research, authorship, and/or publication of this article.
Funding
The author(s) disclosed receipt of the following financial support for the research, authorship, and/or publication of this article: The authors thank the Laboratory for Artificial Intelligence in Design (Project Code: RP1-2) under the InnoHK Research Clusters, the Hong Kong Special Administrative Region for funding this research project, and Chuk Yuen (North) Jockey Club Housing for the Elderly for providing support in the 3D scanning experiment.