
Abstract
This article is focused on the comparison of dyeing, and washing and light fastness properties of conventional and novel perlite-containing polyester woven fabrics via color measurements. All the production processes for the regular and perlite-containing polyester filament yarns were the same. The fabrics were dyed with three medium level energy disperse dyes of different hues in order to observe the shade change caused by the intrinsic yellowness of the perlite-containing fabric. Dyeing and fastness properties of the dyed fabrics were evaluated by their corresponding lightness (L*), chroma (C*), color strength (K/S), and color difference (ΔEab*) results. The perlite-containing fabrics showed similar dyeing and fastness characteristics when compared with the regular fabrics. The perlite-added fabrics were dyed in darker color but had lower chroma values than the regular ones. The perlite-added fabrics also had better fastness results than the regular fabrics when the evaluation was performed in the group itself. Intrinsic yellowness of perlite-added fabrics must be taken into account for any attempt to dye the fabric to a pre-designed shade.
Introduction
Perlite is a versatile material with unique properties. 1 It is a volcanic acidic glassy rock which consists mainly of silica (72%–75%) and Al2O3 (12%–15%) and usually contains 2%–6% water. When heated rapidly at 700–1200°C, it can expand to as much as 20 times its original volume. The natural perlite is commonly gray, but can also be green, brown, blue, or red. After heating, perlite becomes a light-weight material and is typically light gray to white in color.2–5
When the perlite ore is treated and heated (over 870°C) under suitable conditions, it grows up to 20 times its original volume and becomes porous. After this physical transformation, its color turns from gray to white. 6 After this physical transformation, the expanded perlite (EP) exhibits excellent characteristics associated with high porosity and high water absorption. 7 The expanded form of perlite (EP particles) has low density and high porosity, and offers excellent thermal and acoustic insulating properties, chemical inertness, physical resilience, fire resistance, and water retention properties.8–15
Perlite is used in the construction industry for insulation tiles, and in concrete as aggregate. Also, it is used as a filter product in the cleaning of dams and ponds, in an aquatic environment to obtain a clear liquid, in the growing of seed, in regulating the soil in agriculture, and in many other industrial applications. Perlite has recently been used as an aflatoxin detoxicant and adsorbent in the removal of wastewater.6,12–14,16
Perlite is chemically inert in many environments, and hence an excellent filter aid and filler in various processes and materials. Along the Aegean coast of Turkey lies about 70% of the world’s known perlite reserves. Due to its structural properties, chemical composition, and surface chemical properties, perlite has gained much interest among scientists. 9
Polymer nanocomposites (PNCs) have attracted much attention during the past 10 years because of their low cost and their ready availability. In comparison with the pure polymer or conventional (microscale) composites, it is reported that the presence of nanoparticles in the polymer matrix can significantly increase moduli, strength, and heat resistance and decrease gas permeability and flammability. 17
The usage of perlite as an additive in a textile fiber has recently been performed for the first time, and polyester fibers containing perlite have been successfully manufactured. 18 Polyester fibers having perlite were successfully spun, and perlite-added polyester yarns and fabrics were produced. The perlite-added fibers were originally produced to obtain better water absorption, heat, and sound insulation properties in the fabrics in which these fibers have been used. The results were presented in an earlier paper. 19 Some comfort, tensile, thermal resistance, and acoustical properties of these fabrics besides their water vapor resistance were reported.19,20 However, the dyeing and fastness properties of fabrics produced from polyester fibers having perlite additive have not been studied yet.
The yarns and fabrics which are produced from the polyester fibers are dyed mainly with disperse dyes. The three dyeing methods—namely, thermosol, carrier-dyeing, and HT (hot temperature) dyeing—are used in the disperse dyeing of polyester fibers. The HT dyeing of polyester fibers is performed at 130°C, and it is the most used dyeing method due to its advantages against the other two. The disperse dyes are a class of dyes which have affinity to the amorphous phases of man-made fibers. They are mostly used in the coloration of acetate and polyester fibers. Although nylon and acrylic fibers can be dyed with the disperse dyes, these fibers are dyed with other classes of dyes, which are more suitable to their molecular structures. Disperse dyes are nonionic dyes, and they are applied in mildly acidic conditions to polyester fibers in dye baths which also contain dispersing and leveling agents. The disperse dyes are usually classified as low, medium, and high (LMH) level energy dyes, and they are used according to their sublimation characteristics in the three different dyeing methods.21,22
Washing and light fastness properties are among the most important fastness properties of dyed materials. They are examples of fastness tests that reflect the domestic usage properties of dyed goods.
The coloration, washing, and light fastness properties of disperse dyed polyester fabrics, which were produced from regular and perlite-added polyester fibers, were studied via the color measurements in this article. The dyeing and fastness evaluation of perlite-containing polyester fabric was conducted for the first time. The perlite-containing fabrics showed similar dyeing and fastness characteristics when compared with the regular fabrics. However, the initial color (primarily yellowness) of perlite-added fabrics influenced the final color of the samples regarding the hue of the dyes used. Perlite-added fabrics were dyed in darker color but had lower chroma values than regular ones. Perlite-added fabrics also had rather better fastness results than regular fabrics.
Experimental
In the experimental part, regular polyester fibers were produced first. For the production of perlite-containing polyester fibers, the master batches that contained 25% perlite were produced. The perlite master batches, which contain 25% perlite, were dosed at a ratio of 5% in the extruder of a Spinboy II-CC Melt Spinning Unit (Korteks Inc., Bursa, Turkey) in order to mix with the regular polyethylene terephthalate (PET) chips, and polyester filament yarn production was carried out. The Fully Drawn Yarn (FDY) polyester yarns of 150 denier and 36 filaments with circular cross sections, containing 1.25% perlite, were produced. The produced yarns were subjected to a texturing process in order to see the effect of the perlite additive. The reference textured polyester FDY yarns without perlite were produced using the same production parameters (spinning rate, cooling air temperature, etc.).
The production details of the processes prior to yarn production (properties of the raw perlite material, grinding process, perlite surface modification process, perlite size distribution after grinding, and other production details) were presented in the former paper. 19 Plain woven fabrics were produced using perlite-containing and reference (regular) polyester yarns in both the warp and weft directions. Thus, two different polyester fabrics, one containing yarns with the perlite additive and one containing the regular (reference) fibers, were produced.
The constructional properties of normal PET and perlite-added polyethylene terephthalate (P-PET) fabric samples are presented in Table 1.
Constructional properties of the fabric samples.
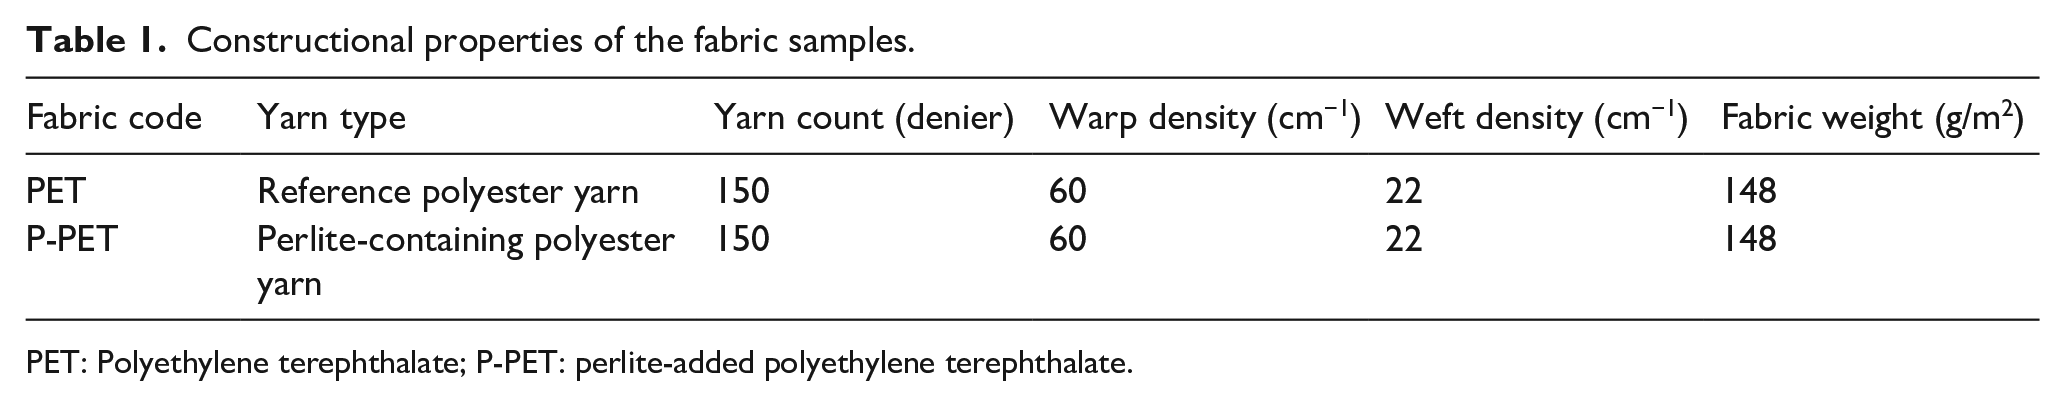
PET: Polyethylene terephthalate; P-PET: perlite-added polyethylene terephthalate.
After weaving, both the fabrics were pretreated in a pretreatment bath including a nonionic washing agent (2 mL/L) at 60°C for 60 min to remove the impurities including size and possible dirt. After washing, the fabric samples were dried and stentered at 180°C for 60 s prior to dyeing. All the washing and stentering processes were performed in mill conditions.
The dyeing experiments were carried out using a laboratory type sample dyeing machine (Xiamen Rapid Co. Ltd. China). Three-gram pieces of fabrics were dyed at a liquor ratio of 25:1, using stainless steel dye pots. The dyebaths contained fabric sample, dyestuff, nonionic leveling–dispersing agent (2 mL/L), and acetic acid (commercial purity) for pH 5.5. The three different dyeing concentrations—that is, 0.5%, 1%, and 3% omf (on mass of fiber)—were applied. The medium energy level disperse dyes were used (Foron Blue RD-E, Foron Red RD-E, and Foron Yellow RD-E, no C.I. names were allocated). Dyeing began at 40°C and continued at this temperature for 10 min. After that, the dyebath temperature was raised to 130°C by 2 C/min. Dyeing continued at 130 C for 60 min, and later, the temperature was decreased to 70°C by 3°C/min. At the end of dyeing, the dyed fabric samples were removed and rinsed in cold tap water for 10 min. The dyed and rinsed samples were treated in a reduction clearing bath containing 1 g/L sodium dithionite (hydrosulfite) and 2 g/L sodium carbonate at 70°C for 25 min to remove the unfixed dye which was left on fiber surfaces. Later, the cleared samples were rinsed in cold tap water for 10 min, and they were left to dry under laboratory conditions.
The washing fastness test was performed according to ISO 105-C06:2010 B1M test (4 g/L ECE reference detergent WOB, 150 mL liquor volume, 50°C, 45 min, 50 steel balls (6 mm in diameter)). 23 In the washing fastness test, M stands for “multiple” which is explained as one B1M is equivalent to five domestic washes. The washing fastness of fabric samples was evaluated with color measurements in order to present a clearer understanding.
The light fastness test was performed according to the ISO 105-B02:2014 test. 24 The test lasted for 200 h in order to observe the behavior of the fabrics under long-term exposure conditions. During the light fastness test, the test specimens were cut in 4 × 10 cm dimensions, and they were placed in the exposure chamber attached to the appropriate sample holders. Similar to the washing fastness test, the light fastness of fabric samples was evaluated with color measurements in order to present a clearer understanding.
Color measurements on the dyed samples were performed using a reflectance spectrophotometer (Konica Minolta CM-3600d, Japan) between 400 and 700 nm under D65/10° illuminant and specular component included mode. The fabric samples were folded twice to achieve four layers of fabric. The four reflectance measurements were performed at different positions on the dyed fabric samples, and the average percentage reflectance was recorded. Color coordinates (L*, a*, b*, and C*), color strength (Kubelka–Munk values) (K/S) (λmax for the blue dye: 620 nm; λmax for the red dye: 520 nm; λmax for the yellow dye: 450 nm), and color difference values (ΔEab*) (CIELAB 1976) were obtained from the color assessment software.
Results and discussion
Initial colorimetric values of undyed fabric samples are presented in Table 2 including whiteness index (WI), tint, and yellowness index (YI). Because of the addition of perlite in the polymer melt and further spinning, the P-PET fabric sample had an obviously greater yellowness than the original PET fabric sample. Because of the great differences especially observed in lightness (L*) and b* (yellow–blue axis) color coordinates, a great color difference (ΔEab*) was obtained between PET and P-PET. The addition of perlite in the fiber changed the color properties of fibers and fabric samples produced from them. The P-PET fabric sample had a much lower CIE WI, and it had a greater and remarkable reddish–yellowish cast than the PET fabric sample. The numerical differences between the YI and the CIE tint values of PET and P-PET fabrics support this finding. When observed visually under standard lighting conditions in a color assessment light cabinet, the P-PET sample appeared yellower and darker than the PET sample.
Color properties of the fabrics prior to dyeing.
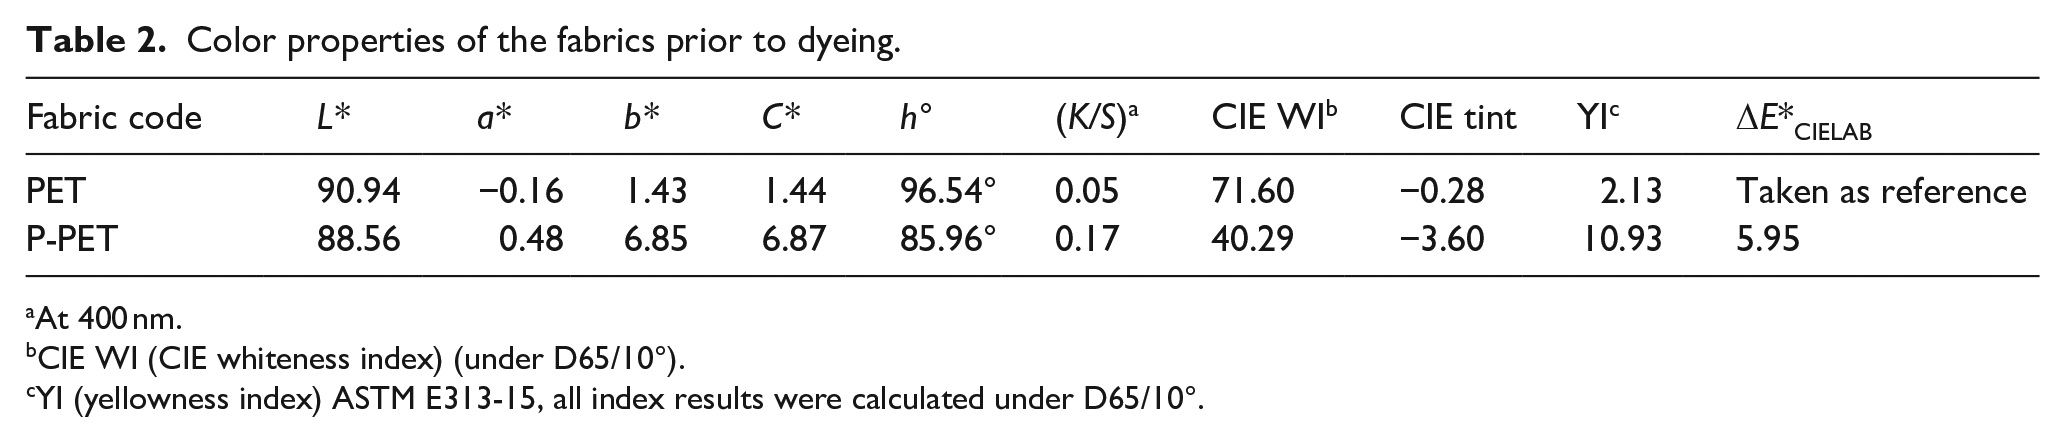
At 400 nm.
CIE WI (CIE whiteness index) (under D65/10°).
YI (yellowness index) ASTM E313-15, all index results were calculated under D65/10°.
L* (lightness), C* (chroma), K/S (color strength), and ΔE* (color difference) values of disperse dyed (blue, red, and yellow) PET and P-PET fabric samples are presented in Figures 1–11 together with their corresponding color values after washing fastness and light fastness tests. In Figures 1–3, where L* color coordinates are presented, the highest L* values were obtained at 0.5% omf and the lowest L* values were obtained at 3% omf, as it would be expected. However, the relations of L* values among original dyed and fastness test-applied samples changed considerably depending on the hues of the disperse dyes applied. For that reason, Figure 3 must be discussed in a different way from Figures 1 and 2. Also it must be noted that the L* values of the blue and red dyed samples (Figures 1 and 2) changed over a much wider numerical range than the L* values of yellow dyed samples (Figure 3) between 0.5% and 3% omf.
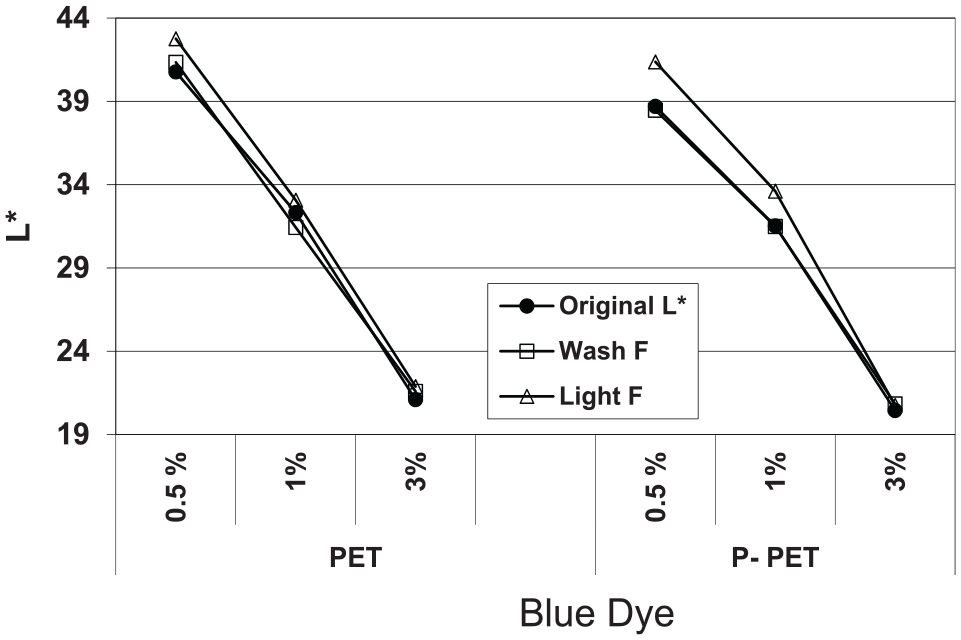
L* values of blue disperse dye.
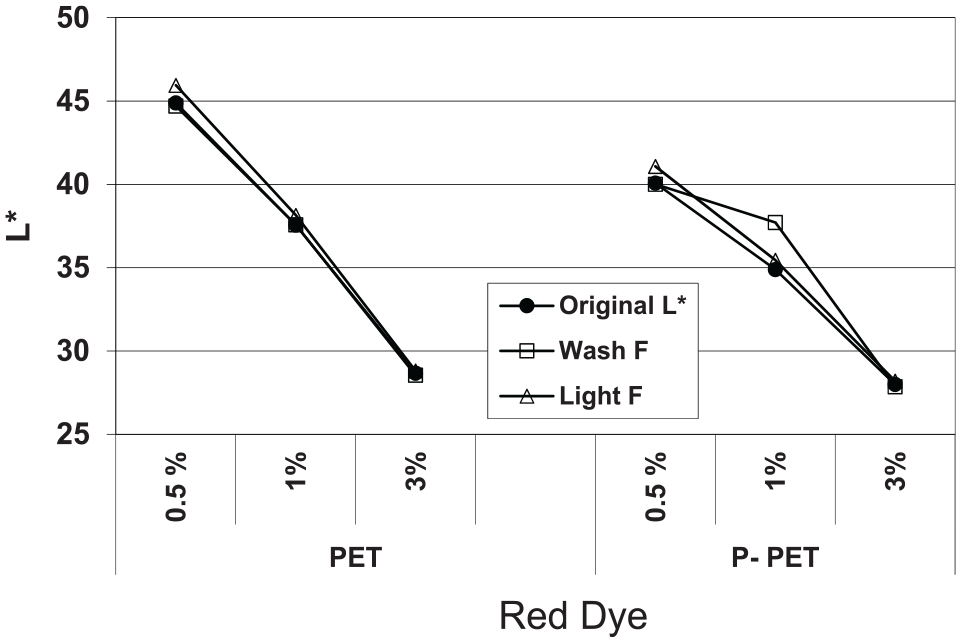
L* values of red disperse dye.
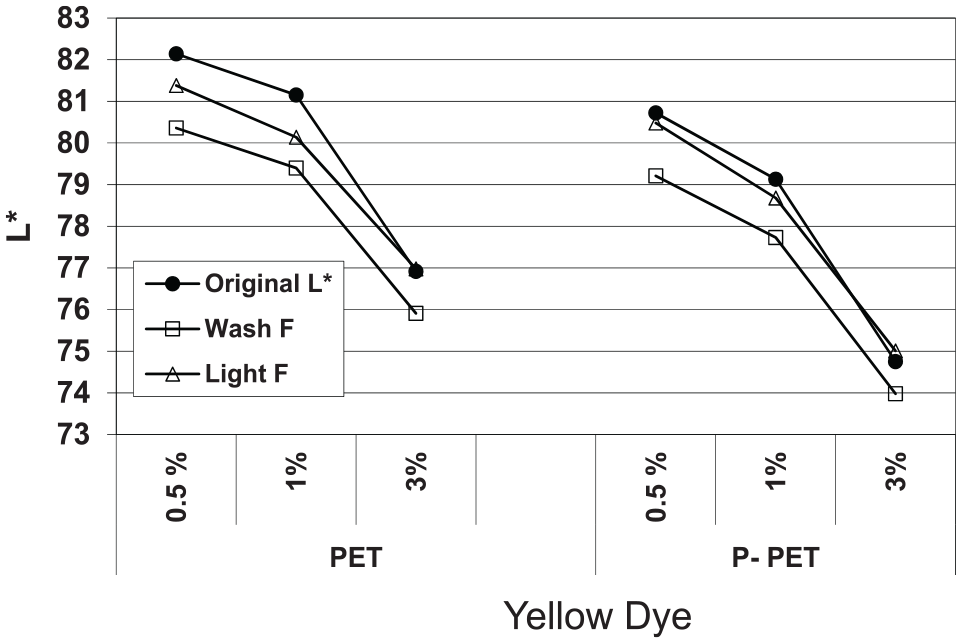
L* values of yellow disperse dye.
C* values of blue disperse dye.
C* values of red disperse dye.
C* values of yellow disperse dye.
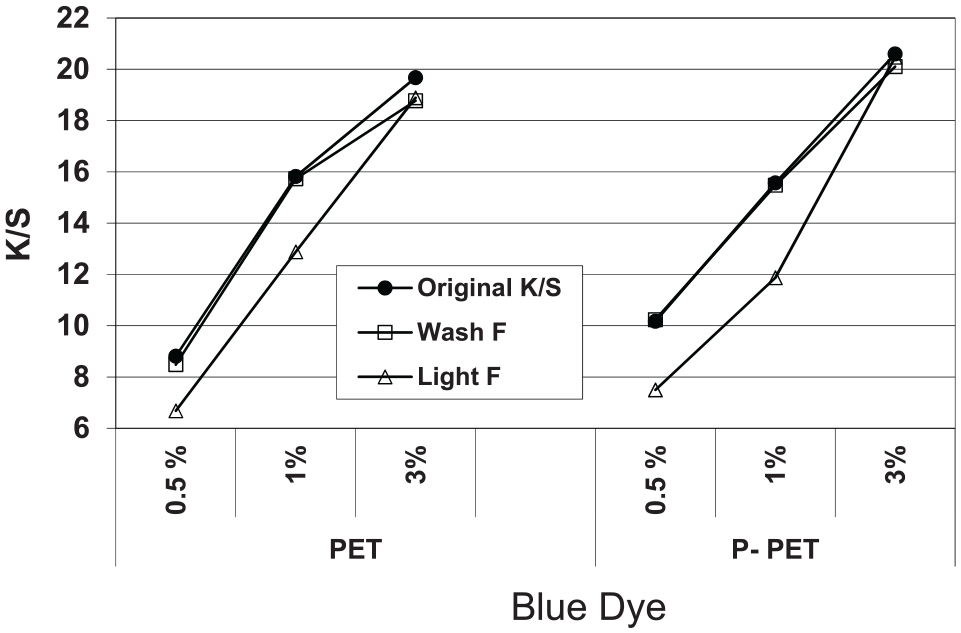
K/S values of blue disperse dye.
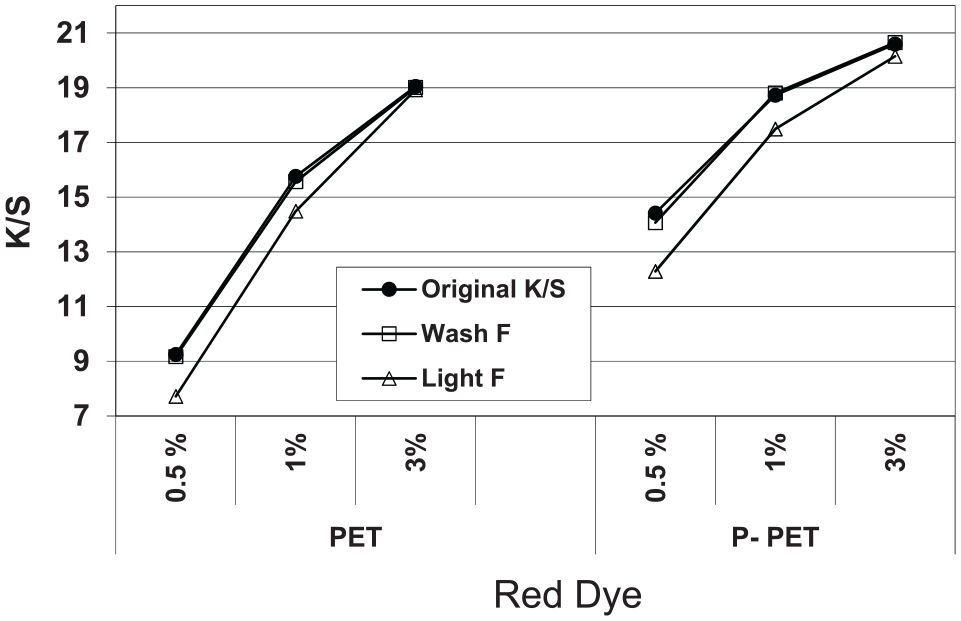
K/S values of red disperse dye.
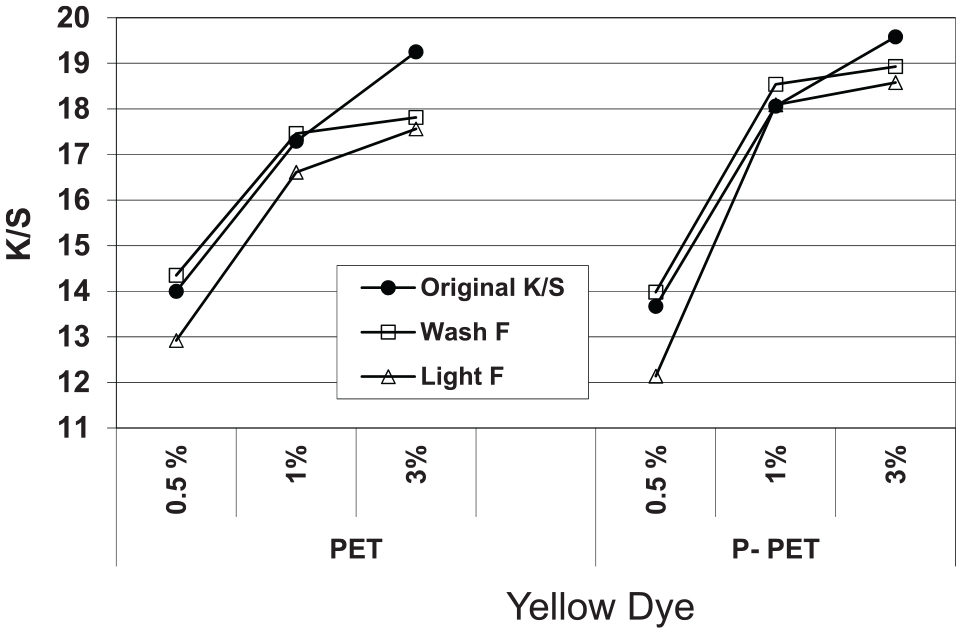
K/S values of yellow disperse dye.
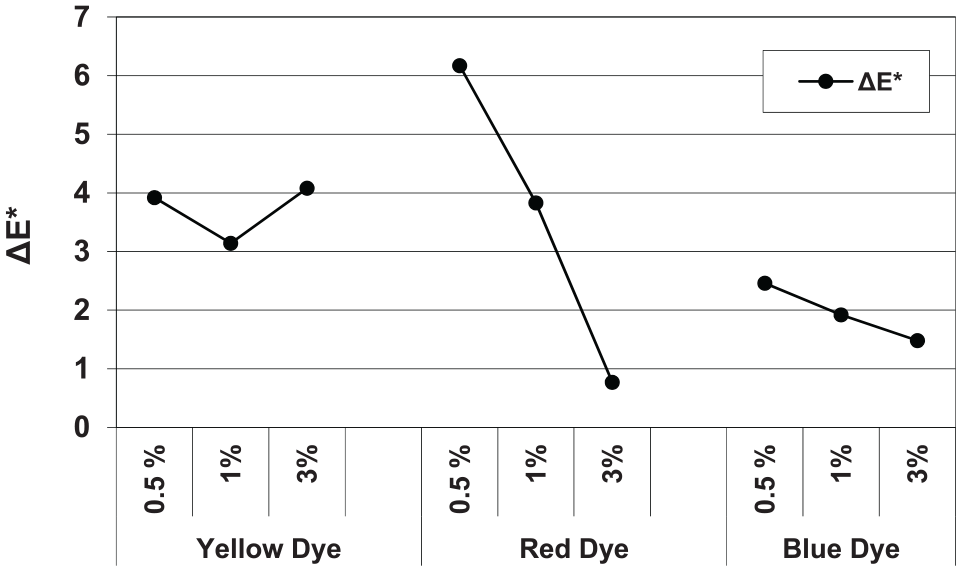
ΔE* values between dyed PET and P-PET fabrics.
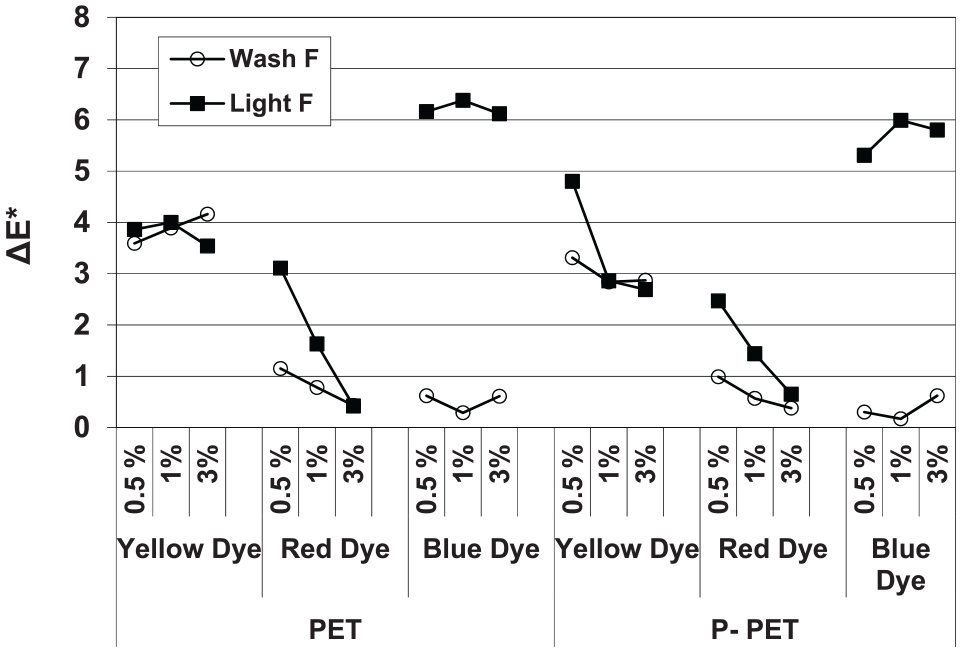
ΔE* values between original dyed and fastness test-applied fabrics.
The L* values of P-PET samples were considerably lower than the corresponding L* values of PET samples especially at 0.5% omf. This difference was much more visible for the red dyed samples at 0.5% and 1% omf in Figure 2. In Figures 1 and 2, where the L* values of blue and red dyed samples are presented, the L* values obtained at 3% omf were almost the same for PET and P-PET fabrics at their corresponding figures. However, the L* values of P-PET fabrics at 3% omf were considerably lower than those of PET fabrics in Figure 2 (yellow dye) which could have been caused by the effect of original yellowness of the P-PET fabric.
When the L* values in Figures 1–3 were considered from the viewpoint of fastness tests, it was observed that the highest L* values were obtained after the light fastness test in blue dyed (Figure 1) and red dyed (Figure 2) fabrics for both the PET and P-PET samples especially at the lowest dyeing concentration, that is, 0.5% omf. In both figures, the L* values obtained after washing fastness tests had almost the same L* values as the original fabrics. In Figure 3, the L* values of the yellow dyed fabric samples differed considerably for the original and fastness test-applied samples. The highest L* values were obtained in the original fabrics and the lowest L* values were obtained after the washing fastness test. The washing fastness test caused a considerable decrease in L* values and both the PET and P-PET fabric samples became darker. Besides the washing fastness test, the light fastness test also caused L* values to decrease. The effect of light fastness test on the L* values was more evident at 0.5% and 2% omf dyeings, and the original L* values and L* values obtained after the light fastness test were almost the same at 3% omf.
An overall consideration of the L* values of the three dyes presented in Figures 1–3 implied that darker shades were obtained in P-PET samples depending on the hue of the disperse dye and the applied dyeing concentrations. The discussion of L* values could be made separately for blue and red dyeings in Figures 1 and 2 and for yellow dyeings in Figure 3. The differences between the L* values were more evident in 0.5% and 2% omf dyeings. L*values were usually the same at 3% omf for blue and red dyeings in their corresponding figures (Figures 1 and 2).
Probably because of the original yellowness of P-PET fabric, the L* values of red and yellow dyeings differed considerably between PET and P-PET samples, especially at 0.5% and 2% omf. Besides, for the same reason, the L* values of yellow dyeings were more prone to the effects of washing and light fastness tests at all dyeing concentrations (% omfs).
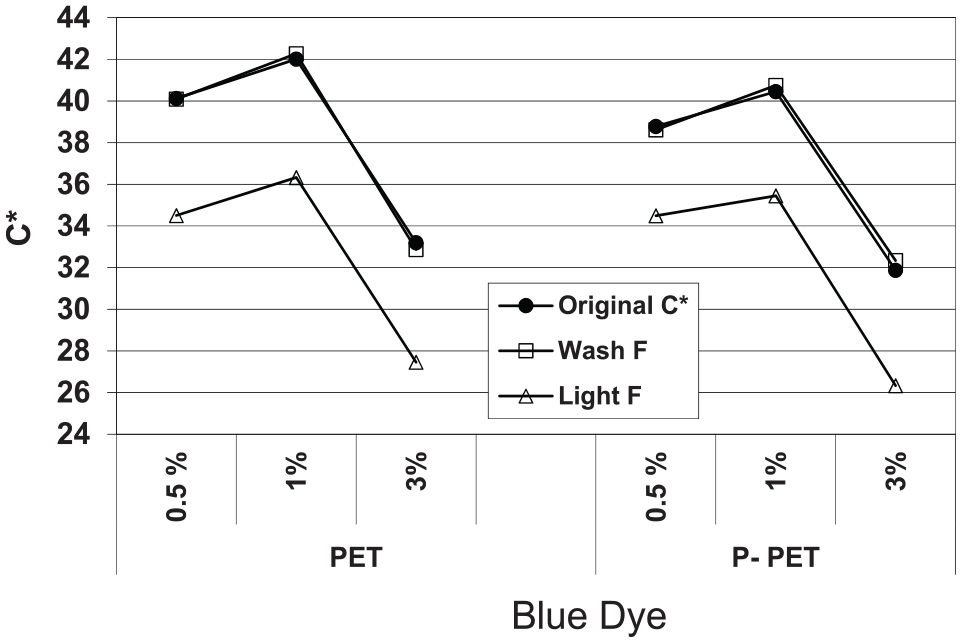
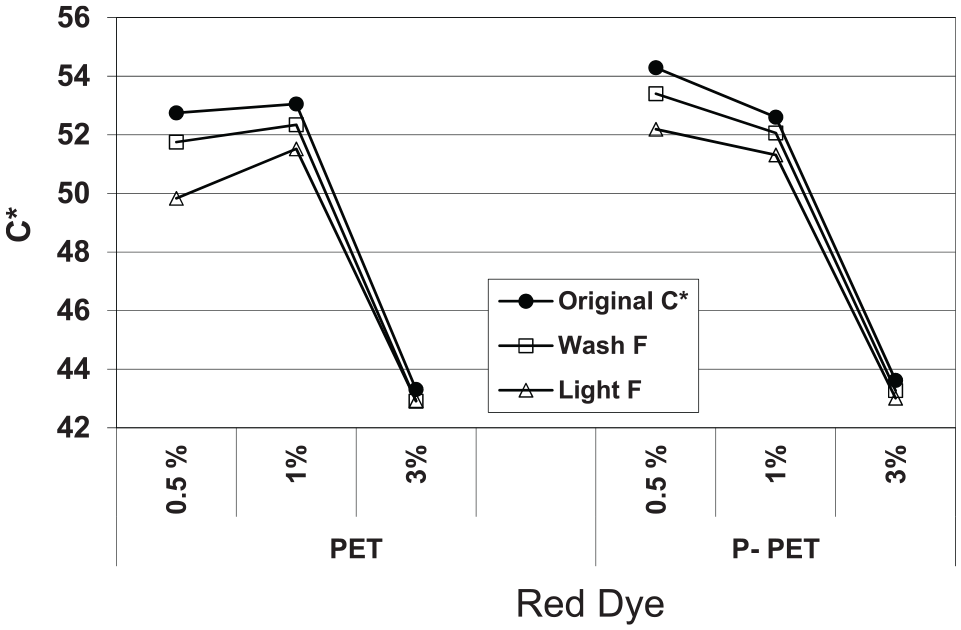
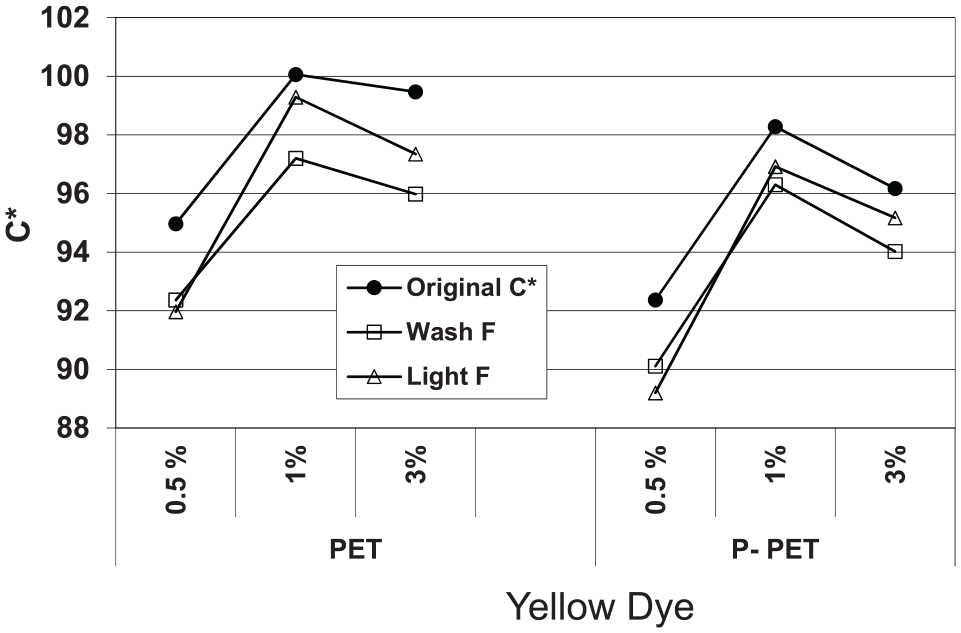
The chroma (C*) values of PET and P-PET fabric samples dyed with blue, red, and yellow dyes at different dyeing concentrations and their corresponding values after washing and light fastness tests are presented in Figures 4–6. Similar to the L* values presented in Figures 1–3, the C* values changed over a wider numerical range between 0.5% and 3% omf dyeings for the blue and red dyed samples than for the yellow dyed samples. The C* values changed considerably in different manners for both the fabric samples, for the three dyes, and for the three dyeing concentrations.
In Figure 4, where the C* values of PET and P-PET fabric samples dyed with the blue dye are presented, the highest and the lowest chroma values were obtained at 1% omf and at 3% omf, respectively. The C* values obtained for the PET samples were slightly higher than the C* values obtained for the P-PET samples. For both the PET and P-PET samples, the C* values of original and washing fastness applied samples were almost the same while the C* values of light fastness applied samples were considerably lower.
In Figure 5, where the C* values of PET and P-PET fabric samples dyed with the red dye are presented, the initial chroma values obtained in P-PET samples at 0.5% omf were slightly higher than those of PET. The C* values obtained at 1% omf were almost the same for both the PET and P-PET samples for original and fastness test-applied samples. Similar to the C* values presented in Figure 4 for the blue dyed samples, the lowest C* values were obtained at 3% omf for both the fabric samples. Also the C* values obtained at 3% omf were almost the same for the original and fastness test-applied samples for the both PET and P-PET fabrics. Red dyed fabric samples, both PET and P-PET, lost chroma when fastness tests were applied. The greatest chroma loses were obtained at 0.5% omf dyed samples and the lowest chroma values were obtained after the light fastness test.
In Figure 6, where C* values of PET and P-PET fabric samples dyed with the yellow dye are presented, the lowest chroma values were obtained at 0.5% omf dyeing concentration for which the result was completely different from the chroma results presented in Figures 4 and 5 for blue and red dyed samples, respectively. In Figure 6, the C* values of the PET fabric sample were considerably higher than those of the P-PET fabric samples, and also the C* values of the original fabric samples were apparently higher than the C* values of the washing and light fastness test-applied fabric samples.
The reason for the disorder that C* values showed between 0.5% and 3% omf dye contents is the formation of an arc on the a*–b* plane of CIELAB color space as dye concentrations increase. 25 The increase in dye concentration results in a decrease in L* values and an increase in K/S values because of the increased concentration of light absorbing dye molecules in the fiber. However, this higher absorption of light does not always result an increase in C* values depending on the coloration properties of individual dyes. The increased dye content in the fiber does not always cause an improvement of the C* values because the decrease in L* values and the increase in K/S values hinder the development of C*values. As the dye content in the fibers increases, the dyed fabric becomes darker, that is, close to black, with a lower C* (chroma). 25
An overall consideration of C* values presented in Figures 4–6 reveals that PET fabric samples generally had higher C* values than P-PET fabric samples, and the responses of the two different fabrics to the dyeing and to the different fastness tests were quite similar. The effect of the original yellowness of P-PET fabric sample was more remarkable when dyeing with the yellow dye in terms of C* values. The C* values of the dyeings with the three dyes formed an arc on the a*–b* color plane. 25 The chroma arcs of the blue and red dyes were considerably different from the chroma arcs of the yellow dye because the lowest C* values were obtained at the highest dyeing concentration of 3% omf. This was probably due to the lower L* values of these two dyes than the yellow dye in Figures 1–3. The effect of the light fastness test on the C* values was more remarkable with the blue dye for both the PET and P-PET fabric samples.
Color strength (K/S) values of PET and P-PET fabric samples dyed with blue, red, and yellow dyes at different dyeing concentrations and their corresponding values after washing and light fastness tests are presented in Figures 7–9. Similar to the L* (Figures 1–3) and C* (Figures 4–6) values, K/S values changed in wider numerical ranges for blue and red dyed samples than for yellow dyed samples. The K/S values of the original fabric samples were higher with P-PET samples than PET samples, and this result revealed that P-PET samples were dyed slightly darker than PET samples with the three disperse dyes although the three dyes had different hues. This result was more pronounced in Figure 8 which shows the K/S values of red dye.
In Figures 7 and 8, where the K/S values of blue and red dyed fabric samples are presented, the K/S values of the original and washing fastness test-applied samples were very close to each other at the three dyeing concentrations while the K/S values of light fastness test-applied samples were considerably lower at 0.5% omf and 1% omf dyeings than the others, which meant that the most important shade difference occurred after light fastness test. The effect of light fastness test on dyeings decreased as percentage (%) dyeing concentrations increased.
Similar to the behaviors obtained in Figures 3 and 6, K/S values of yellow dyed samples in Figure 9 showed rather different changes than blue and red dyed samples. The numerical gap between 0.5% omf and 1% omf dyeings was much greater in P-PET samples than in PET samples. The K/S values obtained at 0.5% omf for PET samples were slightly higher than those of P-PET, but the situation was vice versa at 1% omf and 3% omf dyeings. In addition, the K/S values of washing fastness-applied samples were very slightly higher than the original K/S values at 0.5% and 1% omf. This result was more apparent in P-PET samples.
An overall consideration of K/S values presented in Figures 7–9 reveals that color strength of the dyed samples showed considerable changes according to two fabrics samples (PET and P-PET) and especially with the hues of the dyes used. The color difference (ΔEab*) results between the PET and P-PET fabric samples which are dyed with the three disperse dyes are presented in Figure 10. The dyed PET samples were taken as the reference, and the dyed P-PET samples were taken as the sample in the color difference calculation. The ΔE* results showed different behaviors according to the hues of the dyes. The highest and the lowest ΔE* results were obtained with the red dye and the numerical range was also the greatest for the red dye between 0.5% and 3% omf. The highest color difference between the blue dyed PET and P-PET samples was obtained at 0.5% omf and the lowest was obtained at 3% omf. The lowest color difference between yellow dyed PET and P-PET samples was obtained at 1% omf while the color differences at 0.5% omf and 3% omf were very close to each other. Except for the ΔE* results of red dye at 3% omf, the smallest ΔE* results between the PET and P-PET samples were obtained in dyeing with the blue dye. The higher ΔE* results of yellow and red dyes could stem from the difference between the original undyed colors of PET and P-PET samples and also from the greater yellowness of original P-PET fabric.
The color difference (ΔE*) results between the original and washing and light fastness test-applied samples for the PET and P-PET fabrics and for the three dyes are presented in Figure 11. The dyed samples were taken as the reference and fastness test-applied samples were taken as the sample in the color difference calculation. Generally, the highest color differences were obtained between original dyed and light fastness test-applied samples. The highest numerical gap between ΔE* values after washing and light fastness tests was obtained for the blue dye in both PET and P-PET fabrics. The numerical differences between ΔE* values after washing and light fastness tests were more regular for the red and yellow dyes in both PET and P-PET fabrics. Yellow dye produced the highest color differences after the washing fastness test while blue dye produced the highest color differences after the light fastness test. Besides, blue dye produced the lowest color differences after the washing fastness test. An overall consideration of Figure 11 reveals that the color difference results obtained between the original dyed and fastness test-applied fabric samples were apparently lower in the P-PET fabric sample than the PET fabric sample. This result reveals the better resistance properties of dyed P-PET samples to the chosen two fastness tests of washing and light fastness. The addition of perlite in the fiber caused a rather better resistance to the washing and light fastness tests when compared with regular fibers.
An overall consideration of L*, C*, K/S, and ΔE* values, which are presented in Figures 1–11, reveals that the P-PET fabric had similar dyeing and fastness characteristics when compared with the PET fabrics. P-PET fabric samples were dyed in relatively darker shades than PET samples, and they gradually had relatively lower chroma values than PET samples, except when dyeing with red disperse dye. When the colorimetric results of washing and light fastness tests were considered, it was observed that the color coordinates of P-PET samples showed almost the same deviations from the original dyed fabric samples when compared with the deviations obtained in PET samples. The colorimetric results showed that the selected blue, red, and yellow dyes performed considerably different coloring properties depending on the hue of the applied dye and depending on the applied dyeing concentration. When color differences between original dyed and washing and light fastness-applied fabric samples were considered, P-PET samples had relatively lower color differences than PET samples although they were rather darker dyed.
The color results (Figures 1–11) imply that the fabrics produced from novel P-PET fibers could be used in place of fabrics produced from regular PET fibers. However, the hues of the dyes which are used in coloration must be carefully selected. Dyes with a blue hue have a light reflection band in the blue region (400–500 nm) and an absorption band in the yellow–red region part of the visible spectrum (especially after 600 nm). 26 The blue disperse dye used in this research showed a fairly bad response to the light fastness test; however, its response to the washing fastness test was superior when compared with the red and yellow disperse dyes.
Another point which must be addressed is the intrinsic yellowness of the perlite-added fabrics. The original yellowness of the fabrics could cause unexpected hue shifts after dyeing. Careful laboratory dyeings have to be performed to see the interaction between fabric samples and individual dyes so that pre-designed shades could be produced under mill conditions, right first time.
Conclusion
Perlite-containing polyester fibers are novel polyester fibers. The dyeing, and washing and light fastness properties of conventional and perlite-containing polyester woven fabrics were compared via color measurements in this article. The comfort, acoustical, and water vapor resistance properties were discussed in the former papers.19,20 The perlite-containing polyester fabric had an intrinsic characteristic yellowness. Fabric samples containing regular and perlite-added polyester fibers were dyed with medium energy level blue, red, and yellow disperse dyes. Lightness (L*), chroma (C*), color strength (K/S), and color difference (ΔE*) results were discussed after dyeing and fastness tests. The intrinsic yellowness of perlite-added fabrics influenced the coloration and fastness properties of the fabrics. Perlite-containing fabrics showed similar dyeing and fastness characteristics when compared with regular fabrics. Perlite-added fabrics were dyed in darker color but had lower chroma values than the regular ones. They also had rather better fastness results than regular fabrics when the evaluation was performed in its group itself. The hue of the selected disperse dye was important especially in light of the fastness test. The intrinsic yellowness of perlite-added fabrics must be taken into account for any attempt to dye the fabric to a pre-designed shade. The addition of perlite in the fibers slightly improved their response to washing and light fastness tests.
Footnotes
Declaration of conflicting interests
The author(s) declared no potential conflicts of interest with respect to the research, authorship, and/or publication of this article.
Funding
The author(s) received no financial support for the research, authorship, and/or publication of this article.