
Abstract
Gray water footprint has been widely used as an indicator to quantify the water environmental impact of textile products. Traditionally, gray water footprint values are determined by the largest gray water footprint value of the typical water pollutant. The performances of other critical compounds that coexist in wastewater are disregarded. To mitigate these shortcomings associated with gray water footprint accounting and assessment, an improved gray water footprint calculation and assessment framework is proposed in this study. The diffusion and attenuation process of pollutants in rivers was considered for the comprehensive accounting and evaluation of the impacts caused by various pollutants in discharged wastewater. Polyester fabric production was used to illustrate the application of the improved gray water footprint calculation and assessment method. The results revealed that chemical oxygen demand caused the most severe water eutrophication impact and antimony caused the most severe water ecotoxicity impact. The comprehensive evaluation of improved gray water footprint indicated that alkali peeling process caused the largest water environmental impact during polyester fabric production.
Introduction
From the perspective of production and employment, one of the largest industries in the world is the textile industry. It provides a mass of essential means of production to ensure normal production for other industries, which has played a crucial role in human society. 1 Nevertheless, the textile industry is also considered as one of the most polluting industries in the world. 2 Textile manufacturing is water-intensive and the wastewater pollutants can cause serious ecological damage if not properly treated before discharge into the environment. The textile manufacturing industry’s total freshwater consumption and wastewater discharge, respectively, account for approximately 6.2% and 10.5% shares of all the manufacturing industries in China. 3 China produces 9.25 million tons of polyester fiber, accounting for 60.22% of the global polyester fiber production in 2017. 4 Wastewater generated from the polyester fiber production, polyester fabric dyeing, and finishing processes contains high concentrations of chemical oxygen demand (COD), biochemical oxygen demand (BOD), ammonia nitrogen (NH3-N), and heavy metal antimony (Sb). These pollutants can cause water eutrophication, water ecological toxicity, and other severe water environment impacts.5,6
Water footprint (WF) is a multidimensional indicator of water resource allocation. It consists of three parts: blue WF (surface water and groundwater), green WF (rainwater), and gray water footprint (GWF; polluted water). 7 GWF was proposed from the angle of quantifying water pollution, which can be used to evaluate water environment pollution and the sustainable utilization of water resources. Hoekstra defined GWF as the volume of freshwater required to assimilate pollutant load to the corresponding water quality standard based on the concentration of natural background and the concentration of the existing ambient water quality standards. 8 Quantifying water pollution by the volume of diluted water can be traced back to the 1970s. 9 With the continuous improvement by Water Footprint Network, the calculation method of GWF was unified. 10 A large number of papers that focus on GWF application have been published. Some of the research works explored the GWF assessment of countries and regions.11–13 Some papers focused on the GWF assessment of different industries and products, such as steel industry, 14 textile industry, 15 rice, 16 wheat, 17 dairy products, 18 and textiles.19–21 Summarizing the existing studies shows that GWF caused higher water stress than the blue WF, especially for the industrial sectors. 22 Other studies are focused on the improvement of GWF methodology. Pfister and Ridoutt 23 pointed out the shortcoming of the GWF definition that the decay and removal followed by residence times in water environment were not considered. Gu et al. 24 proposed a three-dimensional model of water quality, water quantity, and time to comprehensively quantify the water environmental impact. Yu et al. 25 proposed an improved GWF method where the water quality index was used to evaluate the water environmental impact of various pollutants from the perspective of water quality. Li et al. 26 used a mass-balance model and fuzzy synthetic evaluation, which considered the self-purification process and the weights of different pollutants, to improve the GWF calculation.
The limitations of current GWF calculation method can be summarized in two aspects. First, the natural water body has certain self-purification capacity to water pollutants. Besides, the GWF is entirely determined by the most typical pollutant, ignoring the variation of water quality caused by multiple pollutants. To address these limitations, this article proposed an improved GWF calculation framework. In the first phase, the dilution and autopurification process of multi-pollutants was considered based on a mass-balance model, while the wastewater was instantaneously discharged into the natural water body. As a result, the quality of each pollutant after dilution and purification can be obtained. In the second phase, the “dilution impact” method was proposed to redefine the GWF value and reflect the co-presence of multiple pollutants, which characterized the impact using the water volume that dilutes the potential impacts on the natural water quality. Then, the improved GWF calculation and assessment method was applied on the WF assessment of polyester fabric production.
Methods and Data
System Boundary
The system boundary provides a specific accounting scope to evaluate the environmental impact of the polyester fabric production. In this article, the system boundary of GWF calculation and assessment is shown in Figure 1. The polyester fabric production mainly involved fiber production, weaving, alkali peeling, refine, and dyeing. The functional unit for GWF calculation and assessment was 100 tons of polyester fabric.
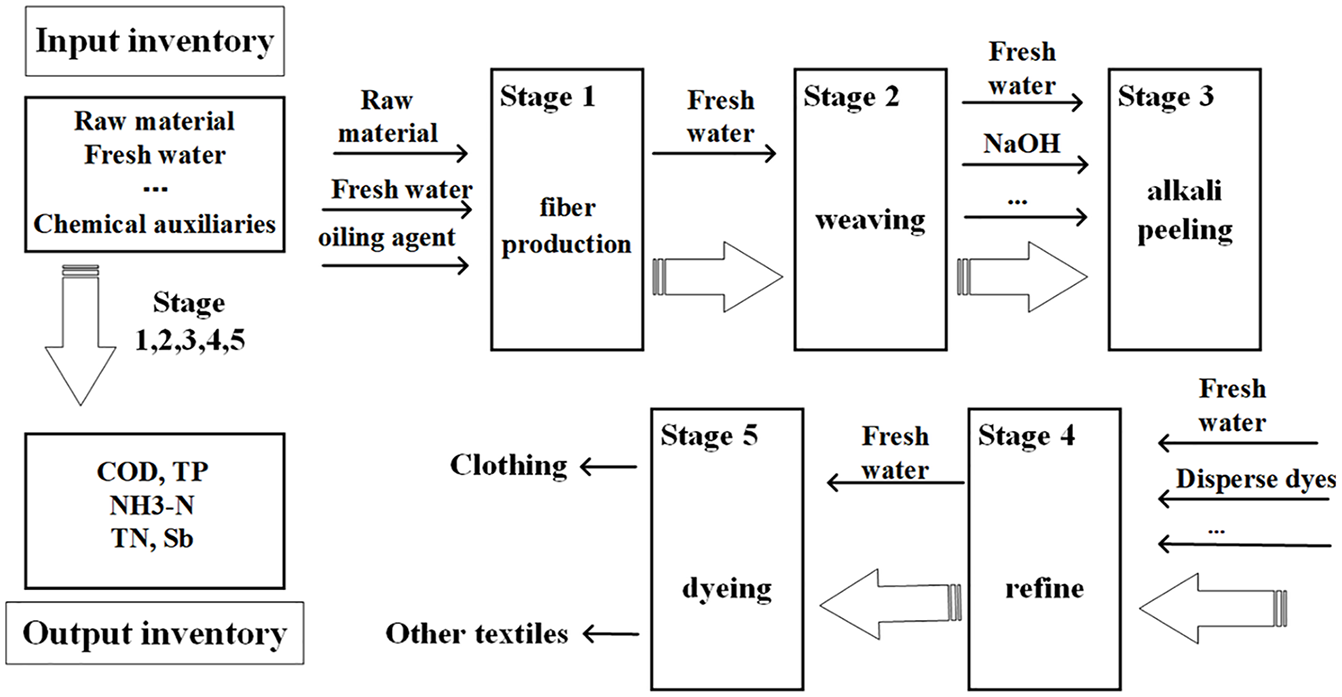
System boundary of the GWF calculation and assessment of polyester fabric.
GWF Calculation and Assessment Method
The framework for the improved GWF calculation approach was divided into two phases: (1) the quality of each pollutant after dilution and purification can be obtained by considering the diffusion and attenuation process of pollutants in natural water body, and (2) the dilution impact model can be applied to quantify the environmental impact caused by multiple wastewater pollutants.
For the calculation of water self-purification ability, both the pollutant dilution and decay processes should be considered. One-dimensional convection–diffusion equation was applied to facilitate the spatiotemporal variation of pollutant concentration in the downstream. The method can be expressed as follows:27,28
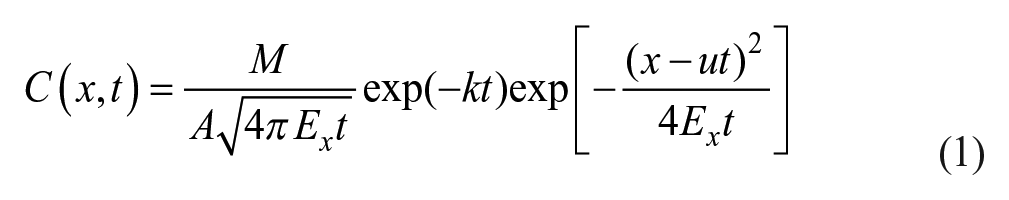
where C(x, t) is the pollutant concentration, mg L−1; x is the flow distance of pollutant, m; t is the time, s; M is the quality of pollutants discharged, g; A is the river width, m; Ex is the diffusion coefficients in the x-direction, m2 s−1; u is the water flow rate, m s−1; and k is the rate constant of pollutant degradation, s−1.
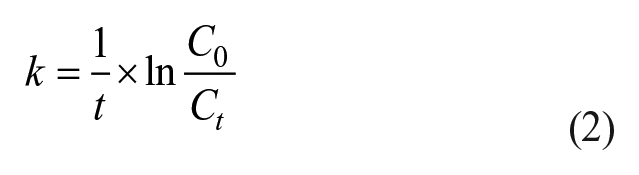
where Ct is the pollutant concentration at time t, while C0 is the initial pollutant concentration, mg L−1.
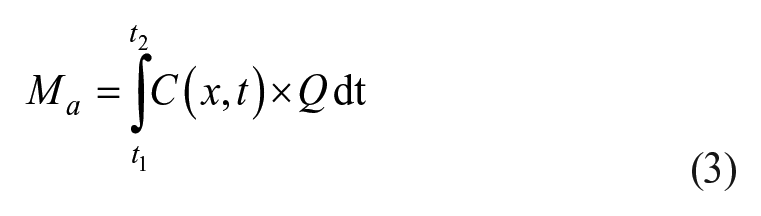
where Ma is the pollutant quality after attenuation, g; t1 and t2 are the arrival and departure times of the wastewater group, respectively, s; and Q is the river runoff, m2 s−1.
Based on the dilution impact, the improved GWF calculation and assessment avoided the neglecting of combination impacts of wastewater pollutants. It can intuitively compare the magnitude of various potential environmental impacts by the diluted water volume.
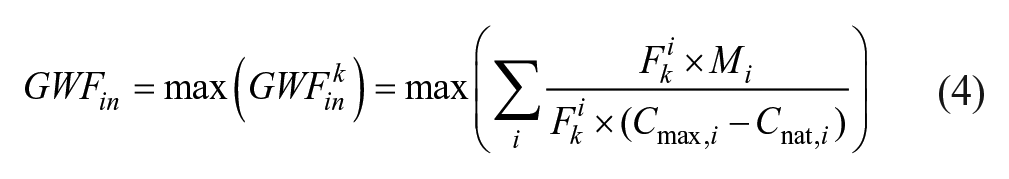
where GWFin is the GWF based on dilution impact, m3; k is the environmental impact category (e.g. water eutrophication, water acidification, and water ecotoxicity); Fki is the characteristic factor of pollutant i, which affected category k; Mi is the quality of pollutant i, kg; Ci,max is the maximum acceptable concentration of pollutant i in the water quality standards, mg L−1; Ci,nat is the concentration of pollutant i in the receiving water body, mg L−1.
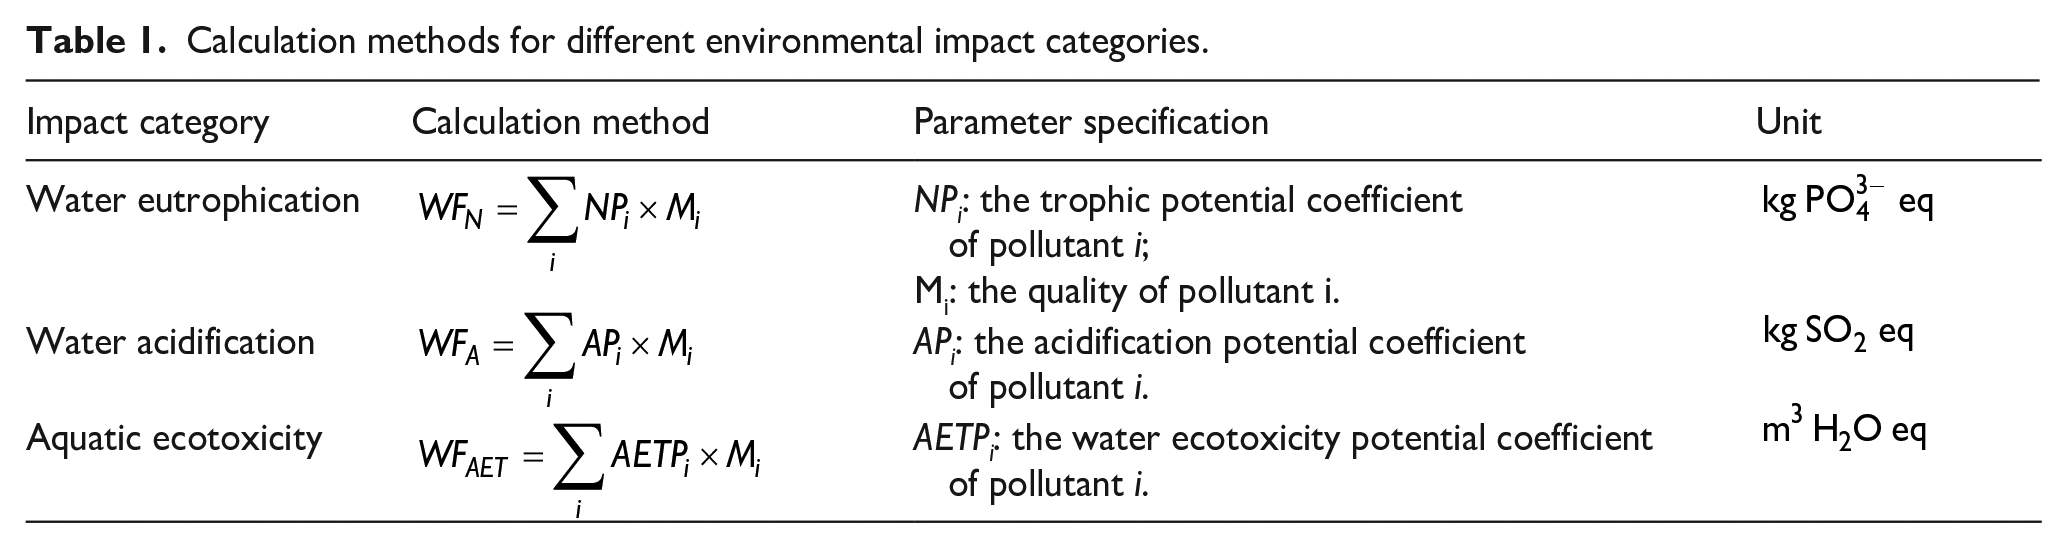
The calculation methods of different environmental impact categories are shown in Table 1. 29
Calculation methods for different environmental impact categories.
Data Collect
In this article, the attenuation coefficient of each pollutant was calculated based on the cross-sectional data of Tangedco section and Cao-e River Sluice (Figure 2). From Xinanjiang section to Cao-e River Sluice section, the total length was about 15 km. The flow rate was about 1 m s−1, the river width was about 223 m, and the runoff was about 70.2 m2 s−1.30,31 The data regarding wastewater and pollutant discharge during polyester fabric production were derived from the second national pollution source survey and the literature.32,33 For water degradation impact calculation, the characterization factors were obtained from the literature, as shown in Table 2. 34
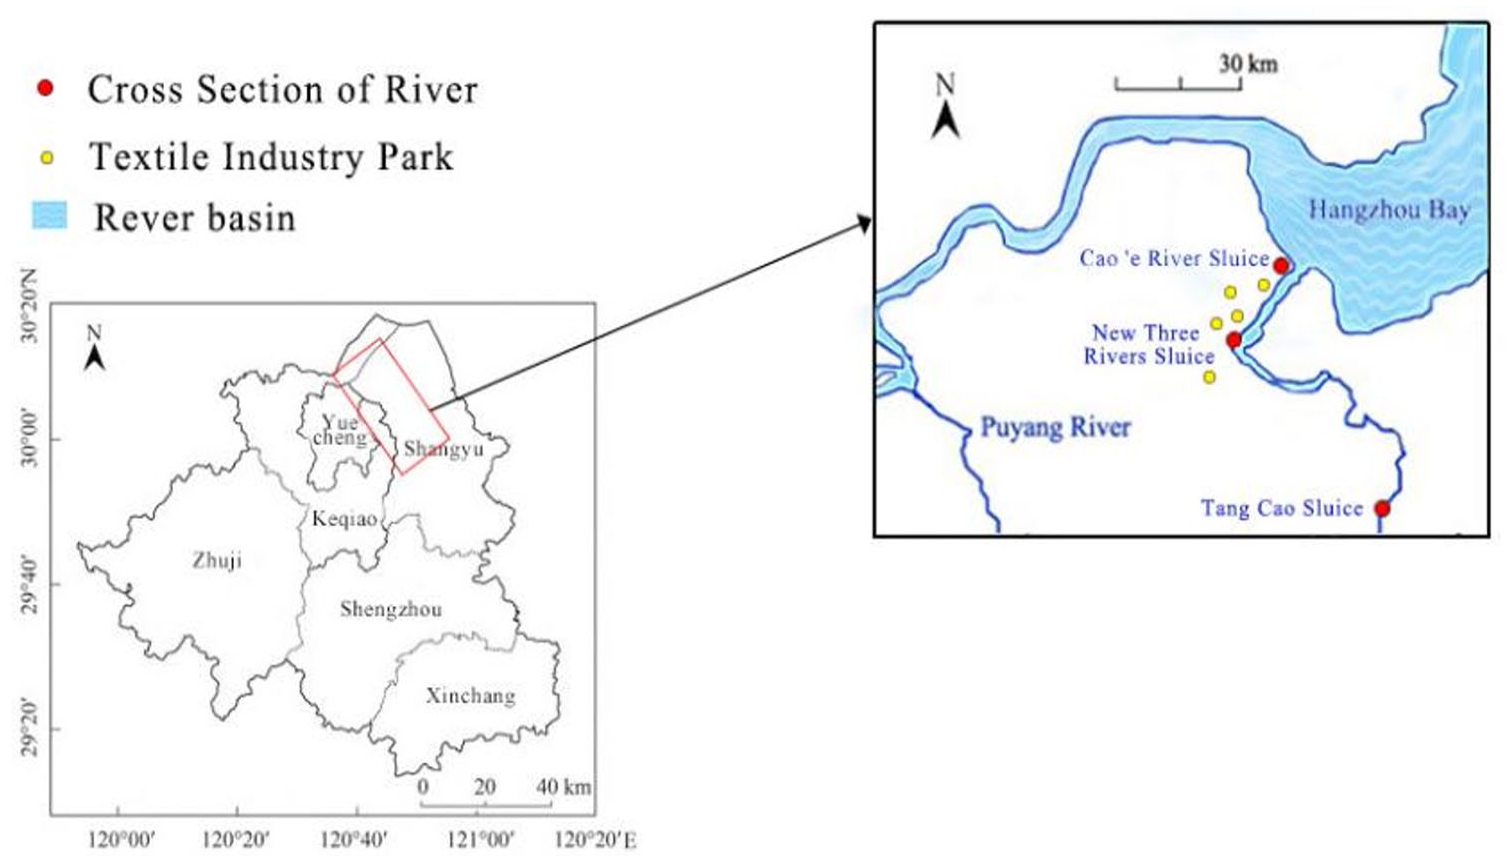
The Cao-e River basin in Shaoxing.
Characterization factors of water degradation impacts.
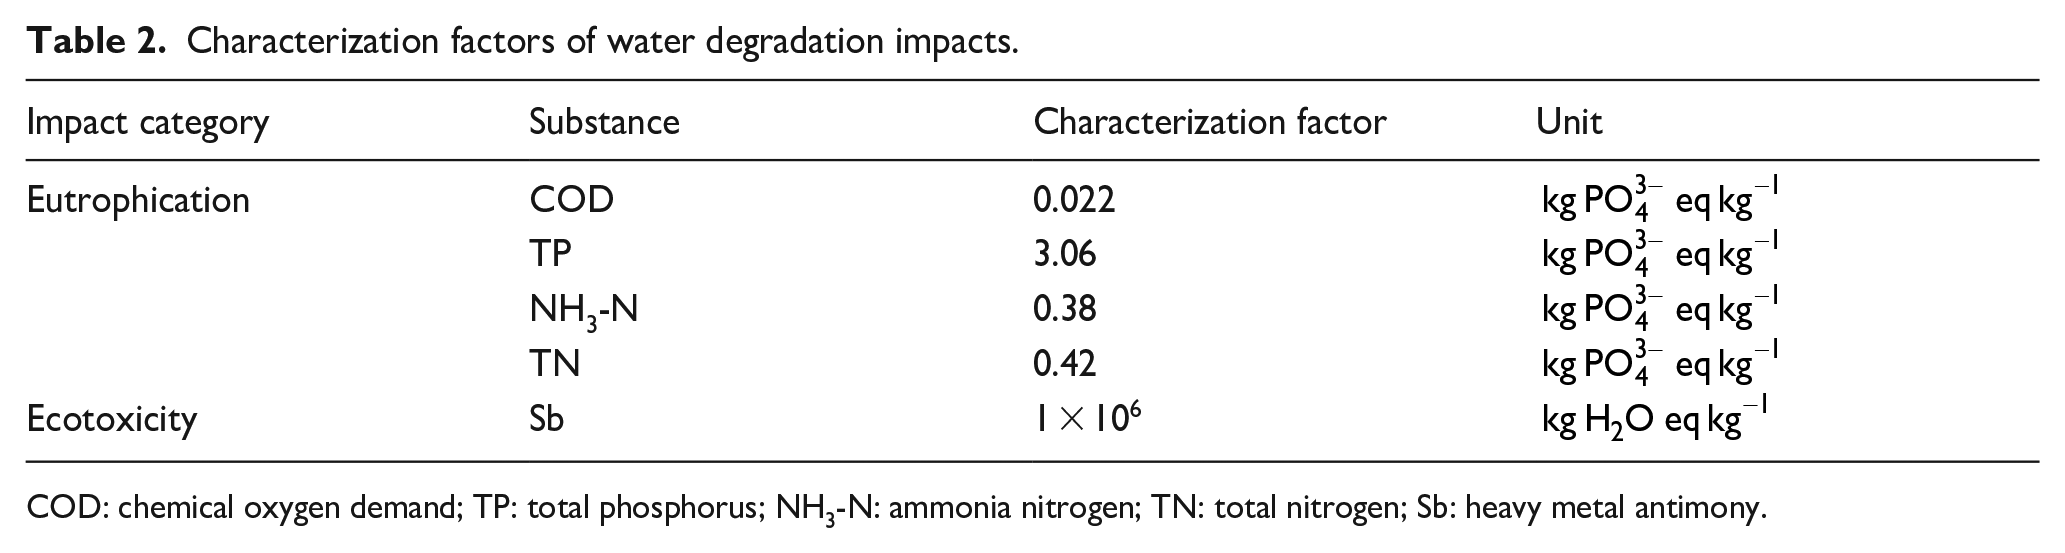
COD: chemical oxygen demand; TP: total phosphorus; NH3-N: ammonia nitrogen; TN: total nitrogen; Sb: heavy metal antimony.
Results and Discussion
Water Degradation Impacts
The calculated water eutrophication footprint results and the water ecotoxicity footprint results of polyester fabric during the major processes (fiber production, weaving, alkali peeling, refine, and dyeing) are shown in Figures 3 and 4, respectively. According to the results, the total water eutrophication impact of functional unit polyester fabric was approximately 9060.908 kg PO3–4 eq. The water eutrophication impact of different pollutants was obviously different. The COD contributed the largest proportion, which accounted for nearly four-fifths of the total water eutrophication impact, followed by total phosphorus (TP), total nitrogen (TN) and NH3-N. Therefore, COD was the priority of water eutrophication impact reduction in polyester fabric production.
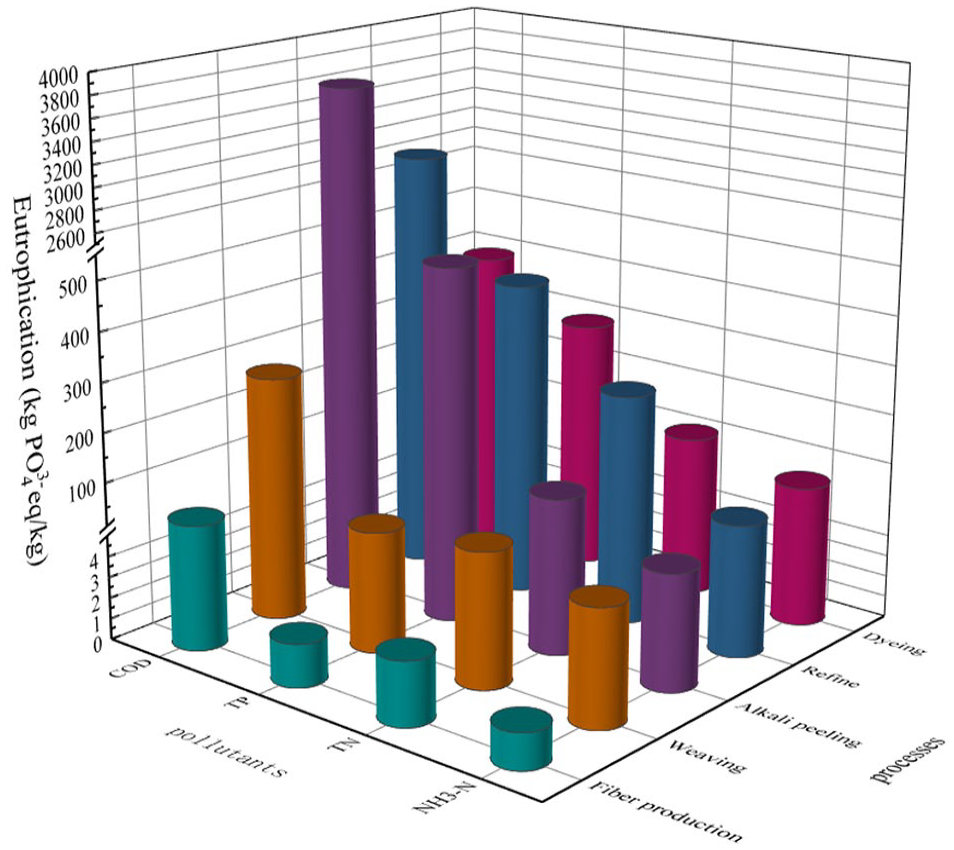
Water eutrophication footprint of functional unit polyester fabric.
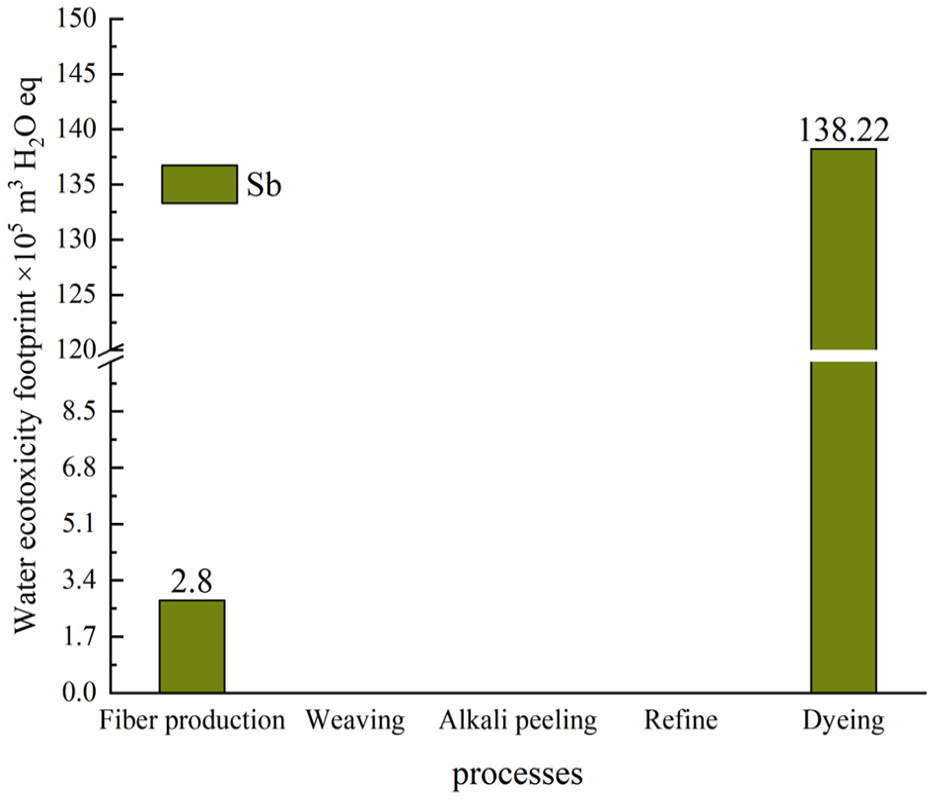
Water ecotoxicity footprint of functional unit polyester fabric.
Among the production processes, the alkali peeling process had the largest water eutrophication impact (4352.19 kg PO3–4 eq), which accounted for 46.94% of the total water eutrophication impact. It was mainly caused by the input of high-concentration caustic soda. The fiber production was proved to contribute the least to water eutrophication impact. From Figure 4, it can be seen that the dyeing process contributed the most to water degradation impact. The water ecotoxicity footprint of dyeing process was 138.22 m3 H2O eq, 49.36 times larger than that of the fiber production process. This was mainly because the Sb in the dyeing wastewater caused a more serious toxic effect on water environment. 35
GWF of Wastewater Pollutants
The degradation coefficients of wastewater pollutants were calculated based on two sections (i.e. the drain outlet and 15 km far from the drain outlet) of the Cao-e River. The GWF of wastewater pollutants in different distances is shown in Figure 5. The COD caused the largest GWF, followed by TP, TN, NH3-N, and Sb in the polyester fabric production. The COD, TP, NH3-N, and TN showed a decaying effect from the drain outlet to the 15-km away section. The degradation coefficients for COD, TP, NH3-N, and TN were 0.39, 0.331, 0.527, and 0.38 day−1, respectively. Therefore, an important conclusion that the river had the strongest self-purification effect on NH3-N, followed by COD, TN, and TP can be drawn.
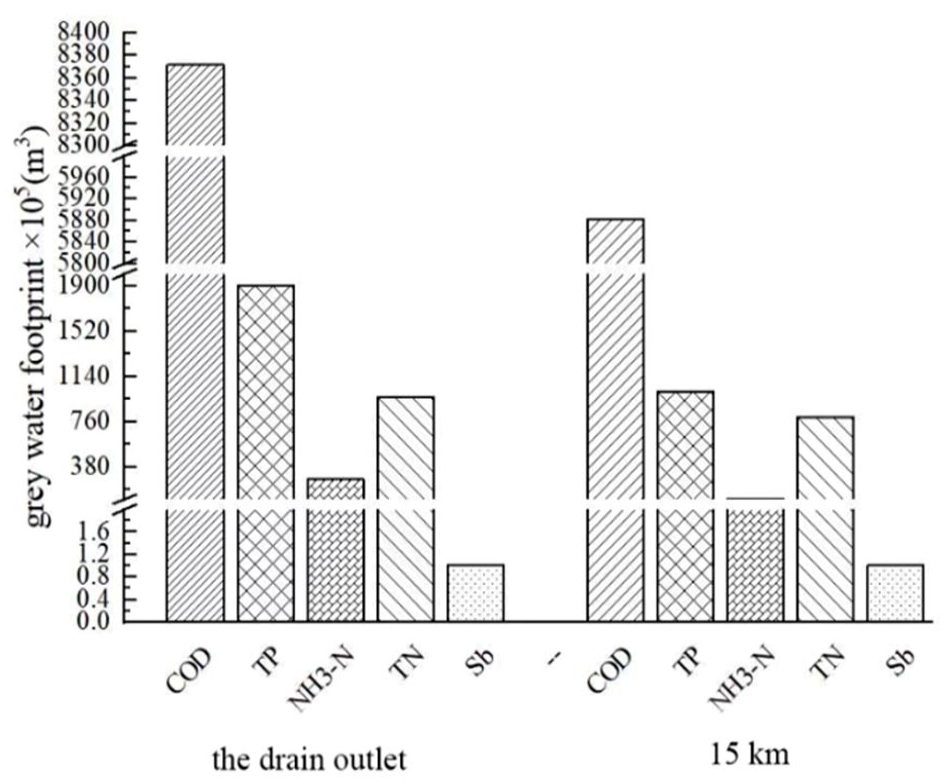
GWF of wastewater pollutants.
GWF of Production Processes
The improved GWF calculation and assessment method had the advantage of considering multidimensional impact indicators and was convenient for a comparative appraisal using the same standard. In terms of the GWF of production processes, it can be seen from Figure 6 that the GWF of the alkali peeling process had the largest GWF and the fiber production process had the smallest GWF among the five production processes. In the wet processes (i.e. alkali peeling, refine, and dyeing), freshwater was the most significant input and COD can be considered as the most peremptory source of contamination followed by TP in the generated wastewater. The wastewater pollutants of the fiber production process were mainly generated from polymerization section and spinning. The weaving process requires water-jet looms in beating-weft and let-off, giving rise to greater wastewater and pollutants than fiber production. 36
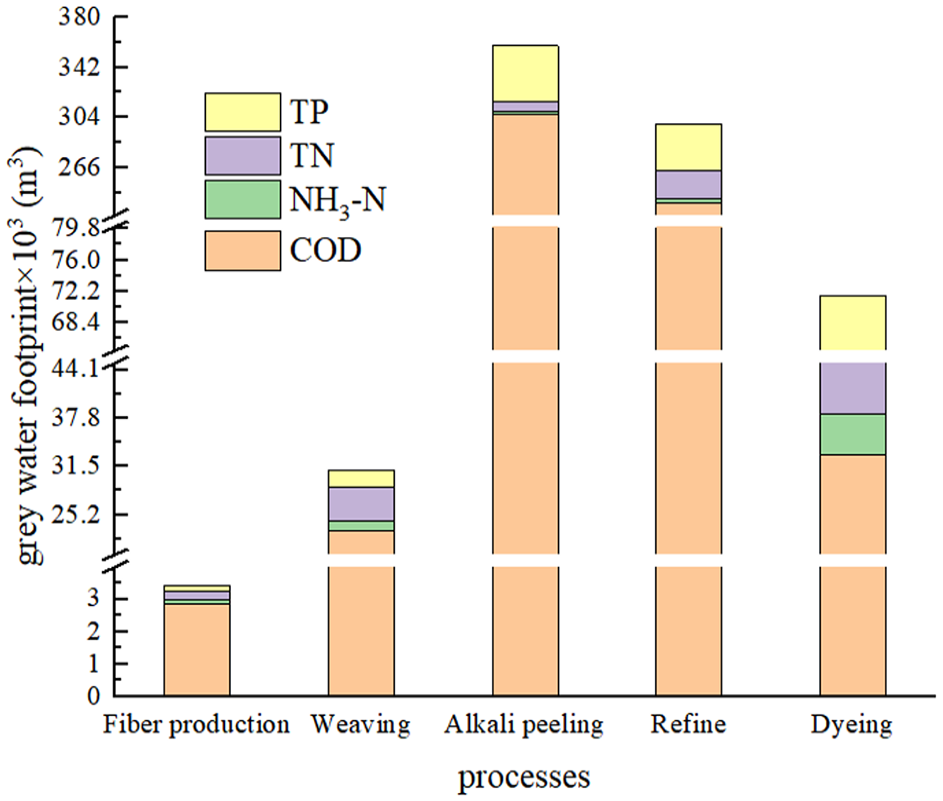
GWF of polyester fabric production processes.
Conclusion
The aim of this article was committed to solving the limitations of conventional GWF calculation and assessment. Based on dilution impact, an improved GWF calculation and assessment model was established and applied in polyester fabric GWF demonstration. The improved model in this study enhanced the scientific soundness of GWF assessments and can describe the existing pollution pressure caused by polyester fabric production.
The environmental impact of 100 tons polyester fabric was assessed based on the improved GWF methodology. The results have demonstrated that water resources load caused by polyester fabric production was mainly derived from water eutrophication (COD, TP, TN, and NH3-N) and water ecotoxicity (Sb). The total GWF of 100 tons of polyester fabric was approximately 7.64 × 10⁵ m3, and alkali peeling was the main polluting process. Among all the wastewater pollutants, COD caused the most severe pollution due to its high concentration and persisting pollution in the water environment.
For the improved GWF calculation and assessment model, the pollution of COD and other non-critical pollutants on water resource is taken into consideration. This makes it more sensitive to the variation generated by non-critical pollutant load, supporting the precise calculation and assessment of GWF.
Although the improved GWF values were lower than those calculated with the conventional method, the water pollution in polyester fabric production was still severe. To relieve the environmental impact caused by wastewater discharge, cleaner production techniques should be applied so as to reduce wastewater generation in polyester fabric production processes.
Furthermore, faced with comprehensive assessment, there are still many challenges when it comes to water pollution by textile production. In future research, efforts are needed to develop a model to consider the adsorption and deposition processes of heavy metals in natural water bodies, making the GWF calculation and assessment more precisely.
Footnotes
Declaration of conflicting interests
The author(s) declared no potential conflicts of interest with respect to the research, authorship, and/or publication of this article.
Funding
The authors are grateful to General Project of Humanities and Social Sciences Research of the Ministry of Education of China (21YJCZH160), Soft Science Research Project of Zhejiang Province (2022C25030), and the Fundamental Research Funds of Zhejiang Sci-Tech University (2021Y008) for providing funding support to this research.