
Abstract
Background
This retrospective review aimed to assess if open payments made by industry arthroplasty companies to physicians and hospital systems were significantly affected by implant type and geographic variation.
Methods
Data was obtained from the Centers for Medicare and Medicaid Services (CMS) publicly available open payment datasets (2016-2019). Geographic locations were identified using regions as defined by the US Census Bureau. A linear regression was calculated to predict the open payment made based on the created variable region, the most used implant type (reverse vs anatomic, n > 30 to be included), and their hypothesized interaction.
Results
A significant regression equation was found for the hypothesized interaction between implant and region, F(13,11 186) = 3.446, P < .0001, with an R2 of 0.005. Within the regression, the implant type alone was not significantly related to the open payment (P = .070) but only became significant when paired with the region in the South (US$5807; P < .0001) and West (US$5638; P = .0012) compared to the Northeast.
Discussion
Our multivariate linear regression model revealed that reverse total shoulder implants were associated with higher open payments, but only within the South and West regions. This indicates that the contributions made by industry arthroplasty companies are a function of both implant and region.
Introduction
The rates of reverse total shoulder arthroplasty (rTSA) procedures in the United States have continued to rise since being FDA approved in 2003.1–4 By 2040, it is projected that shoulder arthroplasty operations will increase by 122% with the largest increase coming from rTSAs by 2025. 4 Anatomic total shoulder arthroplasties (aTSA) also continue to increase in volume,1,3 and fourth-generation designs with shorter stemmed anatomic constructs have produced less invasive procedures.5,6 Although there has been a significant increase in demand for total shoulder arthroplasty (TSA)3,7,8 and physician training opportunities in recent years, 9 there remains geographic variation in access to this care.9,10 The location of qualified surgeons may contribute to these disparities11,12 and may be particularly true of the Medicare population, who have been noted to travel well beyond their geographic regions for TSAs. 9
Implants are reported to account for at least 40% of the overall cost in all types of joint replacement surgeries, 13 with recent literature showing that the primary driver of total inpatient costs for patients undergoing TSA is the implant purchase price. 14 Although the rate of shoulder replacements in the United States has grown rapidly in recent years,1–4 the reimbursements for orthopedic surgeons performing TSAs and revisions have declined. 11 This is thought to be in part due to policy changes aimed at controlling rising healthcare costs such as bundled payment models and improvements in healthcare delivery. 11 Medicare patients have notably benefited from these changes, as their improved access to high-volume arthroplasty surgeons is reflected in this growth. 9 However, despite this progress, significant geographic variation remains regarding implant payments and access to TSA at a national level.9,10
The purpose of this study is to analyze trends in physician-industry payments of TSA implants and geographic locations from recent years (2016-2019). The healthcare landscape in the United States is rapidly evolving, and an understanding of the interplay between geographic location, implant type, and open payments is crucial in understanding the relationship between industry and physicians performing TSAs. An analysis of these recent trends will help to inform policy makers on the current delivery of TSA care in the United States and how this is affected by the implementation of healthcare payment models. We hypothesized that the total amount reported by Medicare/Medicaid is significantly affected by not only the implant type, but also by geographic region.
Materials and Methods
Data was downloaded from the Centers for Medicare and Medicaid Services (CMS) publicly available datasets containing open payment information from 2016 to 2019. 15 The financial contributions made to covered recipients (physicians, nonphysician practitioners, and teaching hospitals) are defined by CMS as direct payments, indirect payments made through an intermediary third-party, or other transfers of value. Open payments are defined as the physician-industry-related financial disclosures reported by pharmaceutical/medical device manufacturers and their distributors. Reporting entities also select how the open payment or other transfers of value are categorized. This can fall under general, research-related, or ownership/investment information. Of note, CMS reports on its website that these designations are open to individual interpretation. 15
Due to the public nature of this database, Institutional Review Board approval was not required to conduct this study and no further randomization was necessary. The dataset contains 75 variables, such as geographic indicators, and our areas of interest were geographic location, total open payment by Medicare/Medicaid, year, degree of recipient, and implant brand (both anatomic and reverse for all implants). Due to the database's high amount of variation in implant utilization, our inclusion criteria required that there be at least a sample size of 30 implants to be included in this study for the purpose of sample size in our statistical analysis. Additionally, each implant had to include a reverse and anatomic counterpart, and had to be designated as “reverse,” “anatomic,” or “shoulder.” This also allowed for the identification of implants from the list provided by CMS, which sorted them by these product names. We excluded any implant that was not explicitly labeled as such or did not meet our desired sample size. Our search yielded the following manufacturers and devices: DJO
®
AltiVate® (DJO Surgical, Austin, TX), Zimmer Biomet® Comprehensive® (Zimmer Biomet, Warsaw, IN, USA), and Zimmer Biomet® Trabecular Metal™ (Zimmer Biomet, Warsaw, IN, USA)
The dataset was initially analyzed for the variables of interest using basic descriptive statistics (counts, range, mean, and median). An additional variable for identifying geographic region was created using the US Census Bureau defined regions 16 with the addition of 2 regions (Region 5 and Region 6) to include military peoples and US territories (GU, PR, and MP) based on the provided state/territory of the payment recipient included within the original database. These regions (Figure 1) were defined as Region 1 (Northeast), Region 2 (Midwest), Region 3 (South), and Region 4 (West). Univariate analyses of continuous variables were analyzed with Student's t-test. Significance was analyzed using a linear regression model containing the hypothesized interaction term between implant type and the created variable “region.” Significance was determined at a P-value of <.05 in all instances. All analyses were conducted using RStudio Version 1.3.959. 17

Regional open payment and use of reverse (r) and anatomic (a) total shoulder arthroplasties (TSAs) (US$, number of implants [n]).
Results
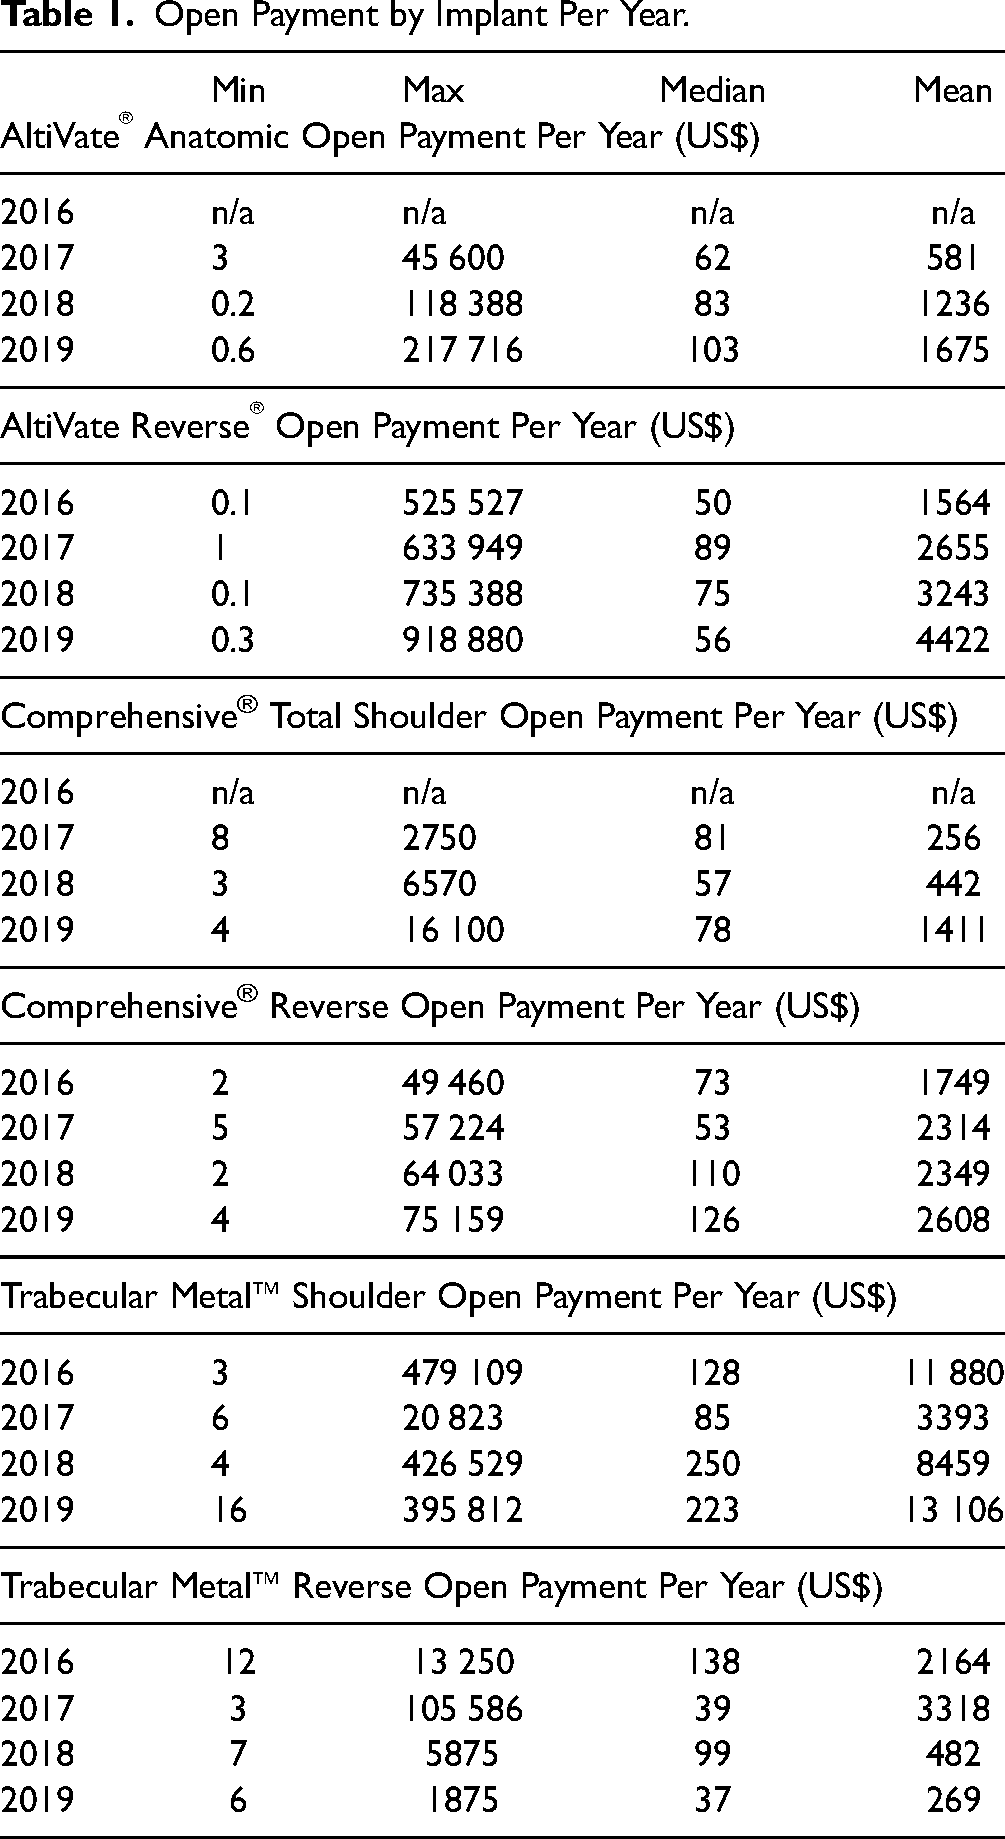
There were a total of 3235 (28.9%) anatomic shoulder implants and 7965 (71.1%) reverse shoulder implant open payments submitted to the CMS database between 2016 and 2019 for the 3 brands of interest (DJO® AltiVate®, Zimmer Biomet® Comprehensive®, and Zimmer Biomet® Trabecular Metal™). During this time, the mean open payment by Medicare/Medicaid for all anatomic shoulder implant brands was US$1747, and for all reverse shoulder implant brands was US$2659. Univariate analysis with Student's t-test demonstrated a significant difference between the 2 (P = .030). Of these payments, 10 329 (92.2%) were made to allopathic physicians and 871 (7.7%) to osteopathic physicians. Open payments for individual years and brands are found in Table 1.
Open Payment by Implant Per Year.
A multivariate linear regression was calculated predicting total open payment based on the created variable region, implant type (reverse vs anatomic), year, degree, and the hypothesized interaction of implant type and region. A significant regression equation was found, F(13,11 186) = 3.446, P < .0001, with an R2 of 0.005. The full model and regression coefficients can be found in Table 2. The implant type alone (reverse vs anatomic) was not significantly related to the total open payment (P = .070). However, our hypothesized interaction between region and implant type was significant for the South (P < .0001) and West (P = .0012) compared to the Northeast. These interaction terms showed a mean increase in open payment by US$5807 and US$5638 for the South and West regions, respectively.
Linear Regression Modeling Total Open Payments by Medicare/Medicaid (US$).

Abbreviations: rTSA, reverse total shoulder arthroplasty; aTSA, anatomic total shoulder arthroplasties; DO, doctors of osteopathy; MD, doctors of medicine.
ref: reference variable; Region 5 was excluded from the analysis.
Regions were defined as Region 1 (Northeast), Region 2 (Midwest), Region 3 (South), and Region 4 (West).
Only the year 2019 was significantly associated with total open payment, demonstrating a mean increase of US$1910 (P = .0062) compared to 2016. There were significant differences between the South (P = .011) and West regions (P = .019) compared to the Northeast, with a mean decrease in total open payment of US$ −3012 and US$ −3445 in the South and West regions, respectively.
Lastly, the regression revealed that doctors of osteopathy (DO) were significantly (P = .018) related to total open payment. A DO degree showed a mean decrease in total open payment of US$ −2132 compared to doctors of medicine (MD).
Discussion
Our study compared all open payments reported by CMS for both rTSA and aTSA implants from 2016 to 2019 and revealed a significantly higher total open payment for all reverse implant brands compared to all anatomic implant brands in univariate analysis (P = .030). Medicare reimbursements for surgeons have recently declined as part of an effort to control healthcare costs in the United States with more emphasis on value-based care. 11 In particular, joint replacements have been the focus of these cost-reduction efforts, as elective orthopedic procedures represent the largest component of Medicare spending. 13 Industry relationships represent another means of surgeon financial compensation, which is often out of proportion to the small specialty size. 18
Increased industry-wide costs of rTSA over aTSA implants are well established13,19 and may reflect the increasing demand for rTSAs,1,4 improved patient outcomes, 20 or the active industry patents with an anticipated expiration date of 2028. 21 However, our multivariate analysis has expanded on this and revealed that there was no significance for implant type alone, but rather only with implant type in specific regions. Additionally, there was a significant mean increase in the total open payments made for TSA implants in 2019 (P = .0062), further supporting the need to study the industry–physician relationship underlying this recently growing procedure.
In 2010, the Dartmouth Atlas of Health Care found significant variations in TSA utilization both within and between individual states across the nation. Utilizing Medicare data and hospital referral regions, the authors demonstrated a difference in TSA rates of up to 10-fold in some regions and chose to compare these rates by city. 10 The 2000 to 2006 data used in this study did not include a complete examination of rTSAs as they were not FDA-approved until 2003. 3 A more recent 2018 analysis of geographic variability also examined Medicare data from 2012 to 2014 using hospital referral regions and found that despite an improvement in patient access to TSA care with high-volume case-load providers, there was still significant geographic variability present. 9 Our study may explain this, as we demonstrated significant regional differences in open payments and implant utilization of rTSA and aTSA from 2016 to 2019. This indicates that the total open payments made by industry arthroplasty companies are a function of both implant and region.
Total hospital costs are commonly driven by implant price, 22 and our findings suggest that regional industry–physician relationships may further affect rising inpatient costs. 14 These interactions were noted to be significant in the South (P < .0001) and West regions (P = .0012) compared to the Northeast. Potential contributions to this geographic variation may include racial 9 or socioeconomic 11 disparities in access to procedures 23 or a disproportionate volume of surgeons available to patients in each region.9,11 Moreover, the understanding of possible contributors such as implant pricing, procedure volume load, and physician–hospital collaboration will be crucial in guiding future policies that improve the regional delivery of quality TSA care and improve negotiating abilities regarding CMS approval of outpatient procedures.11,13,22,24,25
Our study also revealed an increase in total open payments for both aTSA and rTSA implants from 2016 to 2019. The projected TSA demand and resulting sales patterns3,4,7,8 may conflict with existing cost containment measures or the degree status of the operating surgeon. 11 In our analysis, operations performed by surgeons with a DO degree received significantly lower total open payments (P = .018, US$ −2132) compared to MDs. Additionally, more payments were made to MD (10 329) than DO (871) surgeons during the time of study. This suggests that the type of medical training may also affect the implant utilization behavior of practicing surgeons. 18 The Orthopaedic Census Survey reported just over 30 000 allopathic orthopedists in the United States at the time of publication in 2018. 26 The American Osteopathic Academy of Orthopedics website reports over 1900 members, with 192 practicing in the Northeast, 422 practicing in the Midwest, 349 practicing in the South, and 201 practicing in the West. 27 Future research may consider the practice distribution of DO and MD surgeons when seeking to control for sampling biases.
Strengths of this study include a comprehensive statistical analysis of recent large-volume CMS data to compare the most utilized aTSA and rTSA implants. Limitations of this study include the absence of patient outcomes in the data provided by CMS. While large, the CMS database may only be relevant to orthopedic surgeons within the United States. We were also only able to include 3 manufacturers due to the limited sample size of all other devices which further limited the generalizability of the study. Additionally, the information reported to CMS may contain inaccuracies and the full definitions of the open payments and their sources may not be all inclusive. Examples of this can be seen in the wide range of minimum and maximum values seen in Table 1. The resulting difficulty in being able to fully assess specific payment trends for implants is due to a lack of transparency and existing nondisclosure agreements of contracted purchase prices among vendors and hospitals.13,25 The disclosure of relationships between physicians and hospitals with industry is crucial to preventing conflicts of interest and allows closer examination of indirect compensation.28,29
Furthermore, the linear regression model developed demonstrates the significant association between our stated predictors and the outcome, but it cannot be interpreted as a predictive equation. It is evident that the predictive value of this equation is minimal as reflected by the R2 value. However, this does not diminish the significance of our findings. Rather, it reflects that there is a large variance in the payment data, which makes the prediction of the total payment more difficult. Finally, Region 5 (military) is not included in the tables as there were no patients for this group reported from 2016 to 2019 but was included in the final analysis for the sake of completion.
Conclusions
CMS reported open payments for the selected aTSA and rTSA implants increased from 2016 to 2019 and demonstrated regional and open payment variation. Our multivariate linear regression model demonstrated that implant type (reverse vs anatomic) correlated to increased open payments, but only within the South and West regions. This indicates that the total open payment by CMS for the implant is a function of both the implant and region. In anticipation of growing volume, transparency of industry–physician relationships must remain a priority in shoulder arthroplasty care.
Footnotes
Author note
Omar H Rizvi is currently affiliated with Department of General Surgery, Dignity Health East Valley Hospital, Chandler, Arizona.
Declaration of Conflicting Interests
The author(s) declared no potential conflicts of interest with respect to the research, authorship, and/or publication of this article.
Funding
The author(s) received no financial support for the research, authorship, and/or publication of this article.