
Abstract
The One Nation One Ration Card (ONORC) scheme started in India in 2019—with all states on board since mid-2022—enabling interstate portability of the public distribution system (PDS) for migrants to access subsidised foodgrains. This article reviews the progress of the policy so far, compares interstate PDS portability with intrastate PDS portability, and identifies key ONORC districts where offtake appears to be occurring frequently. It documents the limited traction of interstate PDS portability with less than half a million monthly transactions, in stark contrast to over 20 million monthly transactions being conducted under the umbrella of intrastate portability. Both demand- and supply-side factors appear to be at work in constraining the ONORC interstate PDS portability at present and easing these constraints could substantially increase the adoption of the benefits. These measures include better stock management at fair price shops considering the intra-year seasonality of migration and focus on specific migration corridors through publicity campaigns targeted towards migrant workers.
Introduction
Over the past decade and a half, a new policy discourse on internal migration in India has emerged that recognises the inevitability of rural–urban migration, and the need to facilitate safe migration and respond to migrant needs in destination regions (Deshingkar & Farrington, 2009; Government of India [GoI], 2017a, 2017b; Rajan & Bhagat, 2021; Tumbe, 2018). This new policy discourse on internal migration in India came on the back of a long-standing Gandhian notion implicit in development policies, of curtailing rural–urban migration by promoting rural development. This ideal went against the most stylised fact of economic development, that as societies become richer they also urbanise, as people choose to live in towns and cities. Thus, in the new policy discourse, academic and civil society organisations have pushed the government to recognise the urgent need for the portability of welfare benefits for internal migrants (GoI, 2017a, 2017b). In one interpretation, the lack of interstate portability of welfare services was also seen to be a major barrier to interstate mobility (Kone et al., 2018).
Of all the potential benefits that can be made portable, the access to subsidised foodgrains (rice and wheat in particular) under the ambit of India’s public distribution system (PDS) has received maximum coverage. The PDS is a major cornerstone of India’s welfare state and following the National Food Security Act (NFSA), 2013, covers around two-thirds of India’s population, with beneficiary households identified by the respective state governments and union territories (Khera & Somanchi, 2020). As per the NFSA website (
Historically, people could access the PDS only at the place where their ration card was registered, which was typically their birthplace. This meant that when people moved for work and spent many months away from home, they lost access to the PDS and, hence, access to subsidised foodgrains. The past decade has witnessed the growth of portable PDS at the intrastate and interstate levels, the latter more commonly known as the One Nation One Ration Card (ONORC) policy, launched in 2019. While there have been dozens of studies on the PDS (George & McKay, 2019), there have been only three studies so far that have looked at aspects of ONORC interstate PDS portability. The first study was released in April 2022 by a consultancy firm that surveyed nearly 6,700 low-income households and 1,500 PDS dealers across five states—Rajasthan, Jharkhand, Andhra Pradesh, Uttar Pradesh and Karnataka—to ascertain ground-level challenges of the policy (Dalberg, 2022). The second study analysed the ONORC transaction-level data in considerable detail until July 2022 (Agrawal & Agnihotri, 2022). The third study focused on several operational aspects of the ONORC (Paliath & Iqbal, 2023). Cumulatively, these three studies have shed light on different aspects of the ONORC policy.
This article extends this nascent literature in several ways. First, we analyse both intrastate and interstate PDS portability at the state and district levels. Intrastate portability has not been systematically studied so far due to the paucity of data and because the administrative data became accessible only in 2023. We also look at intrastate portability in detail for the state of Maharashtra, where the state government has released granular data. Second, we analyse ONORC interstate transaction-level data through October 2023. It is, thus, the first study that uses data for a full year since all the states were onboarded onto the ONORC. Further, this study provides a granular understanding of where ONORC offtake is currently concentrated by focusing on districts. We do so by collating and analysing transaction-level data downloaded from the Integrated Management Public Distribution System (IMPDS) website (
The rest of the article is arranged as follows. First, we study the migration patterns revealed by the Census of India 2011 in terms of the distribution of migrants by intra-district, intrastate and interstate movements to ascertain the potential scope for the portability of PDS. Against this, the PDS portability numbers are presented to highlight areas where PDS portability can be enhanced. Next, we analyse intrastate portability in the state of Maharashtra, where monthly data for more than a year is publicly accessible. Subsequently, we analyse the ONORC statistics on interstate portability in greater detail. Finally, based on our analysis, we outline the current weaknesses of the ONORC policy and suggest ways in which the policy may be strengthened.
Migration and PDS Portability
While NFSA 2013 lists the scope of PDS activities in terms of the target population, no such guidelines exist for the portability of PDS. It is, however, possible to define reasonable ranges on migration magnitudes to ascertain the scope of PDS portability. The most recent official database on migration in India is the Periodic Labour Force Survey (PLFS) with a reference period of July 2020–June 2021. However, because its reference period was during the national lockdown, which drastically altered migration patterns, we do not use it in our analysis. For instance, while Census 2001 and 2011 showed roughly 7 per cent of all male migration to be urban to rural, this figure was over 20 per cent in PLFS 2020–2021 because of the mass return migration caused by the COVID-19-induced lockdown. On several other key migration indicators, the PLFS 2020–2021 showed little change as compared to the National Sample Survey of 2007–2008. Given the limitation of the PLFS 2020–2021 database, we use the Census 2011 database for our analysis.
The Census of 2011 revealed that there were 450 million internal migrants in India, around a third of the population. Much of this migration was female migration for marriage, which perhaps does not affect PDS portability as much as migration for work. The 41 million who migrated for work and employment were divided somewhat equally between intra-district, inter-district within same state and interstate migrants (Table 1).
Migration Magnitudes (in Millions) as per Census 2011.
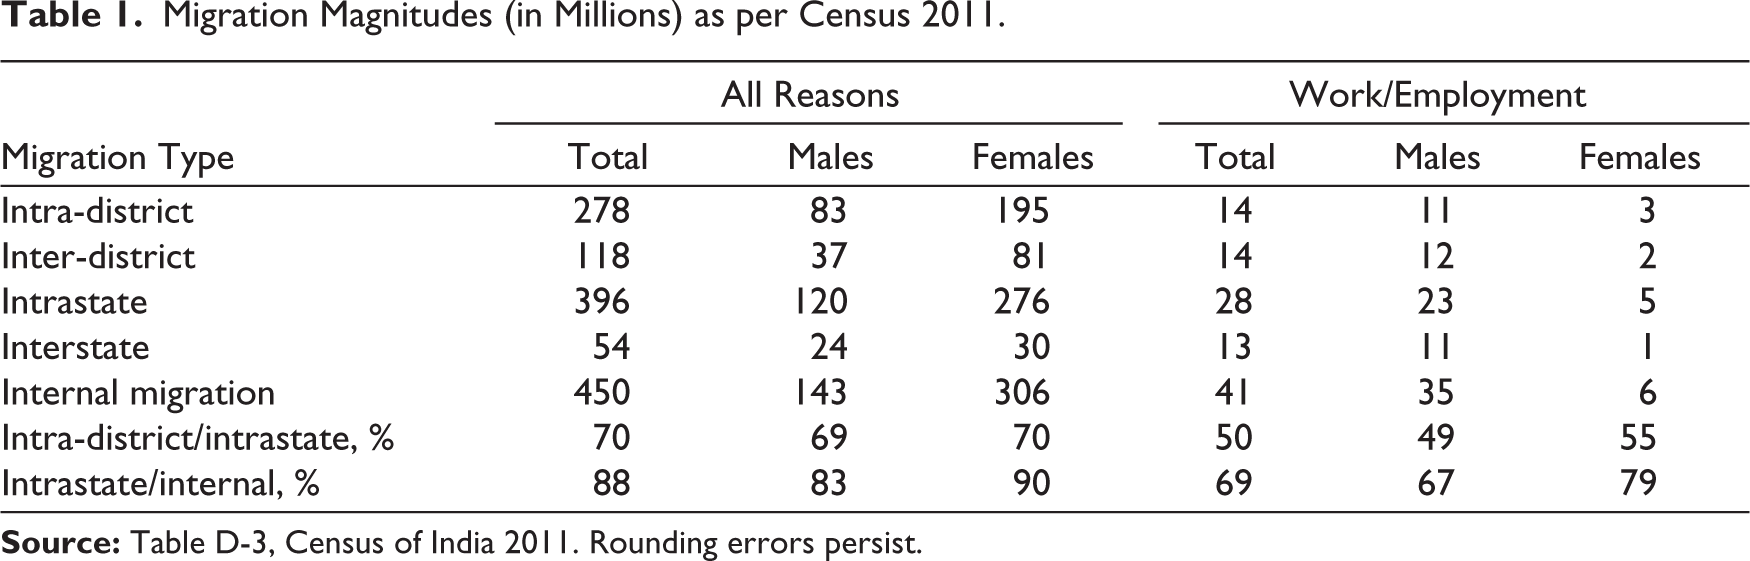
Census migration magnitudes for work have been shown to be serious underestimates, and alternative estimates place 20–30 per cent of the total workforce to be largely circular in nature, which means that migrants often straddle their lives between two places, mostly the village and the city (GoI, 2017b). That would translate to over 100 million migrant workers, much more than the 41 million figure of Census 2011. While the census may underestimate the true extent of work-related migration, it is still valuable in providing a distribution of migrants. The split between intrastate and interstate migration was 88:12 for all migration and 69:31 for work and employment-related migration. Within intrastate migration, the split between intra-district and inter-district was 70:30 for all migration and 50:50 for migration for work and employment. These ratios are useful to keep in mind as we turn to the PDS portability data.
Table 2 provides an aggregate picture for 30 states and union territories that comprise over 95 per cent of the Indian population with information from the IMPDS website for the month of September 2023. It excludes Delhi, Chandigarh, Punjab, Jharkhand, Manipur and Puducherry. It shows transaction data in three categories: regular, intrastate and interstate. The latter two categories correspond to portable PDS. In September 2023, there were 168 million PDS transactions corresponding to 165 million transacted ration cards and 3.7 million metric tonnes of foodgrain offtake. The foodgrain offtake was in terms of wheat (30%), fortified rice (43%), rice (25%) and coarse grains (2%). Nearly 90 per cent of these transactions were by priority households (PHH) and the remaining by Antyodaya Anna Yojana (AAY) beneficiaries who belonged to the poorest of the poor.
PDS Portability Data for 30 States and Union Territories, September 2023.
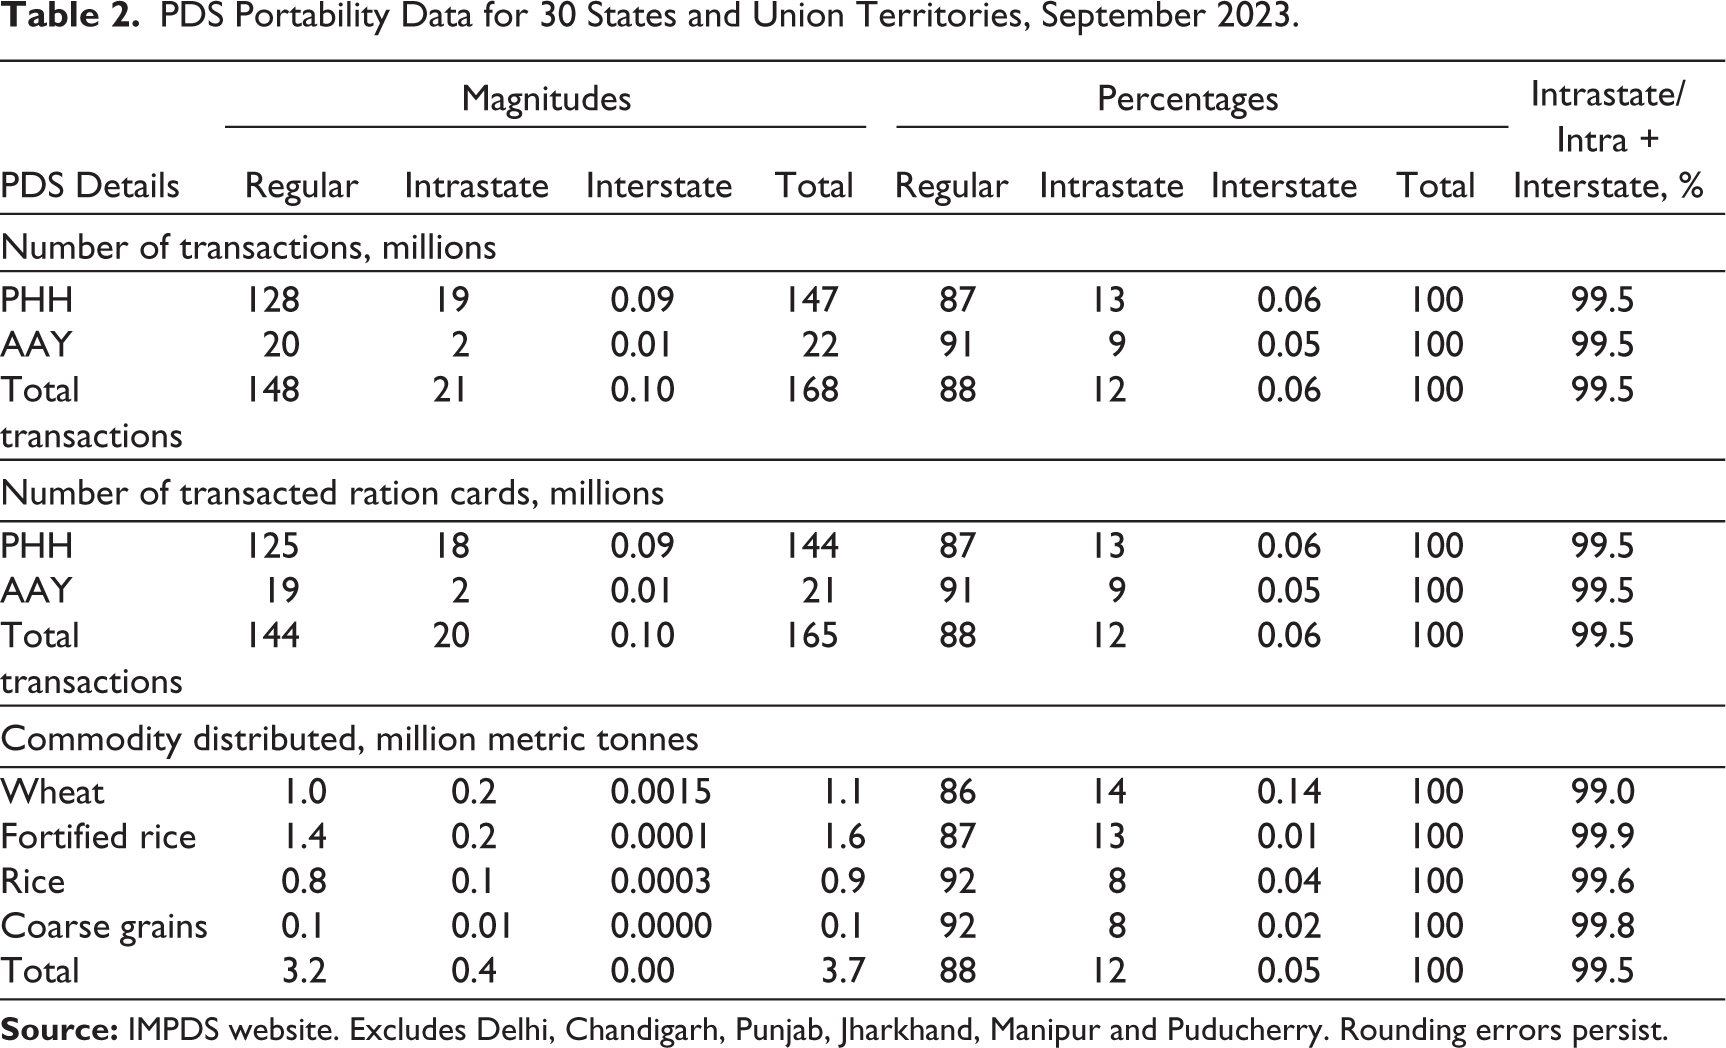
Of the 168 million transactions, 148 million or nearly 90 per cent were categorised as ‘regular’ and the remaining were portable. Of these, around 21 million transactions were intrastate and a minuscule 100,000 transactions were classified as interstate, but this excluded the data for Delhi. As we will see later, the number of interstate transactions including Delhi for September 2023 was closer to half a million, but even that does not change the picture substantially as interstate monthly transactions were under the 1 million threshold. Among portable transactions, the ratio of intrastate to interstate transactions was 99.5 to 0.5, and if Delhi is included, it would be 98:2. This is clearly different from the 88:12 split in total internal migration and 69:31 split in economic migration seen earlier. A clear implication is that intrastate PDS portability has taken off far more successfully in India than interstate PDS portability. There is, therefore, an enormous potential for interstate PDS transaction volume to grow in India. If the range for intrastate PDS portability is 20–30 million monthly transactions, then even a very conservative 90:10 split would suggest the potential for 2–3 million monthly interstate transactions, of which currently less than 25 per cent is being served.
Table 3 provides the migration splits across states and union territories of India in 2011 along with urbanisation rates and economic migration (migration for work and employment) rates. Unsurprisingly, there is a strong correlation between urbanisation rates and the economic in-migration rates. The share of population that is economic migrants was above 10 per cent in urban enclaves such as Delhi, Chandigarh, and Daman and Diu. Almost all economic migration in those places was interstate. Among the large states, some of the relatively richer states, such as Gujarat and Maharashtra, have a lower share of intrastate economic migration in total internal economic migration (around 60%–65%) compared to some of the relatively poorer states such as Bihar and Uttar Pradesh (over 80%).
Intrastate and Interstate Migration Patterns in India Across States as per Census 2011.
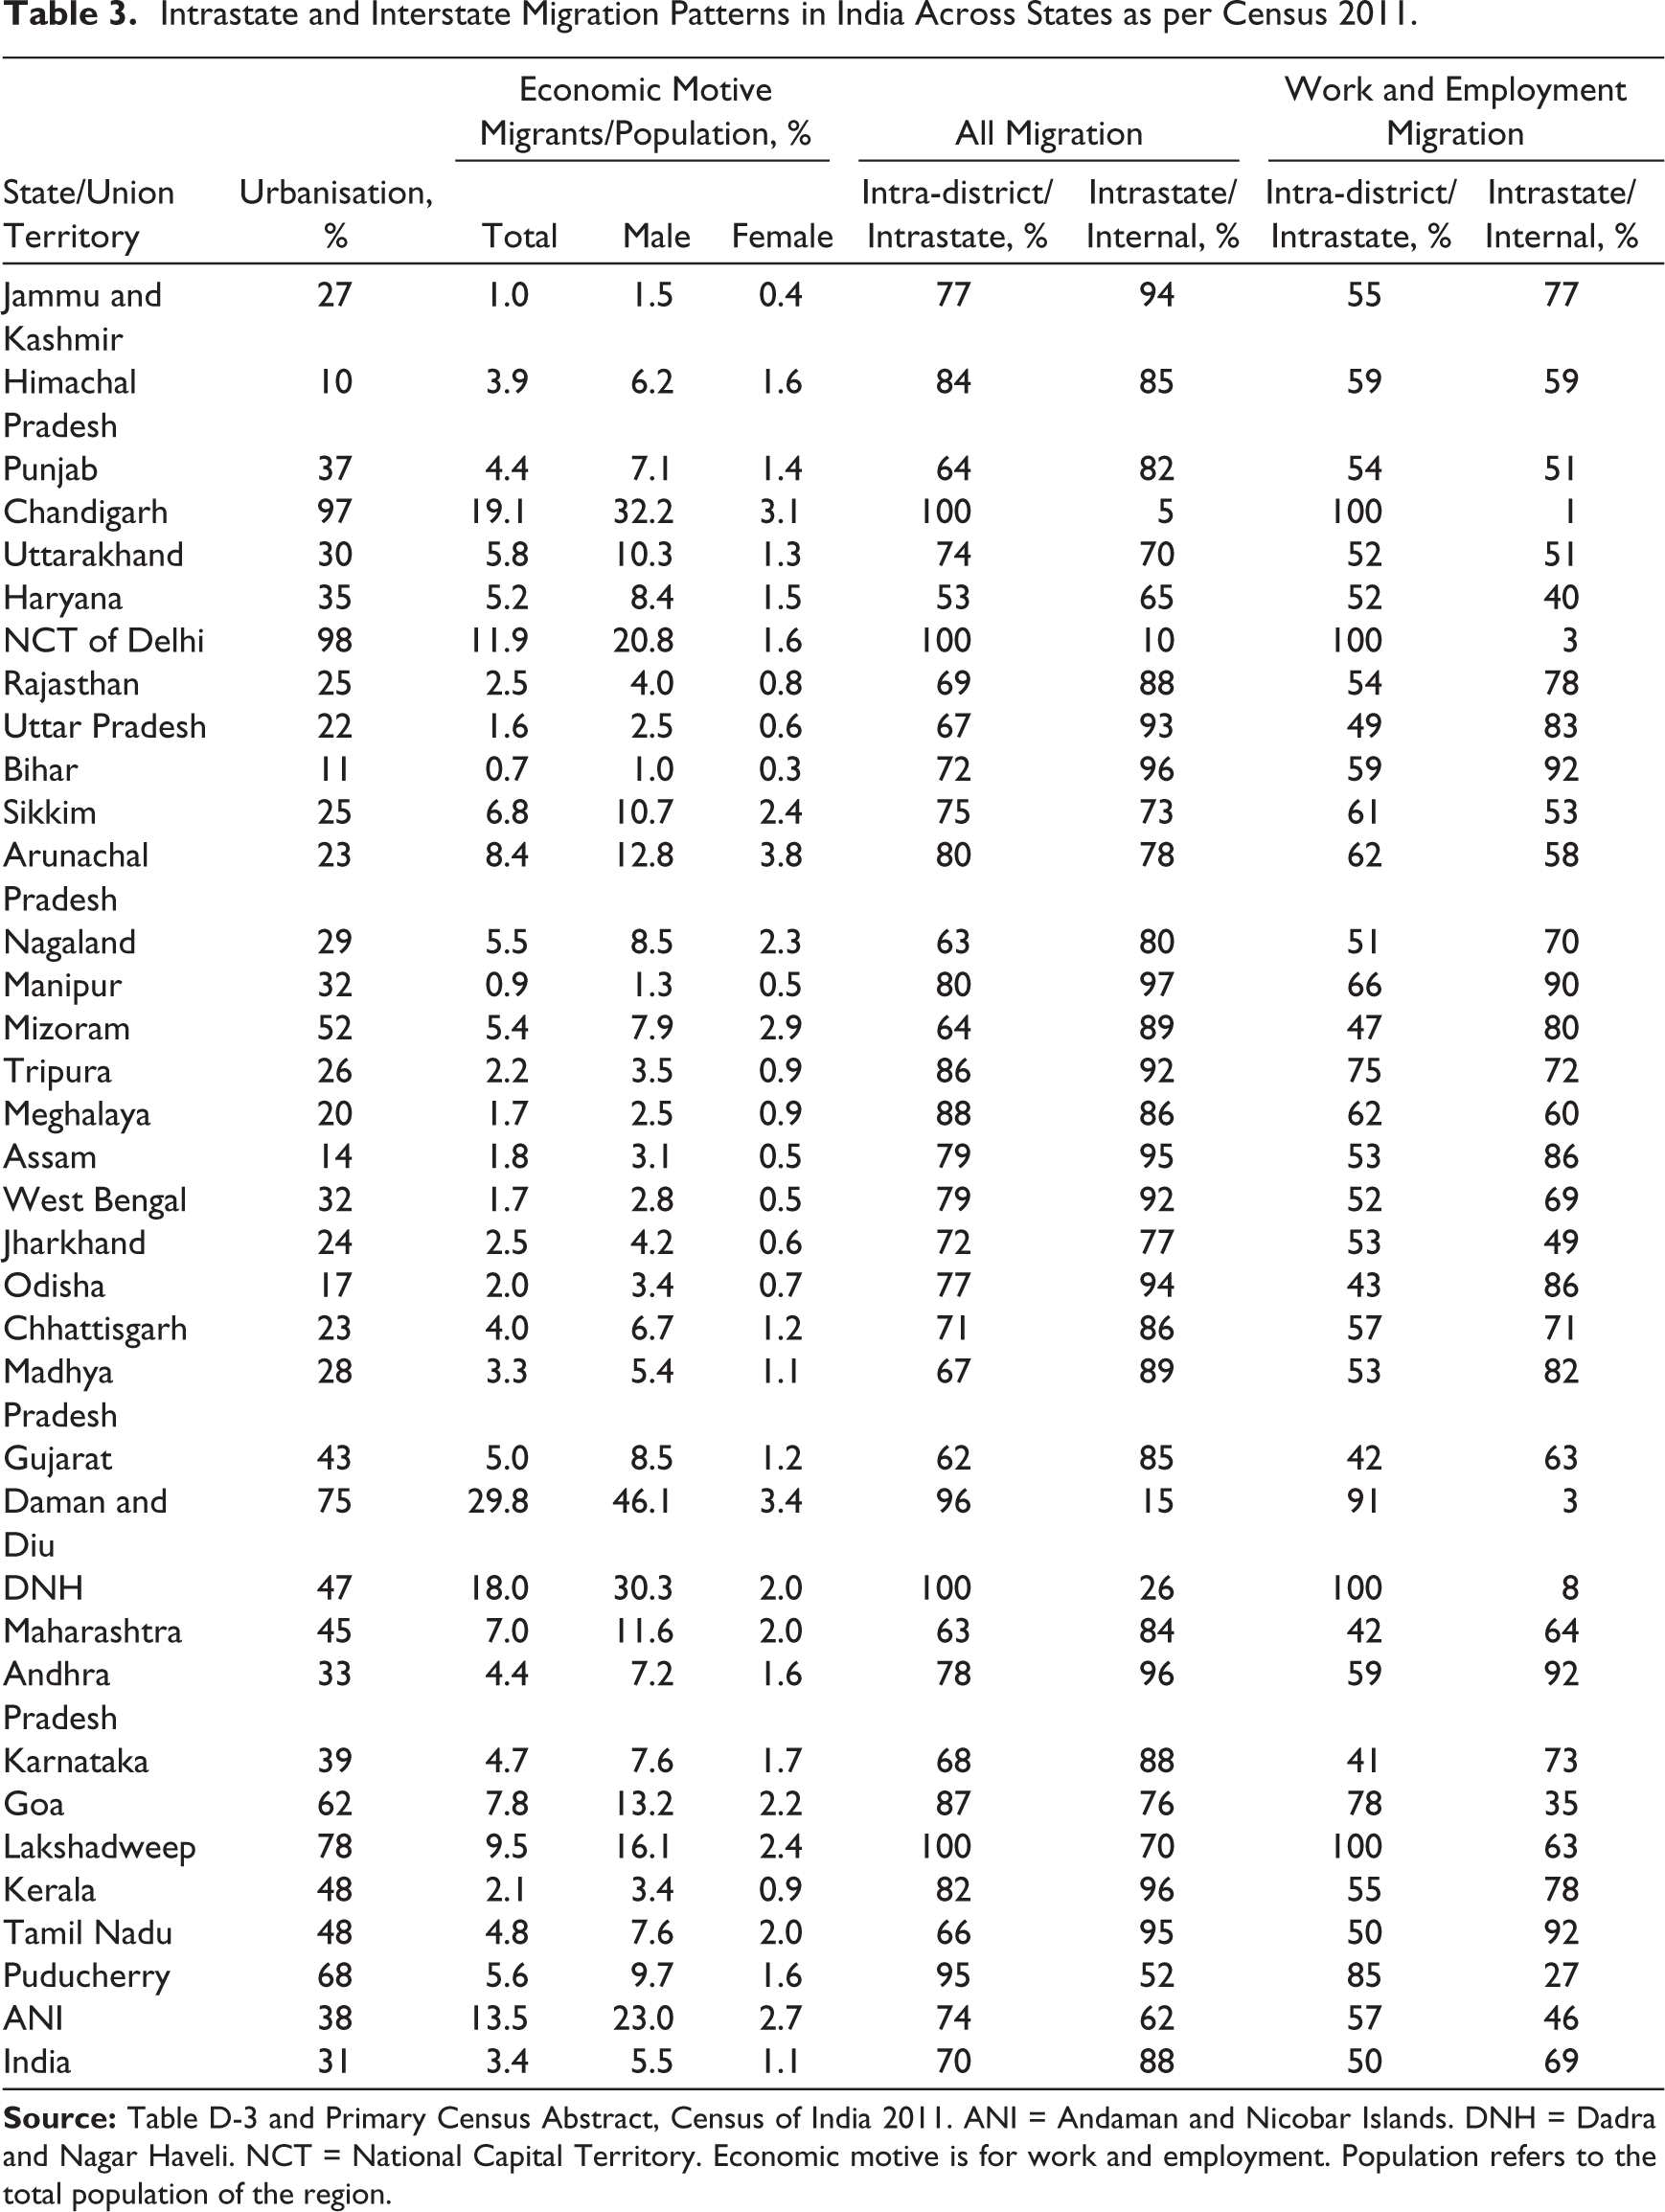
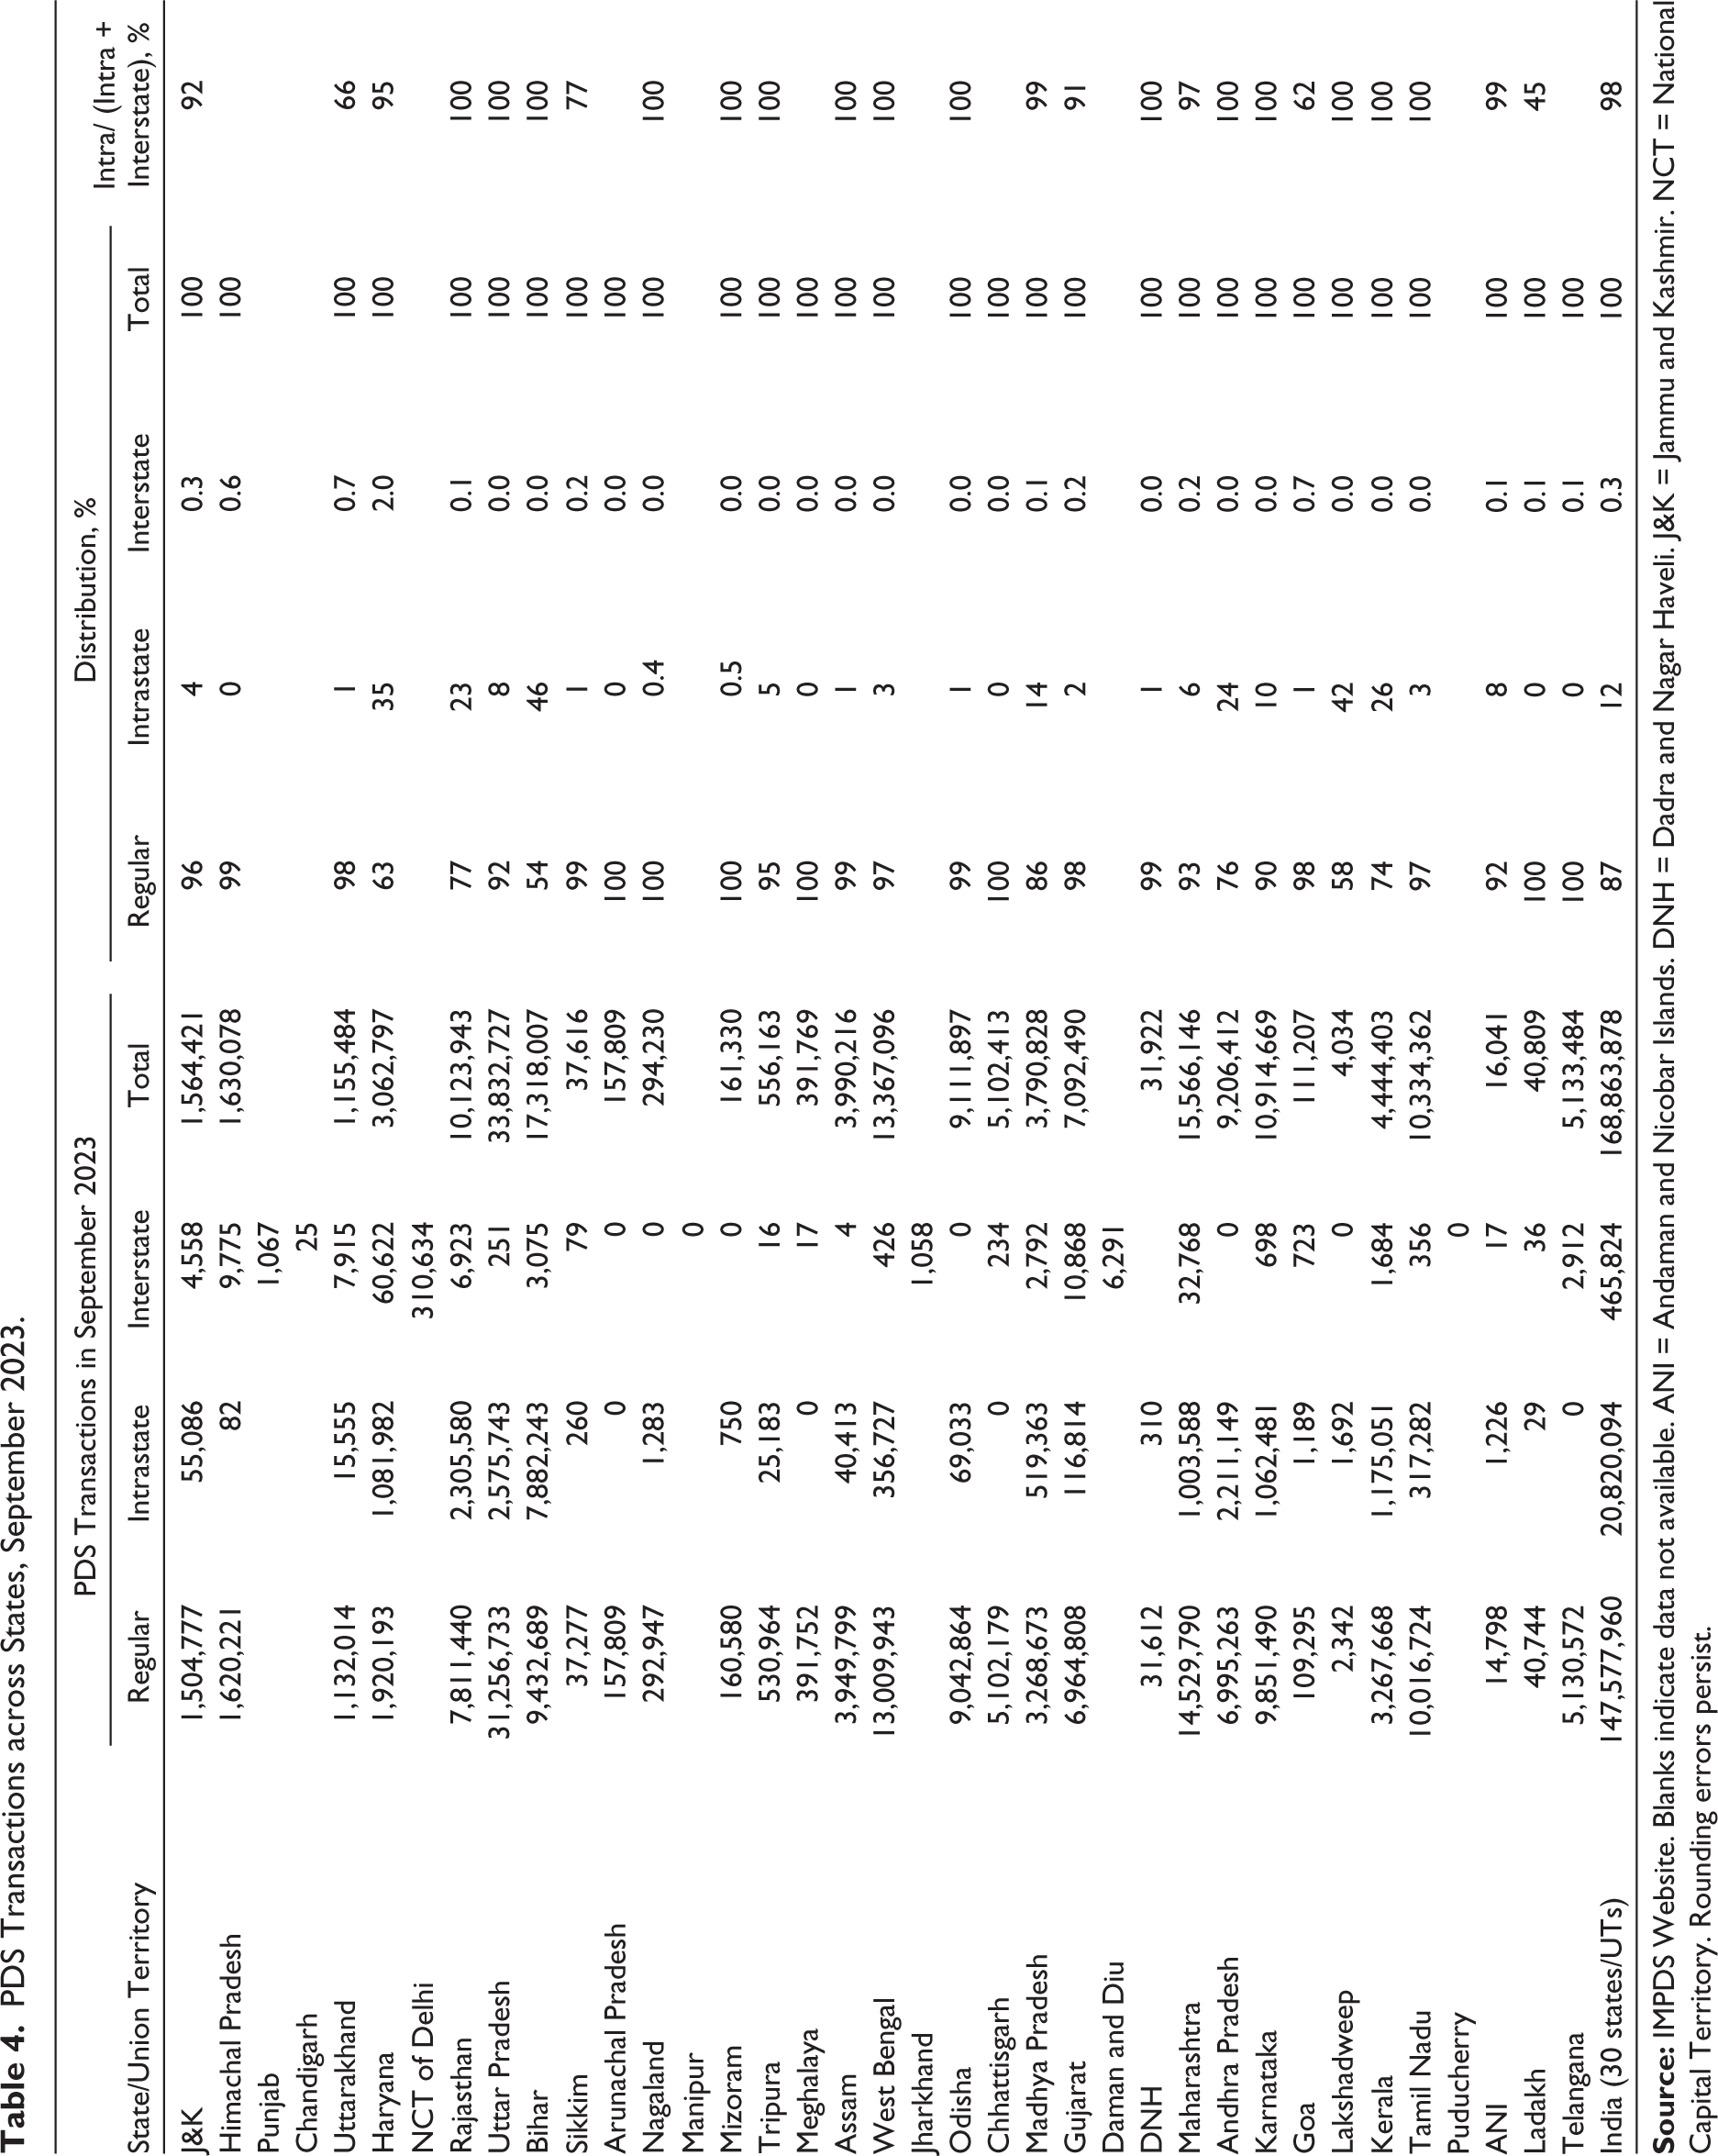
Table 4 shows the PDS portability numbers for the 30 states and union territories where data was available (with interstate data for Delhi added in). At over 300,000 transactions, Delhi alone accounted for 67 per cent of all interstate ONORC transactions in September 2023. Haryana was ranked second at 61,000 transactions, followed by Maharashtra at 33,000 and Gujarat at 11,000. These four states accounted for 90 per cent of all interstate ONORC transactions and, while they are known as states of in-migration, the variation across them does not match their migration magnitudes. For instance, Maharashtra, which hosts Mumbai and Pune with many interstate migrant workers, should see far more PDS ONORC offtake than Haryana. South Indian states also witness considerable in-migration but ONORC appears to have failed there with only a few hundred transactions reported. Chandigarh is another place where ONORC has failed. Table 4 also shows that for most states, interstate offtake is minuscule compared to the intrastate offtake. A comparison of Tables 3 and 4 shows that currently, the interstate ONORC does not follow the logic of migration, work-related or otherwise, and reflects serious operational constraints that are hindering its progress. In its current avatar, it is essentially a Delhi-centric policy.
Table 4 also shows the wide variation in intrastate portability. Several states such as Telangana and Chhattisgarh show zero values. The share of total PDS transactions is high in Bihar (46%), Haryana (35%), Kerala (26%), Andhra Pradesh (24%), Rajasthan (23%), Madhya Pradesh (14%) and Karnataka (10%). Since most intrastate migration is intra-district migration (Table 3), it is quite likely that most of this offtake is intra-district in nature. The statistics bear this out as well, and government reports suggest that 93 per cent of the intrastate portability is intra-district (Paliath & Iqbal, 2023). In some areas it may represent a different PDS shop registered in a neighbouring village. Irrespective of the distance, the fact that in many large states, over 10 per cent of the transactions are classified as being portable shows the value of making PDS portable, because there is clearly a demand for it. Again, the variation across states most likely represents different operational capabilities rather than differing intrastate migration propensities. It also shows that the monthly transactions can far exceed the current figure of 21 million if all states pushed through intrastate portability at levels seen in Haryana or Andhra Pradesh. The high figure of Bihar also shows that while it is generally viewed as a state of outmigration for work, it also witnesses considerable intrastate mobility (Datta, 2022). It also has a much higher share of population that is eligible for ration cards than most other states.
While the IMPDS website provides the breakdown of PDS transactions into three categories by portability across 30 states and union territories, there are also state government websites that provide details on portability in much more granular detail. Table 5 lists 13 such states and union territories, including Punjab (not shown in Table 4) as a state with high intrastate portability of over 30 per cent. These state government websites follow the same template titled AePDS (Aadhaar-enabled PDS) but were started at different points of time, many of them in late 2023. The next section analyses the intrastate data for the state of Maharashtra in greater detail as it has data going back over a year.
Intrastate Portability and the Case of Maharashtra
In September 2023, Maharashtra in western India witnessed around 16 million PDS transactions, of which 14.5 million or 93 per cent were ‘regular’ transactions, 1 million or 6 per cent transactions were intrastate portable and around 33,000 or 0.2 per cent transactions were interstate portable. The ratio of intrastate portability to interstate portability was 97:3 (Table 4) as compared to its migration splits of 84:16 for total migration and 64:34 for work-related migration (Table 3). Thus, interstate portability was seriously underserved in Maharashtra. Nevertheless, the intrastate numbers are impressive at over 1 million transactions. How stable are these transactions and do they indeed reflect the needs of migrant workers?
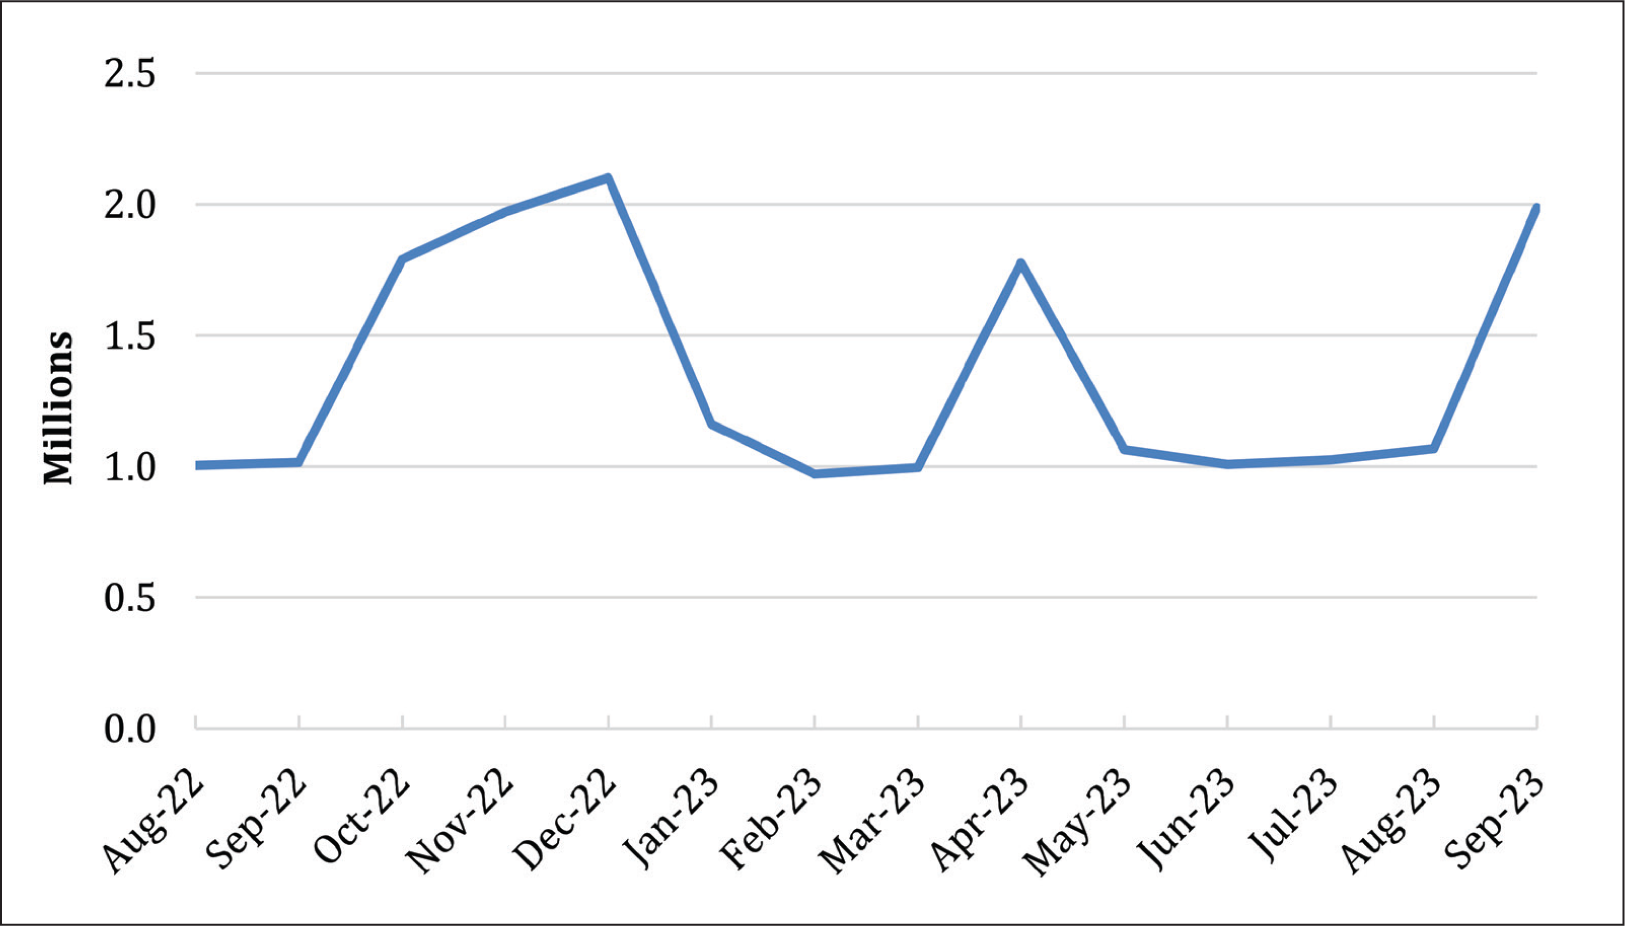
Figure 1 shows the time series on intrastate portability transactions for Maharashtra between August 2022 and September 2023. First, the state government website figure for intrastate portability in September 2023 was nearly 2 million transactions, double of what was shown on the IMPDS website for Maharashtra (and reported in Table 4). Nevertheless, the trend shown in Figure 1 is of transactions fluctuating between 1 and 2 million monthly transactions, or roughly 5–10 per cent of total PDS transactions over a year. It shows high seasonality with rising offtake between September and December and then again between March and April with a relative lull during the monsoon season of June to September. This is in line with what is known about seasonal migration in India where migration begins on a large scale after the monsoon.
PDS Transactions across States, September 2023.
States with Official Data Sources on Intrastate and Interstate PDS Portability in India, October 2023.
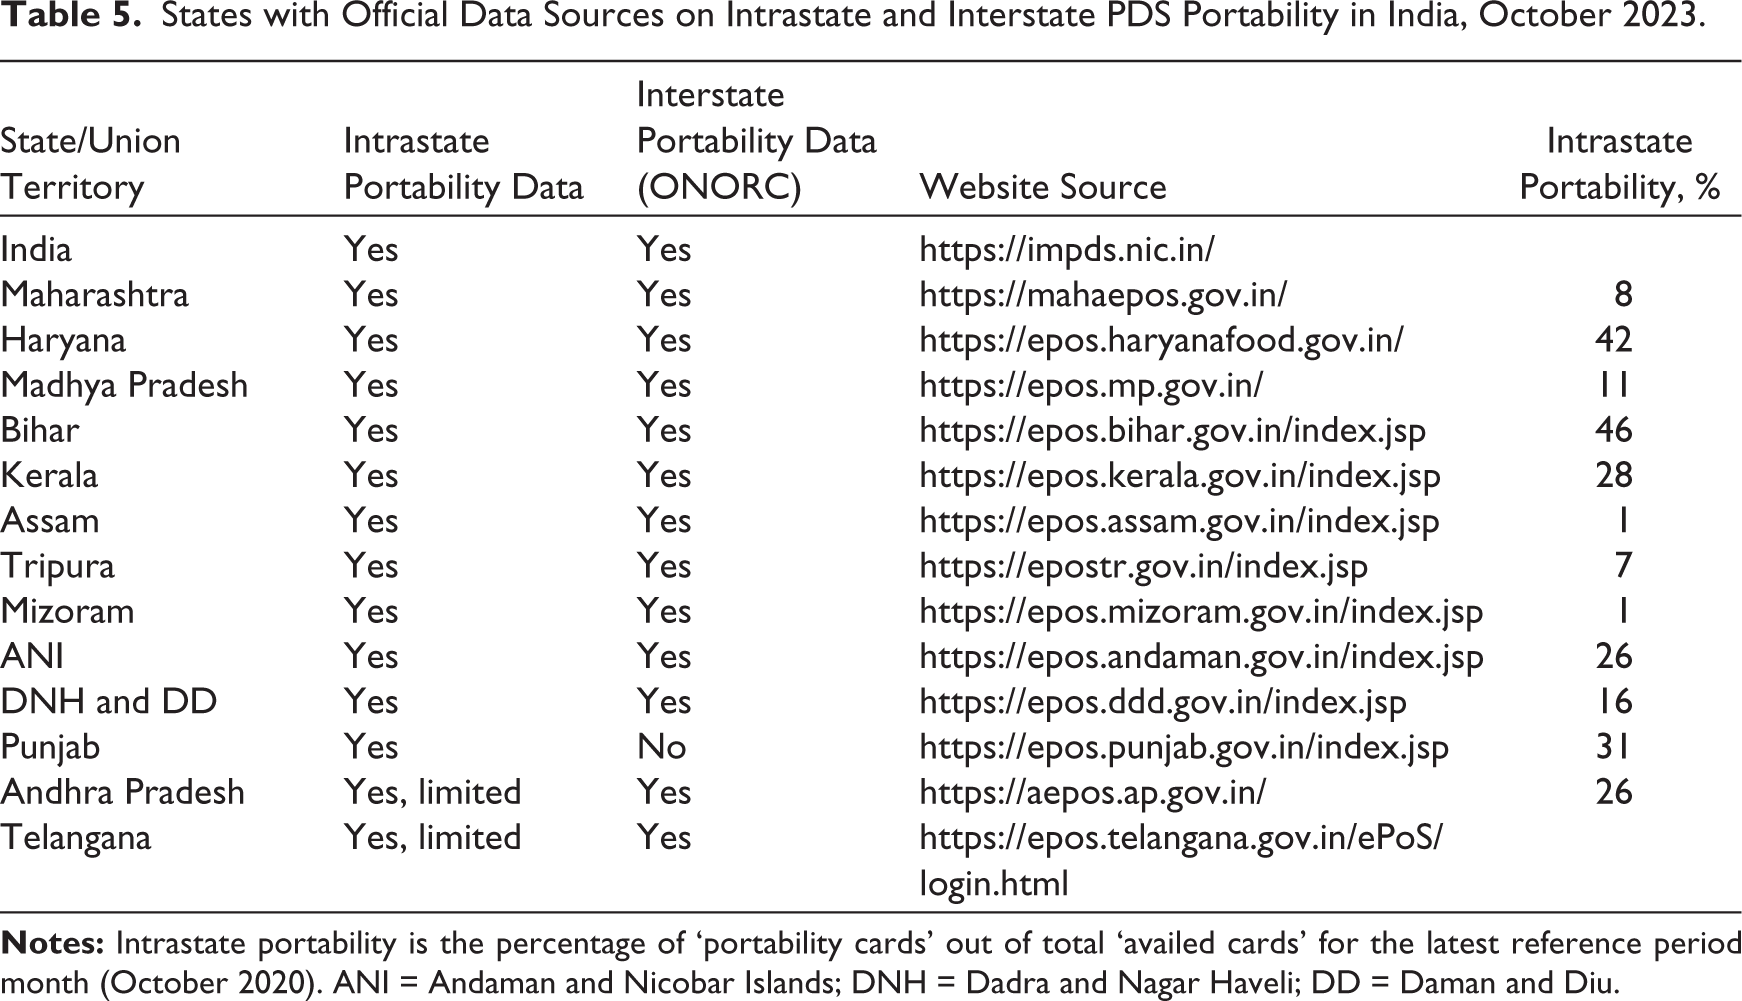
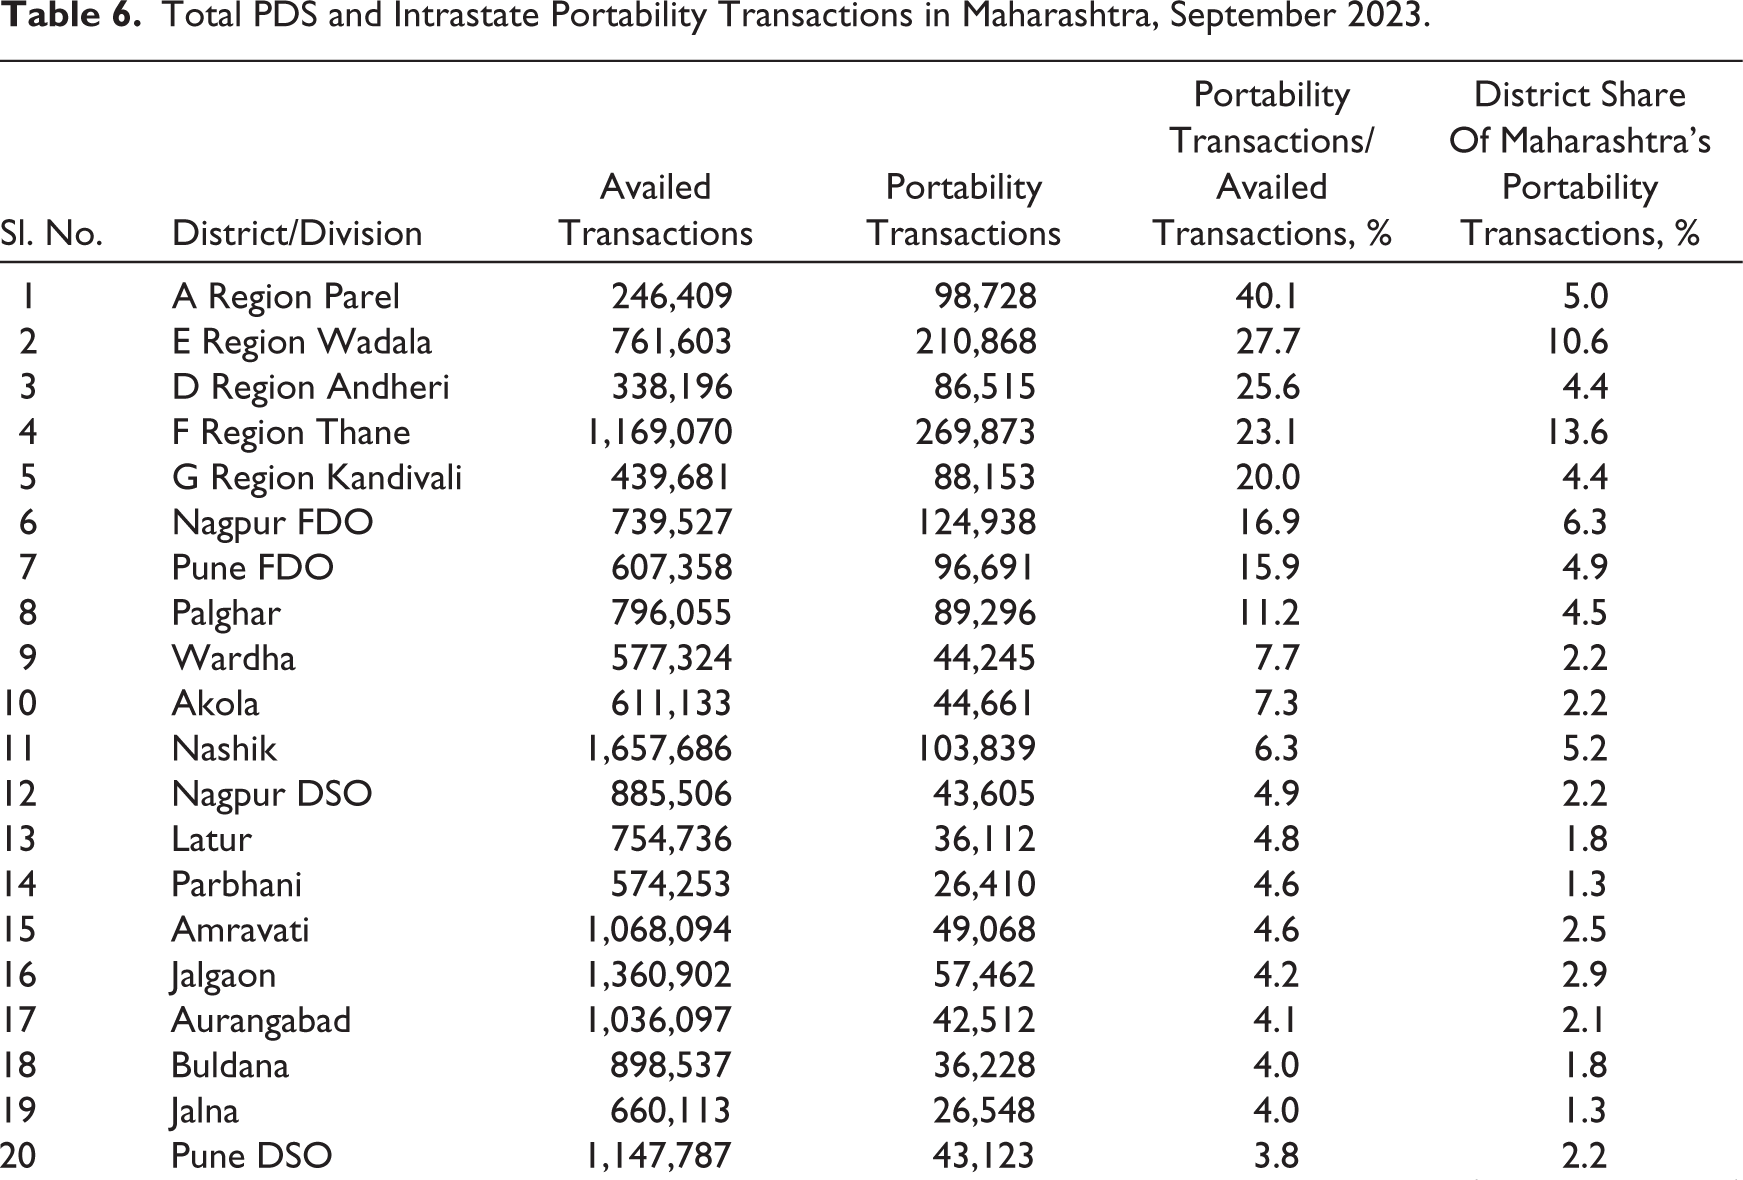
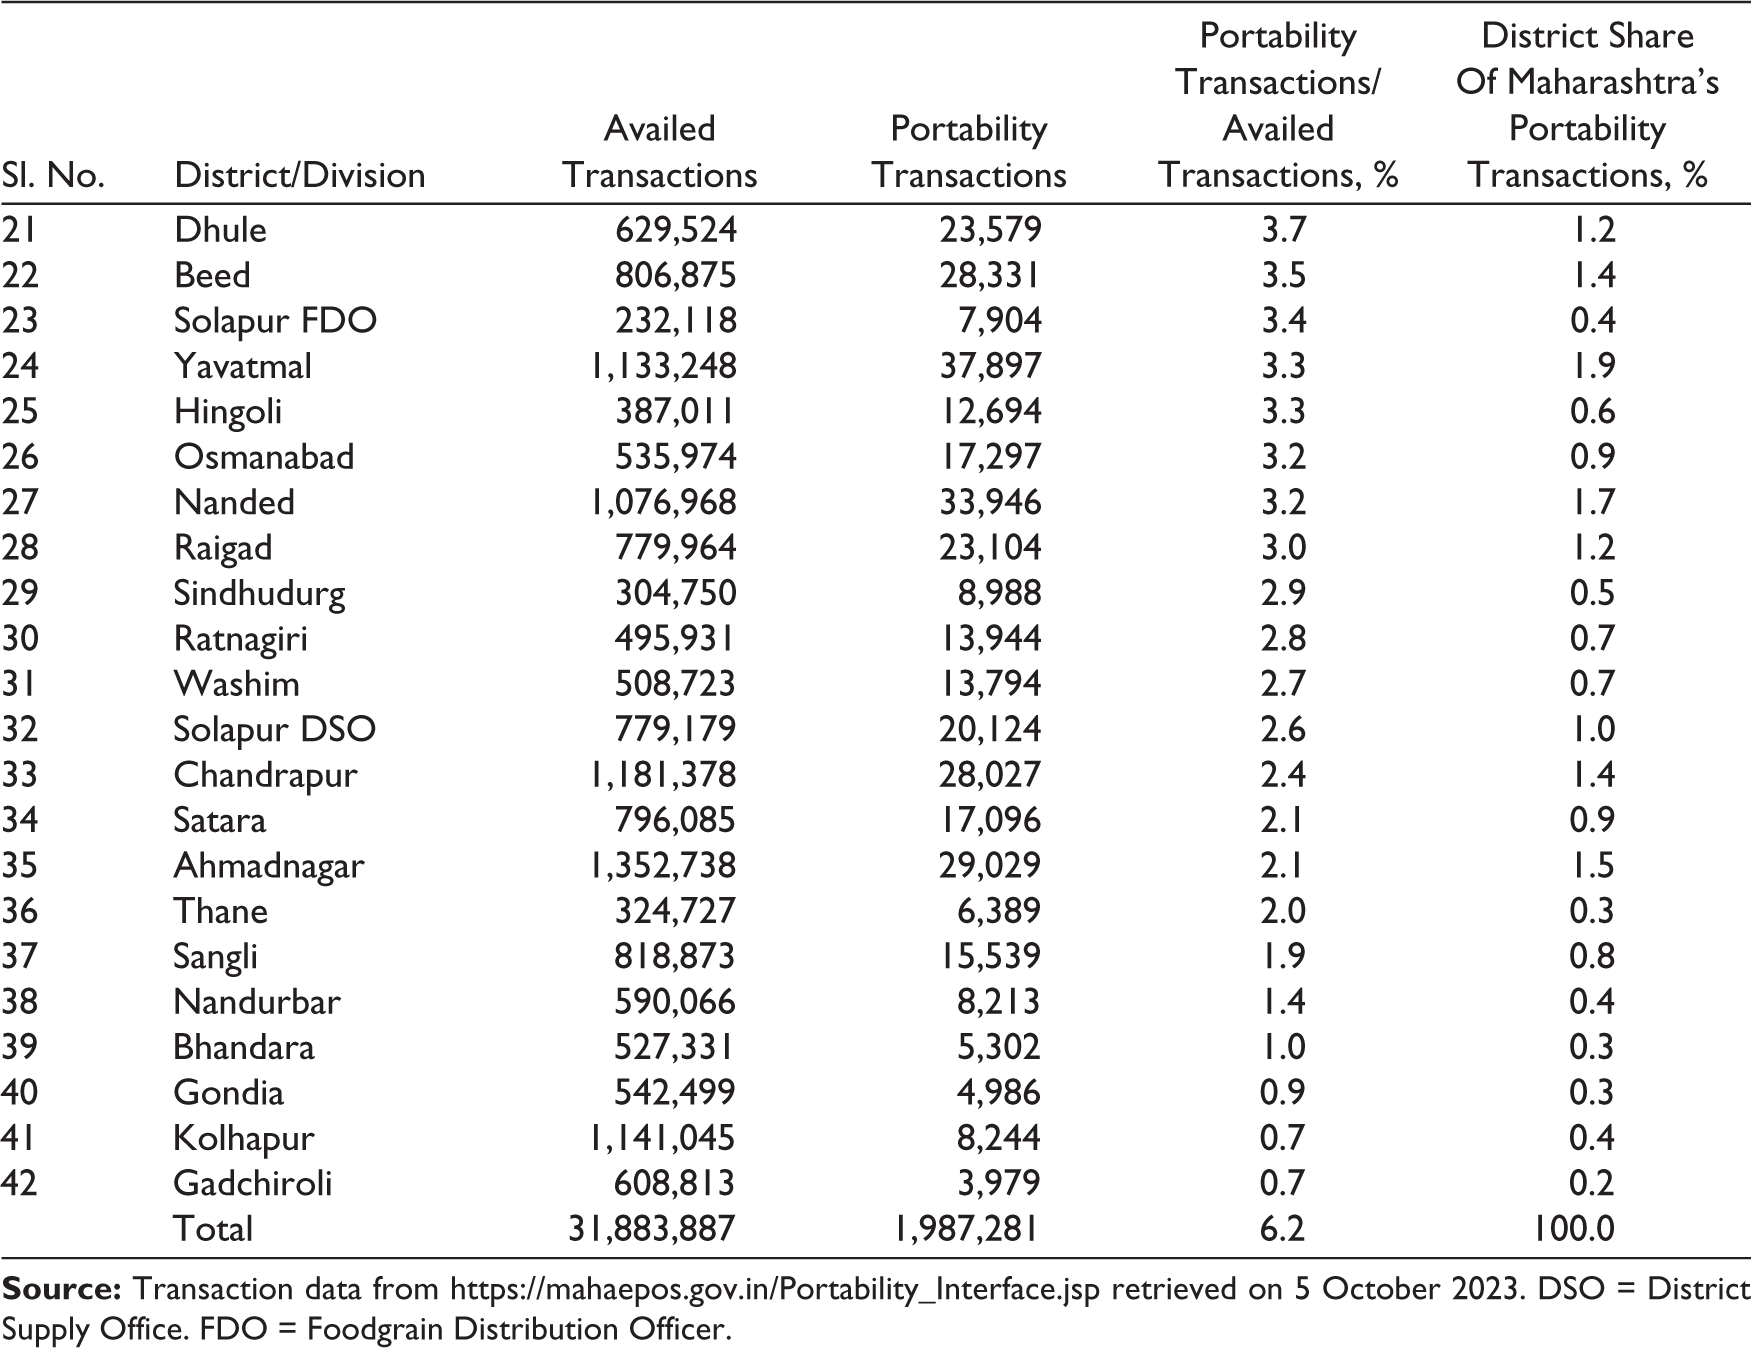
Table 6 provides a district-level distribution of the nearly 2 million intrastate portability transactions conducted in September 2023. It is sorted by the indicator ‘portability transactions as a percentage of total availed transactions’. This figure varies from 40 per cent in Parel (Mumbai) to 0.7 per cent in Gadchiroli, a relatively poor district in eastern Maharashtra known for outmigration. Table 6 clearly shows that intrastate portability is used in the destination regions by migrants because the top 8 out of 42 district/regions account for over half of the total intrastate portability transactions. The first five are suburbs or neighbourhoods in Mumbai, followed by Nagpur, Pune and Palghar (north of Mumbai). There is, thus, a neat correspondence between the heavy in-migration zones and high intrastate offtake share and as one goes down the table, relatively fewer intrastate transactions occur as work-related migration rates are lower in those places. In Maharashtra, therefore, intrastate portability is clearly working reasonably well for migrants, clocking 1–2 million monthly transactions. It is, however, not doing enough on the interstate portability front as pointed out earlier and could increase that from its current figure of 30,000 transactions to perhaps closer to the figure for Delhi, at half a million.
Total PDS and Intrastate Portability Transactions in Maharashtra, September 2023.
ONORC Interstate Portability
The ONORC policy for interstate PDS portability was launched in 2019 in a few states, and by mid-2022, all the states and union territories of India were participating in it. Figure 2 maps the rollout of the policy across states. Gujarat and Maharashtra, two states with a large number of interstate migrant workers entered the policy in August 2019 itself, as did several other states in western and southern India.
In late March 2020, due to the COVID-19 pandemic, an urgent lockdown was imposed that ended up creating a full-blown migration crisis for a few months (Dandekar & Ghai, 2020; Rajan et al., 2020). In April 2020, there were scenes of migrants walking back home, and in May 2020, the government ran the Shramik Special trains to transport migrant workers back home. Researchers, using mobile phone tracking data, placed the scale of the return exodus in the tens of millions, which was much higher than a few million claimed by the government (Nizam et al., 2022). The migration crisis of 2020 exposed the serious vulnerability faced by internal migrant workers in destination sites (Deshingkar, 2022; Levy et al., 2022; Rajan & Cherian, 2021; Sengupta & Jha, 2020), something that had been articulated even before the pandemic (Kundu & Saraswati, 2012). It also led to calls for more welfare support for migrant workers (Bhagat & Kumar, 2021; Deshingkar et al., 2022) and put the spotlight on the urgent rollout of ONORC. As Figure 2 shows, most of the remaining states joined ONORC in 2020, while a few joined in 2021 and 2022. The Government of India had earmarked an outlay of ₹1,270 million for the scheme in financial years 2018–2019 and 2019–2020, which was extended for a few more years (GoI, 2023, p. 54). By 2023, nearly ₹1,000 million had been disbursed to 33 states and union territories under the scheme.
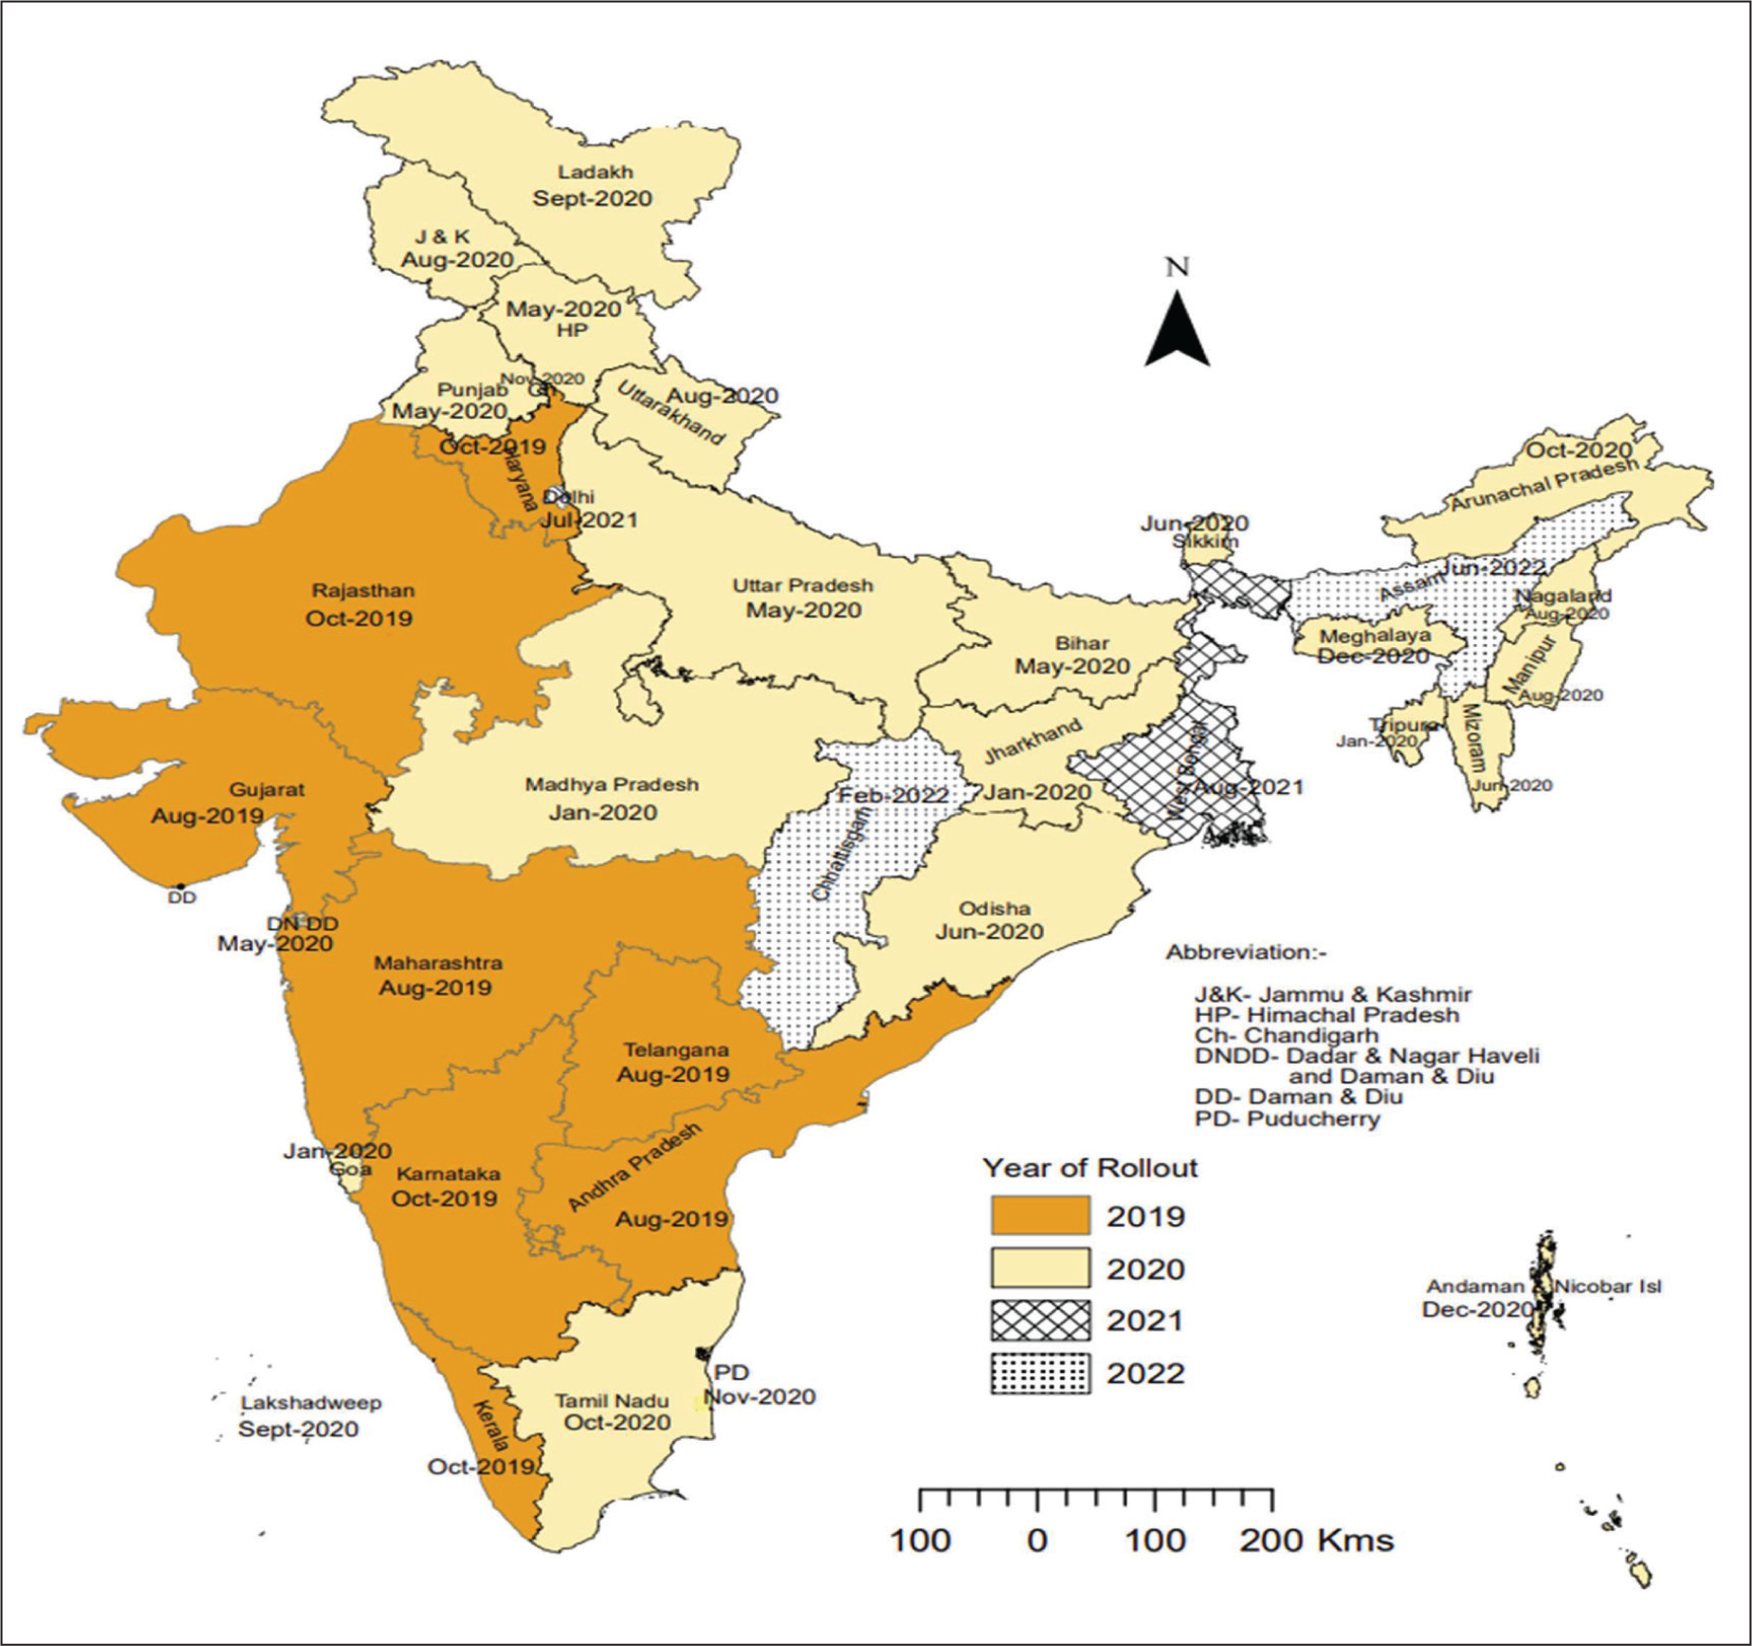
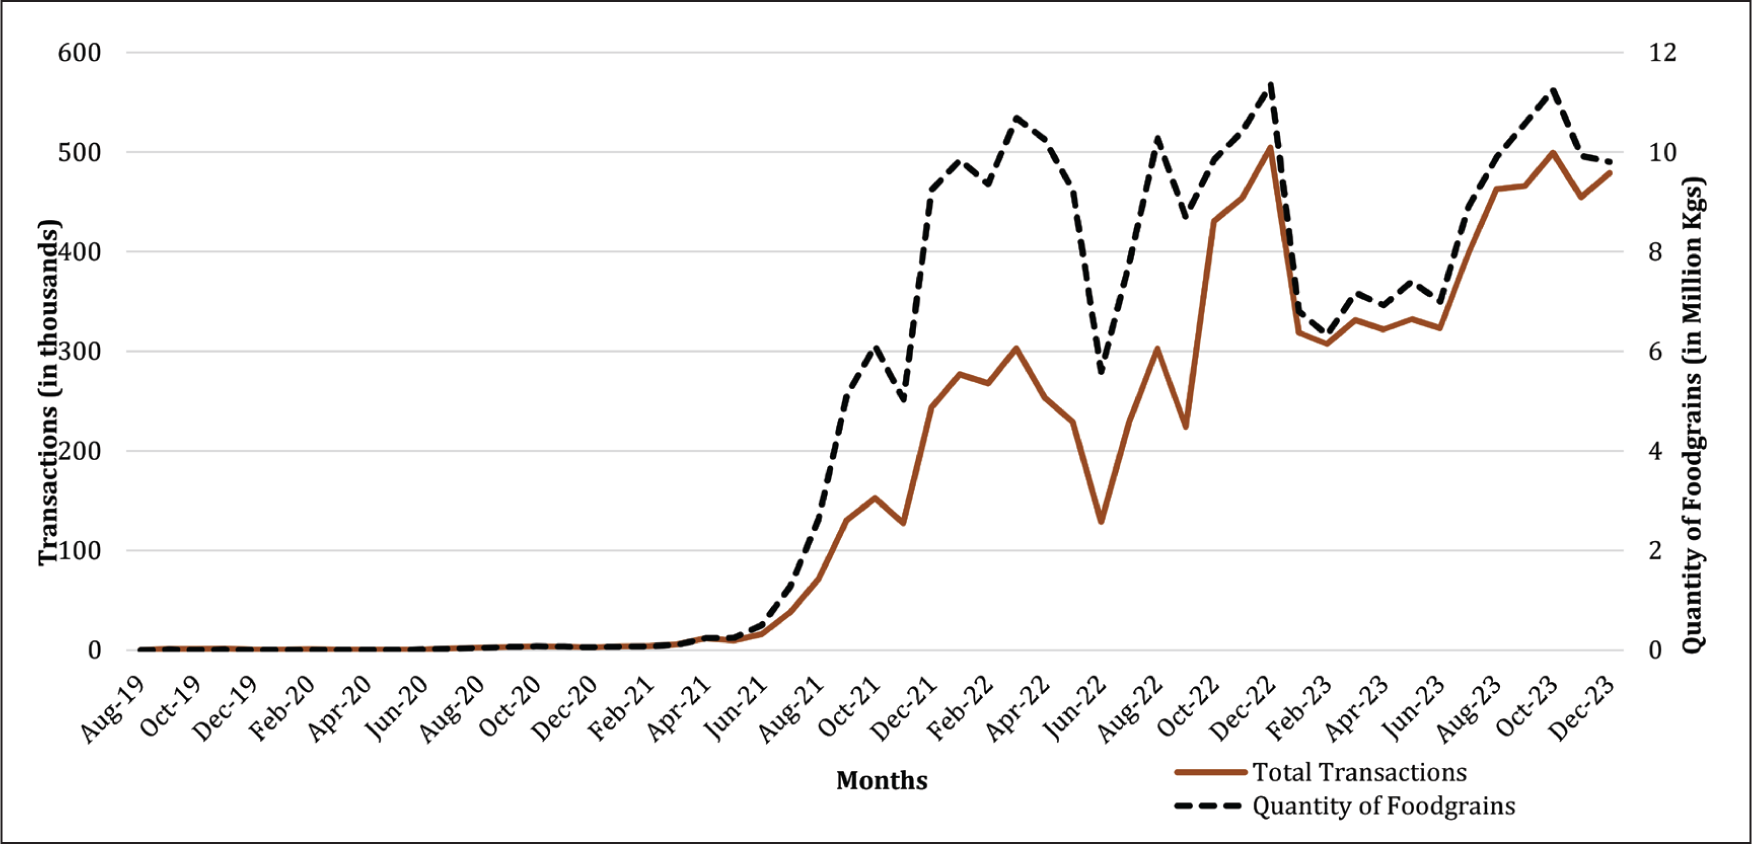
Figure 3 shows the progress of ONORC interstate transactions over time. In late 2021, total monthly transactions breached the 100,000 threshold. After that, there was a steady rise to a peak of nearly half a million transactions in December 2022, marked by a brief break in mid-2022. In 2023, monthly transactions were in the range of 300,000 to 500,000. What is clear from the time series is the seasonality whereby transactions appear to be stagnant during the monsoon season. As seen earlier in the case of intrastate portability in Maharashtra, this is consistent with the seasonal migration calendar where offtake is likely to be much higher towards the end of the calendar year. Figure 3 also shows that foodgrain quantity offtake closely tracked the volume of transactions, ranging from 6 to 10 million kg per month in 2023.
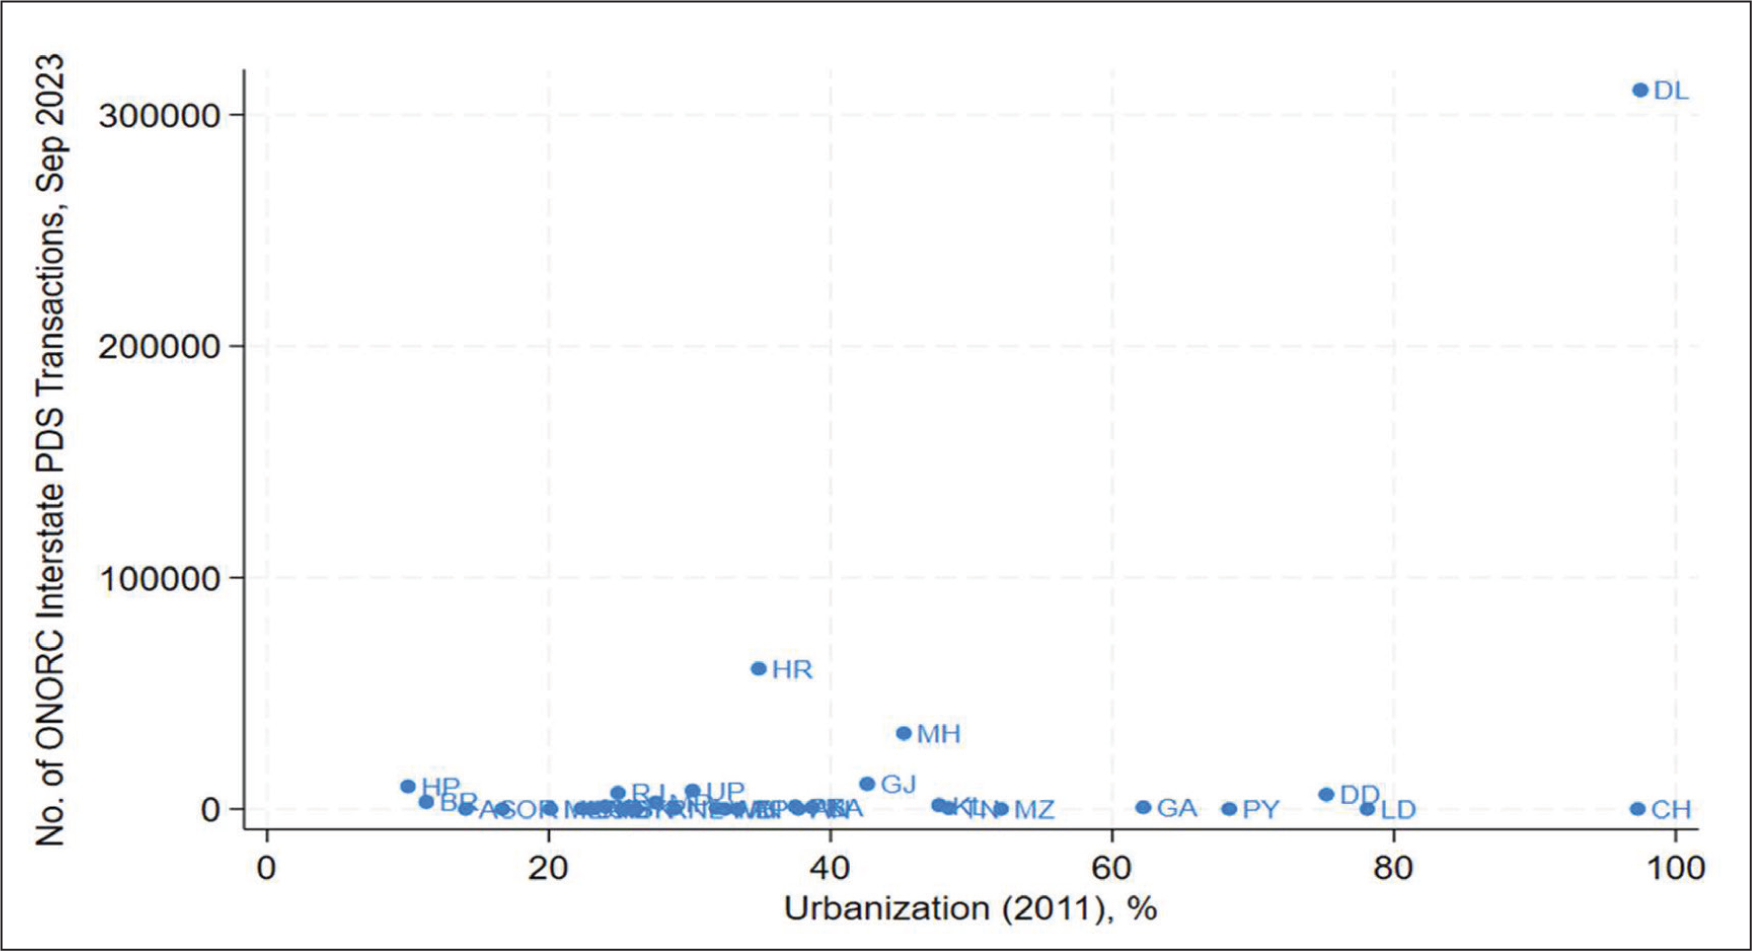
Figure 4 plots state-level transaction volume for September 2023 against the state-level urbanisation rate for 2011. Barring Delhi, there is currently little relationship between these variables. Chandigarh, an important urban centre, has seen little ONORC offtake. And as noted earlier, Haryana sees a higher offtake than Maharashtra and Gujarat currently, pointing to substantial future potential in the latter two states. While Delhi, Haryana, Maharashtra and Gujarat were the leading states for ONORC offtake, the major source states were Bihar and Uttar Pradesh. In fact, these two states accounted for over 90 per cent of transactions. That is currently, ONORC is mostly used by the Bihar–Delhi and Uttar Pradesh–Delhi migration corridors.
Some other aspects of ONORC were previously documented by Agrawal and Agnihotri (2022). In Bihar and Uttar Pradesh, around 80 per cent of FPS were associated with at least one out-migrating ration card reflecting widespread usage or knowledge about the scheme. This figure was less than 30 per cent in Madhya Pradesh, Rajasthan, Jharkhand and Uttarakhand, states known for outmigration. While there were repeat sales under portability, overall frequency was lower than regular transactions. Less than 10 per cent of FPS in the country accounted for over 80 per cent of the sale transactions in India.
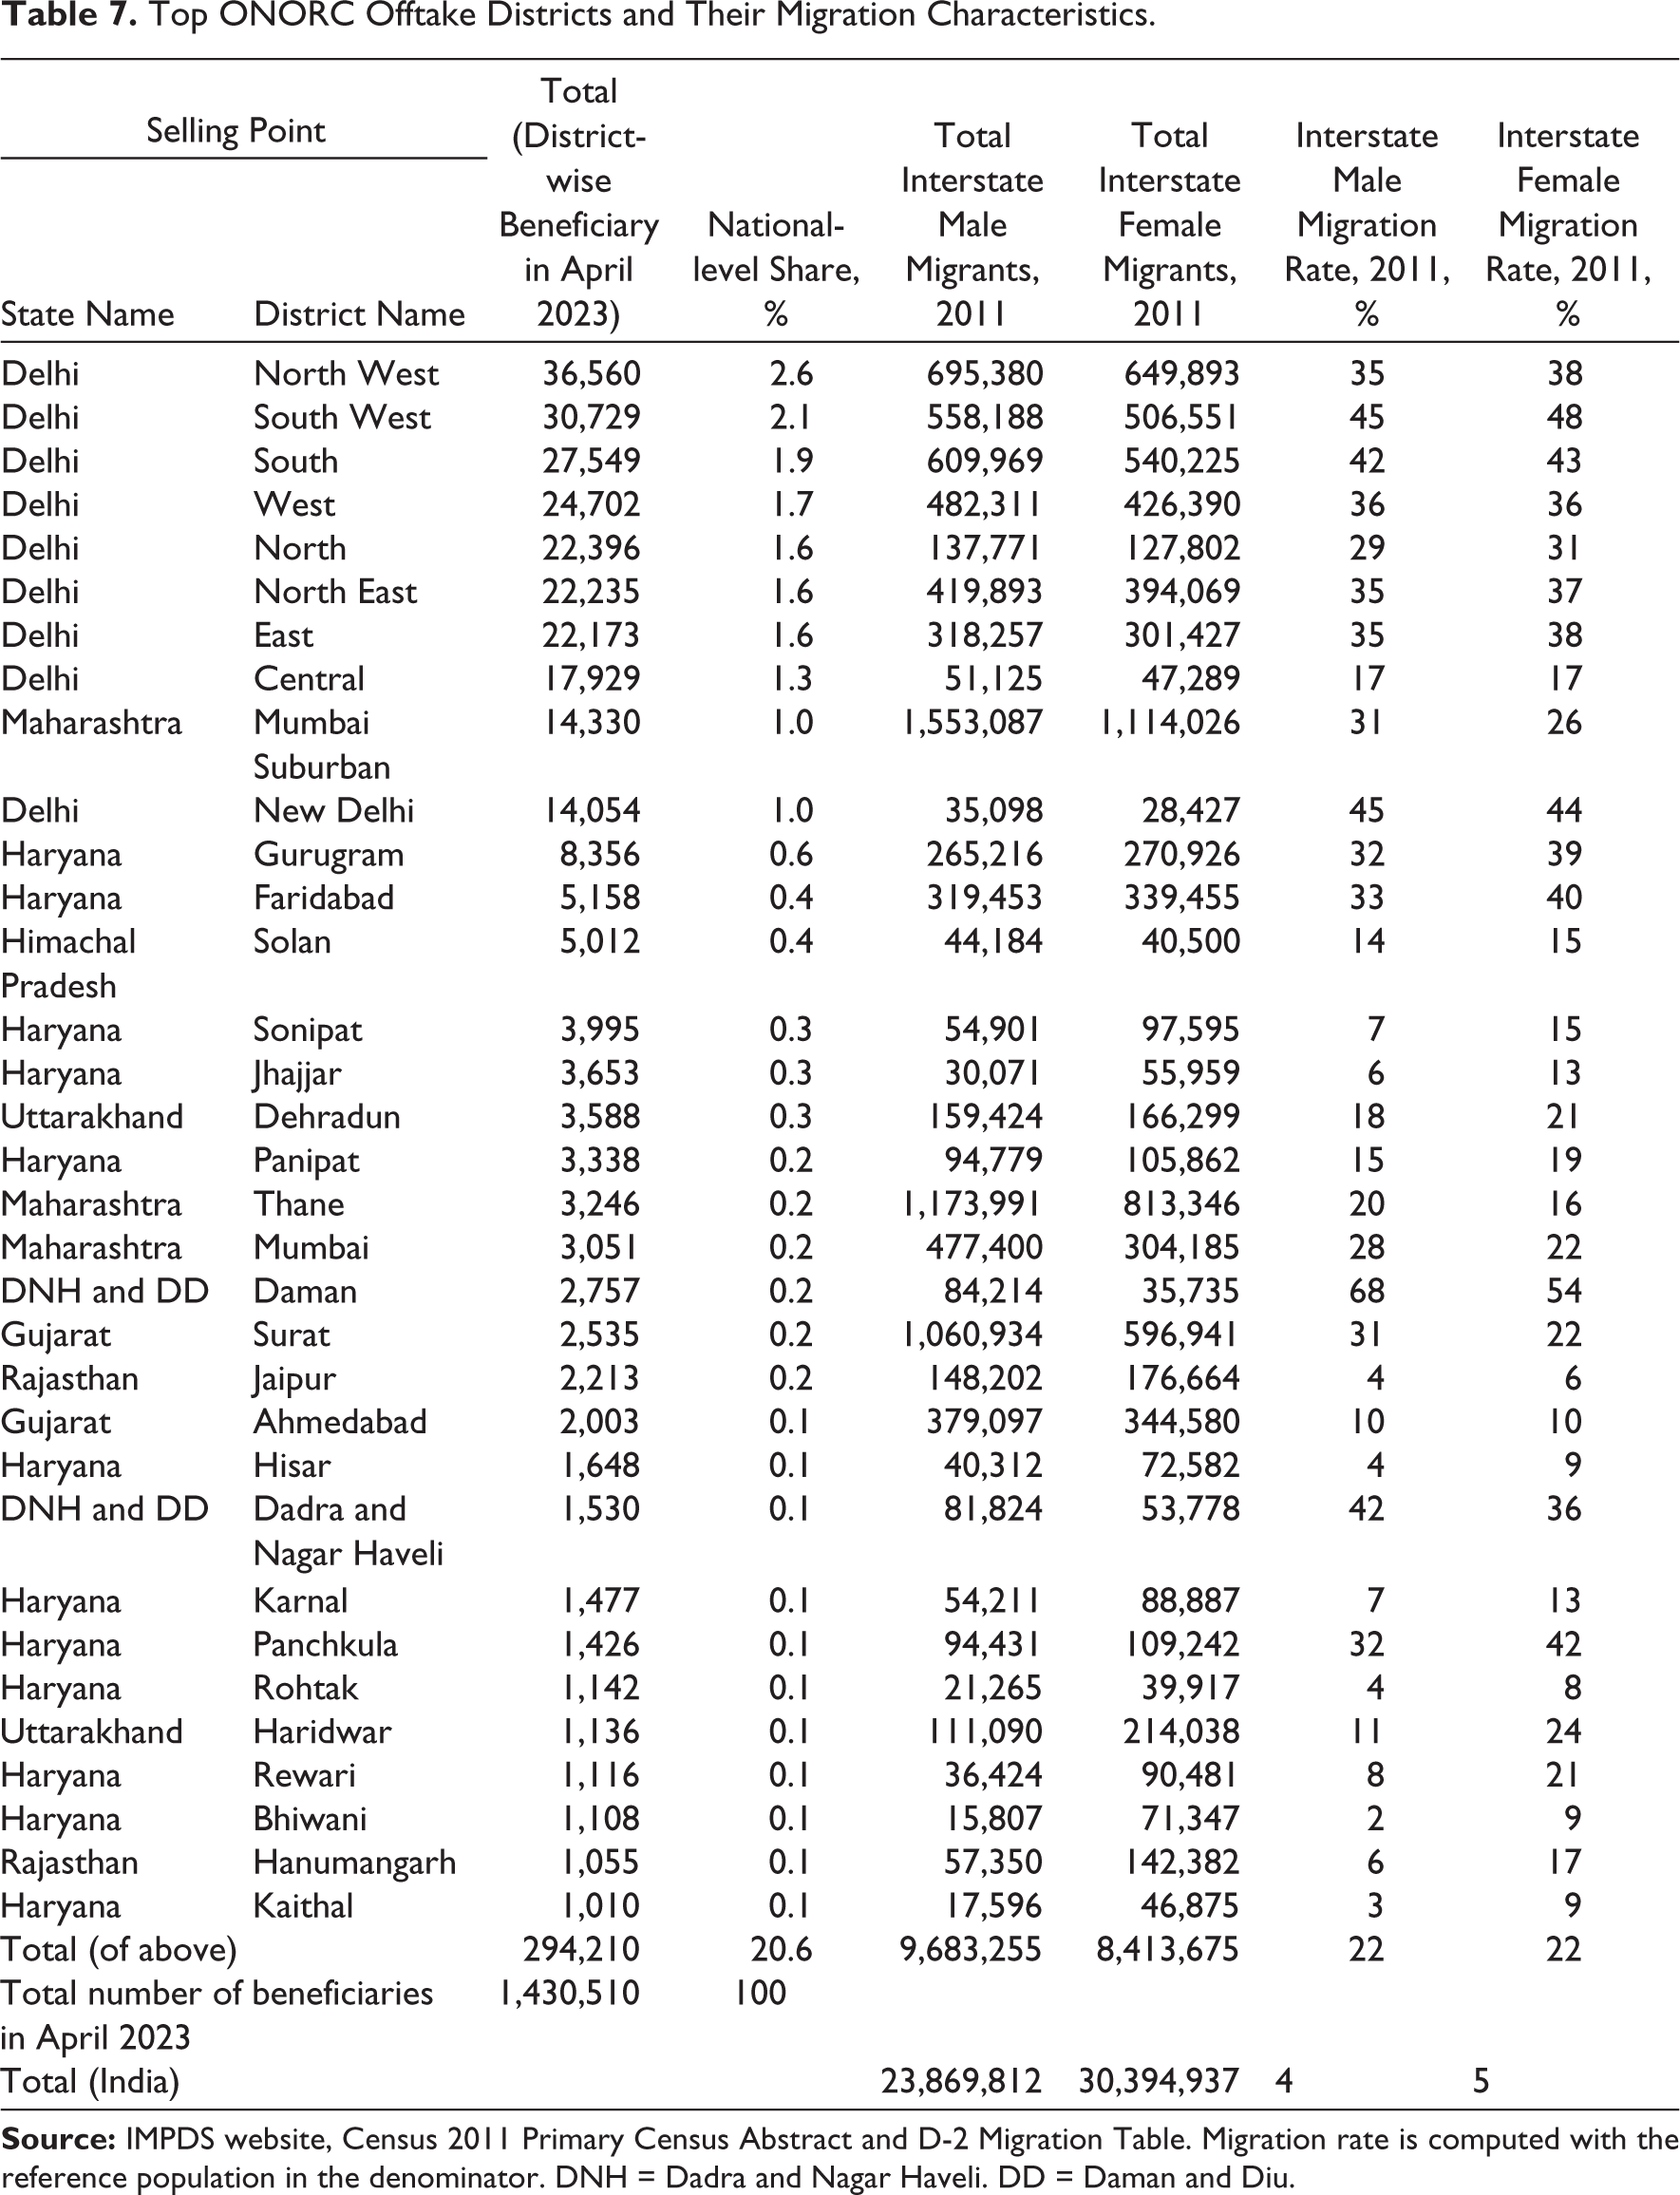
It is possible to locate the districts with major offtake. Table 7 lists around 30 out of over 700 districts in India that witnessed over 1,000 ONORC interstate transactions in April 2023. These districts cumulatively accounted for around 20 per cent of all transactions. The districts of Delhi top this list, which also includes other important cities such as Mumbai, Gurugram, Daman, Surat, Jaipur and Ahmedabad. While the interstate male migration rate in India was 4 per cent, it was on average five times higher in these high-offtake districts. Table 7 makes it clear that interstate ONORC offtake has a relationship with interstate migration when the monthly transactions number over 1,000. However, Kolkata, Chennai, Hyderabad, Bengaluru and Pune, which are among the top 10 most populous cities of India, are absent from this list. This shows the limited traction ONORC currently has in important urban enclaves that host hundreds of thousands of interstate migrant workers.
Top ONORC Offtake Districts and Their Migration Characteristics.
Critical Constraints and the Way Forward
The previous sections illustrate the extent of the shortfall currently witnessed in the implementation of ONORC. Several states have not yet enacted intrastate portability, which has taken off on a massive scale in some states, while virtually no place outside Delhi has seriously enacted interstate portability. The tables and figures presented so far reveal that interstate ONORC needs a big push in many urban enclaves, especially in south India. The current monthly transaction volume of half a million can be increased at least fivefold. What factors then constrain the ONORC?
Two ground-level studies point out the operational challenges of ONORC due to limited awareness of the policy, and the weariness of FPS dealers in destination regions to engage with interstate migrant workers and manage stocking requirements (Dalberg, 2022; Paliath & Iqbal, 2023). Electronic point of sale (ePoS) machines and Aadhaar-seeded ration cards have enabled seamless portability, but there is the nagging issue of biometrics failing, at times leading to the phrase ‘finger nahi kaam kiya’ (‘finger did not work’; Paliath & Iqbal, 2023). Delhi’s PDS portability effectiveness has been attributed to measures taken during the pandemic to support migrant workers that carried through even after the migration crisis of 2020. According to the Dalberg survey, there was a general lack of awareness among beneficiaries and dealers on how exactly ONORC worked (Dalberg, 2022). There is also the issue that some state governments may allocate more wheat than rice, contrary to the preferences of migrants. Migrants may choose to buy foodgrains from the open market if the process of getting ONORC-enabled subsidised foodgrains is difficult. Migrants living in dormitories or in large groups do not need to cook individually and can rely on local canteens. It is possible that family-based migrations where men, women and children move together may require ONORC more than single-male migration streams, but information on this break-up or demand is scant at present. There are, thus, demand-side and supply-side constraints on the ONORC policy.
Our study has pointed to the massive potential of ONORC in most parts of India outside Delhi that is yet to be fulfilled, the clear links between interstate portability and migration where it is being implemented, and also the links between intrastate portability and migration in the state of Maharashtra. Further, the data on both intrastate and interstate portability show clear signs of seasonality that are in sync with the migration calendar. The idea that ONORC is not being used by the intended beneficiaries, that is, migrants, should therefore be dismissed. The challenge is one of scaling up the policy.
First, governments need to recognise the woeful progress of the interstate ONORC since its implementation a few years ago. Often, interstate ONORC is clubbed with intrastate portability and the figures appear to be large. The ONORC is sometimes used in official nomenclature to include both intra and interstate portability as in the texts of the annual reports of the Department of Food and Public Distribution, Ministry of Consumer Affairs. For instance, the following was mentioned in the annual report of 2022–2023 (GoI, 2023, p. 54):
Presently, the data of ONORC transactions recorded so far show that an average of about 3.5 crore monthly portability transactions are taking place under ONROC in 36 states/UTs on a monthly basis. Since its inception in August 2019 and upto December 2022, a total of more than 98 Crore portability transactions (including interstate, intrastate transactions) for the distribution of both NFSA and PM-GKAY foodgrains has been recorded in states/UTs under ONORC.
This annual report statement celebrates the ‘3.5 crore’ or 35 million monthly portability transactions taking place (itself an inflated number) but forgets that almost all of it was intrastate portability and not interstate portability. It is the latter kind that is typically considered to be ONORC (as mentioned on the IMPDS website, for instance) and yet by clubbing both intrastate and interstate portability under ONORC, the overall figures in the annual report appear to be impressive. Interstate ONORC should, therefore, be high on the priority radar for all states outside Delhi and the push for the same has to come from the union government departments on PDS and separately, labour departments. Public communication on high-density migration corridors via the railways and buses can help increase awareness but, above all, FPS dealers must be sensitised in handling requests of interstate migrants in destination regions. They must also be assisted in managing the seasonal stocking requirements as PDS portability shows much more intra-year variability in demand than regular PDS transactions.
The first few years of PDS portability have shown some promising signs for intrastate portability but limited traction for interstate ONORC portability. After the migration crisis of 2020 exposed the fault lines of migrants’ social security in India, it is imperative that they have access to the portability of welfare benefits across the country. Migrants make an important economic contribution to the cities they live in and PDS portability should not be denied to those who want to avail themselves of the facility. This article has documented all the avenues where PDS portability can be enhanced in India, but the portability of healthcare, financial services and other services also deserves similar scrutiny.
Footnotes
Declaration of Conflicting Interests
The authors declared no potential conflicts of interest with respect to the research, authorship and/or publication of this article.
Funding
The authors received no financial support for the research, authorship and/or publication of this article.