
Abstract
This research introduces an enhanced stratified sampling-density-based spatial clustering of applications with noise (SS-DBSCAN), a scalable and robust density-based clustering algorithm designed to tackle challenges in high-dimensional and complex data analysis. The algorithm integrates advanced parameter optimization techniques to improve clustering accuracy and interpretability. Key innovations include a fast grid search method for optimizing the search of optimal minimum points (MinPts) by keeping the
Introduction
Data mining is an interdisciplinary field that merges database technology, statistics, machine learning, and pattern recognition, benefiting from each of these areas (Iavindrasana et al., 2009). While still not extensively adopted in many research domains, numerous studies have highlighted the potential of data mining in developing predictive models, evaluating risks, and assisting with decision-making (Ngiam & Khor, 2019). Data mining utilizing large datasets can generate crucial and impactful insights that are vital for precise decision-making and risk evaluation (Wu et al, 2021). Algorithms designed for data mining facilitate the achievement of these objectives.
The advent of large and complex datasets has ushered in a new era of data-driven insights across various domains. Among the myriad available datasets, those that encompass extensive and high-dimensional data such as medical information stand out due to their comprehensive and detailed collection of information (Arya & Abhishek Arya, 2019; Mollura et al., 2020). The complexity, volume, and high dimensionality of these datasets pose significant challenges for clustering and data analysis, necessitating advanced methodologies for effective data preprocessing and clustering parameter optimization.
When managing datasets characterized by high density, arbitrary shapes, and irregular distribution, density-based spatial clustering of applications with noise (DBSCAN) is recommended as a robust algorithm specifically designed to address these complex scenarios (Martin Ester et al., 1996; Ram et al., 2010; Sander et al., 1998; Shah, 2012). However, DBSCAN has its limitations, particularly in the selection of its two primary parameters, which can affect its performance and accuracy (Schubert et al., 2017). Despite its effectiveness in handling complex datasets, DBSCAN faces challenges, particularly in the selection and tuning of its two key parameters: the minimum number of points required to form a dense region (MinPts) and the maximum distance between two points for one to be considered as in the neighborhood of the other (
Other variants of DBSCAN, such as hierarchical DBSCAN (HDBSCAN) and ordering points to identify the clustering structure (OPTICS), have been developed to address some of these limitations. HDBSCAN extends DBSCAN by converting it into a hierarchical clustering algorithm that does not require the user to specify a fixed value for
This paper elaborates on the enhancements introduced to the stratified sampling-DBSCAN (SS-DBSCAN) algorithm from our previous work, focusing on its innovative approach to automatically select DBSCAN parameters (Monko & Kimura, 2023a, 2023b). The methodology presented here is specifically tailored to navigate the complexities inherent in high-dimensional datasets, providing a more nuanced and effective clustering solution for the unique challenges posed by these extensive datasets. We introduce a more convenient and improved grid search method, named fast grid search (FGS) for determining MinPts. By leveraging automatic parameter selection, SS-DBSCAN aims to improve the precision and applicability of clustering techniques, enhancing the potential for actionable insights in various research domains. Additionally, we demonstrate the pivotal role of principal component analysis (PCA) and t-distributed stochastic neighbor embedding (t-SNE) in preprocessing, alongside a modified approach to SS-DBSCAN parameter optimization, in enhancing clustering accuracy and interpretability within complex datasets. SS-DBSCAN is tested against other DBSCAN variant algorithms to demonstrate its robustness and resilience.
Related Works
Clustering algorithms, particularly DBSCAN, have been extensively studied for their capability to identify natural groupings in data without requiring a predefined number of clusters. The original DBSCAN algorithm, introduced by Martin Ester et al. (1996), demonstrated effectiveness in discovering clusters of arbitrary shapes and handling noise. Still, its performance heavily relies on the appropriate selection of two key parameters:
Numerous subsequent studies have attempted to address these challenges through various enhancements to the DBSCAN algorithm. Schubert et al. (2017) revisited DBSCAN and discussed that DBSCAN is still a practical and effective clustering algorithm, especially when applied with careful consideration of parameters and indexing strategies. Selecting the
Other modifications of the DBSCAN algorithm have been proposed to enhance its clustering performance. Liu et al. (2010) introduced DBSCAN-density levels partitioning, which uses a dynamic approach to select the
Other experiments conducted by Gan and Tao (2015) were performed on datasets, and their parameter settings were not well-suited for cluster analysis. Gan & Tao’s (2015) choice of the
In high-dimensional datasets, the complexity and volume of data present significant challenges for traditional clustering algorithms (Paoletti et al., 2009; Saeed et al., 2002; Wang et al., 2020). These datasets often contain intricate patterns that are not readily apparent, necessitating the use of advanced dimensionality reduction techniques such as PCA and t-SNE (Abdi & Williams, 2010; Melit Devassy & George, 2020; Platzer, 2013; Smetana et al., 2024). In practice, applying PCA to reduce the dimensionality to a smaller number of components (e.g., 30–50) before running t-SNE is a common approach. This ensures that t-SNE works more efficiently and effectively, especially with very large or complex datasets (Pareek & Jacob, 2020; Shah & Silwal, 2019).
Various studies have also highlighted the potential of data mining and clustering in the medical domain. For instance, Zhang et al. (2016) explored big data mining in clinical medicine, emphasizing the utility of clustering techniques in identifying meaningful patterns in patient data. Ngiam and Khor (2019) discussed the role of machine learning algorithms in healthcare delivery, underscoring the importance of robust clustering methods for clinical decision-making.
From the above-discussed related works, we realized a need to address the existing gaps by building upon SS-DBSCAN, a new variant of DBSCAN that we developed in our previous studies that incorporates stratified sampling for
Contribution
This paper makes four main contributions to the field of data mining and clustering high-dimensional datasets:
We enhanced the original DBSCAN to SS-DBSCAN to address the complexities of high-dimensional data through advanced parameter optimization techniques, ensuring precise and reliable clustering results. We developed a novel adaptive range method based on local density estimates. This method dynamically adjusts the range for MinPts to improve the adaptability of SS-DBSCAN to varying data densities. We enhanced the grid search technique to significantly reduce the computational time required to determine the optimal MinPts in any DBSCAN variant that utilizes this parameter. With the enhancement and improvement listed above, we realized scalable and adaptable DBSCAN, SS-DBSCAN, which is a valuable tool for analyzing large and complex datasets across various research domains.
Overview and Motivation
Clustering high-dimensional data remains a significant challenge, particularly in cases where data density varies across different regions, making parameter selection for traditional clustering algorithms difficult. DBSCAN is a well-known density-based clustering method that detects arbitrarily shaped clusters and identifies noise. However, its performance is highly sensitive to the choice of parameters (
The main limitations of DBSCAN include:
To address these challenges, we propose SS-DBSCAN, an enhanced version of DBSCAN that automates parameter tuning and improves clustering accuracy in high-dimensional datasets. SS-DBSCAN introduces two key enhancements:
These modifications enable SS-DBSCAN to handle noisy, high-dimensional datasets more robustly, ensuring that clusters are accurately formed without excessive noise classification. The following sections explain how SS-DBSCAN selects parameters, handles noise, and improves clustering performance.
Data Preprocessing
Our methodological pipeline begins with the use of Sentence-BERT’s (S-BERT’s) encoder to get context-sensitive sentence embeddings. The datasets used in our experiments were mainly text data (i.e., Emotion-Sentiment, Coronavirus-Tweets, and Cancer-Docand MIMIC III) and one numerical dataset (Sonar). The text data comprised sequences ranging from a minimum of 50 to a maximum of 500, with an average sequence length of 250. The average length of 250 reflects the natural distribution within the selected datasets. Therefore, we used the all-mpnet-base-v2 pre-trained model from S-BERT to generate embeddings (He et al., 2024; Jayanthi et al., 2021; Korea & Zahran, 2022). This pre-trained model has a maximum sequence length of 384, which can accommodate the sequence length of our data, has dimensions of 768, and has been trained over 1 billion training pairs (Reimers & Gurevych, 2019). By generating high-quality embeddings using S-BERT, we enhanced the representational capacity of our data, facilitating more accurate and meaningful clustering. Examples of the preprocessed and S-BERT-ready textual inputs are provided in Appendix A. We then normalized the features of the data using a Standard Scaler, followed by PCA and t-SNE as part of data pre-processing. Then, it proceeds with the strategies for achieving high-quality clustering using SS-DBSCAN. Figure 1 illustrates the process through data pre-processing techniques and parameter selection, particularly emphasizing the MinPts parameter, which has historically been the most challenging to optimize in previous research.
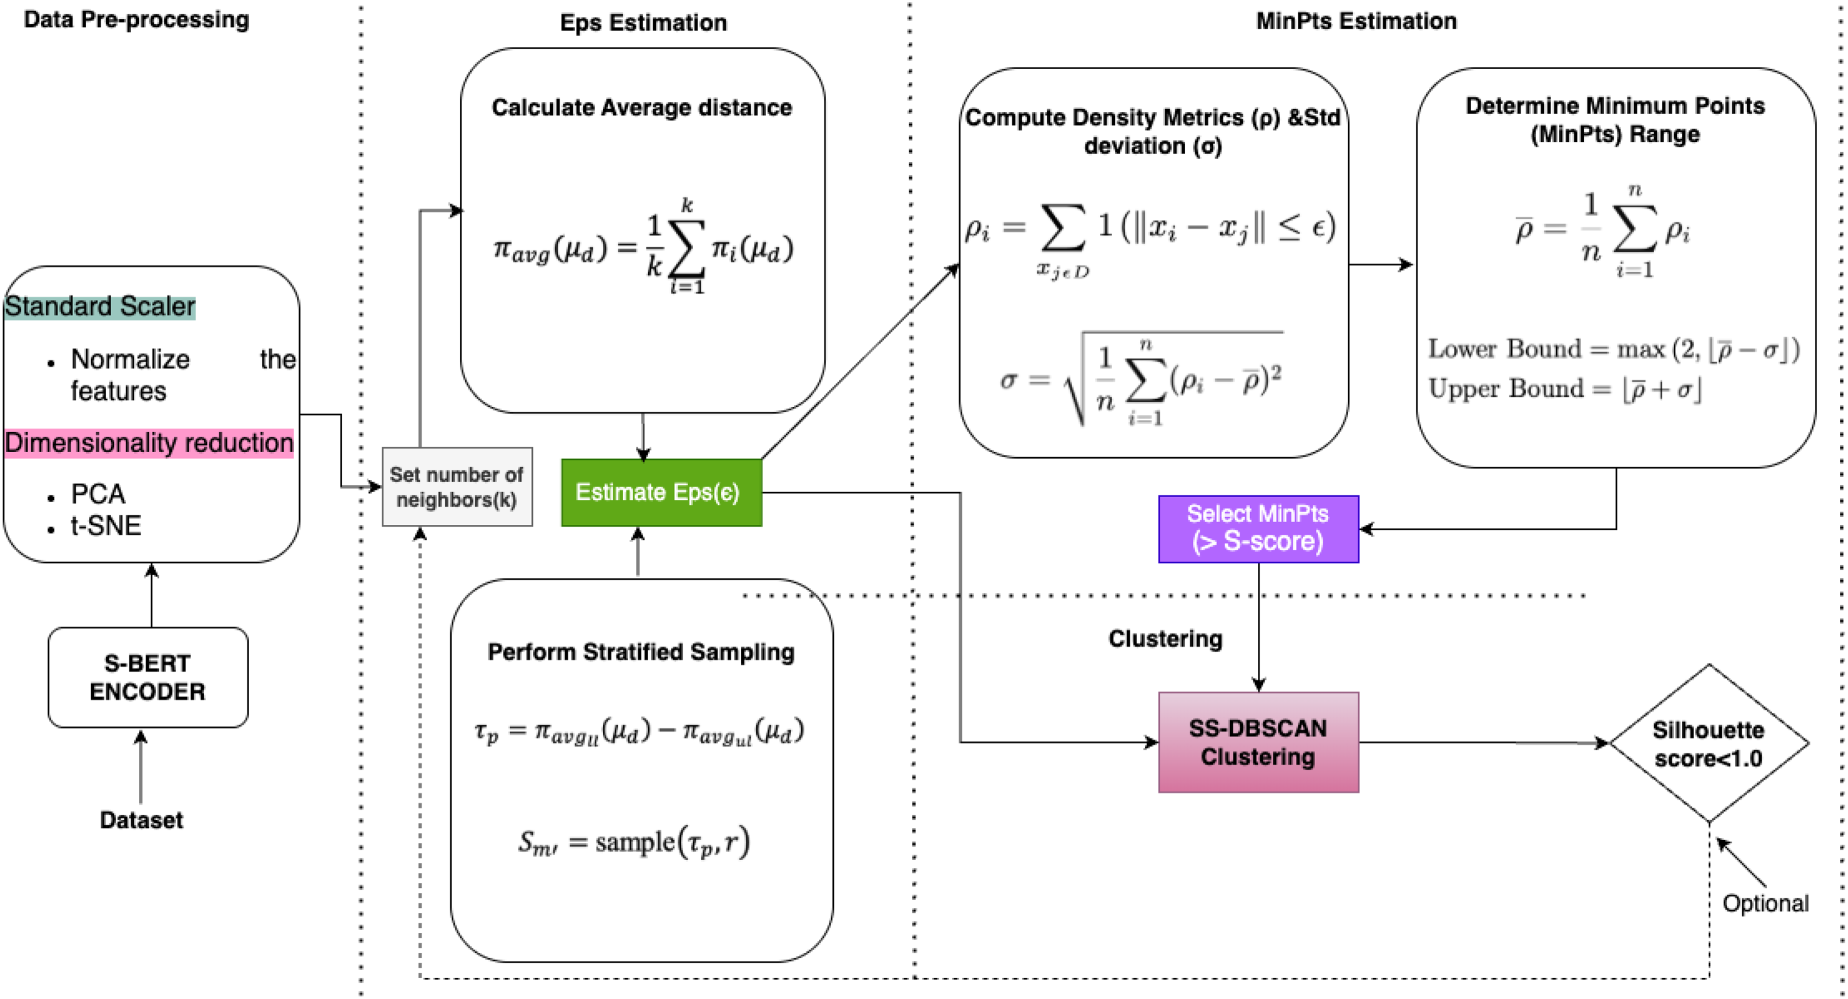
Impoved MinPts for SS-DBSCAN architecture. Note. MinPts = minimum points; SS-DBSCAN = stratified sampling-density-based spatial clustering of applications with noise.
The Standard Scaler, in this case, was employed to prevent the dominance of high-variance features and to ensure that all features contribute proportionally to the clustering process. It also helped improve the interpretability of the data and reduce computational complexity. PCA is applied to retain the maximum variance while reducing the number of dimensions, thereby simplifying the data while preserving the essential characteristics necessary for effective clustering. Subsequently, we used t-SNE to project the high-dimensional data into a two-dimensional space, facilitating better visualization and analysis. We employed the default hyperparameters for t-SNE: t-SNE(
For the clustering component, our algorithm, SS-DBSCAN, incorporates a novel stratified sampling technique for estimating the
FSG for MinPts
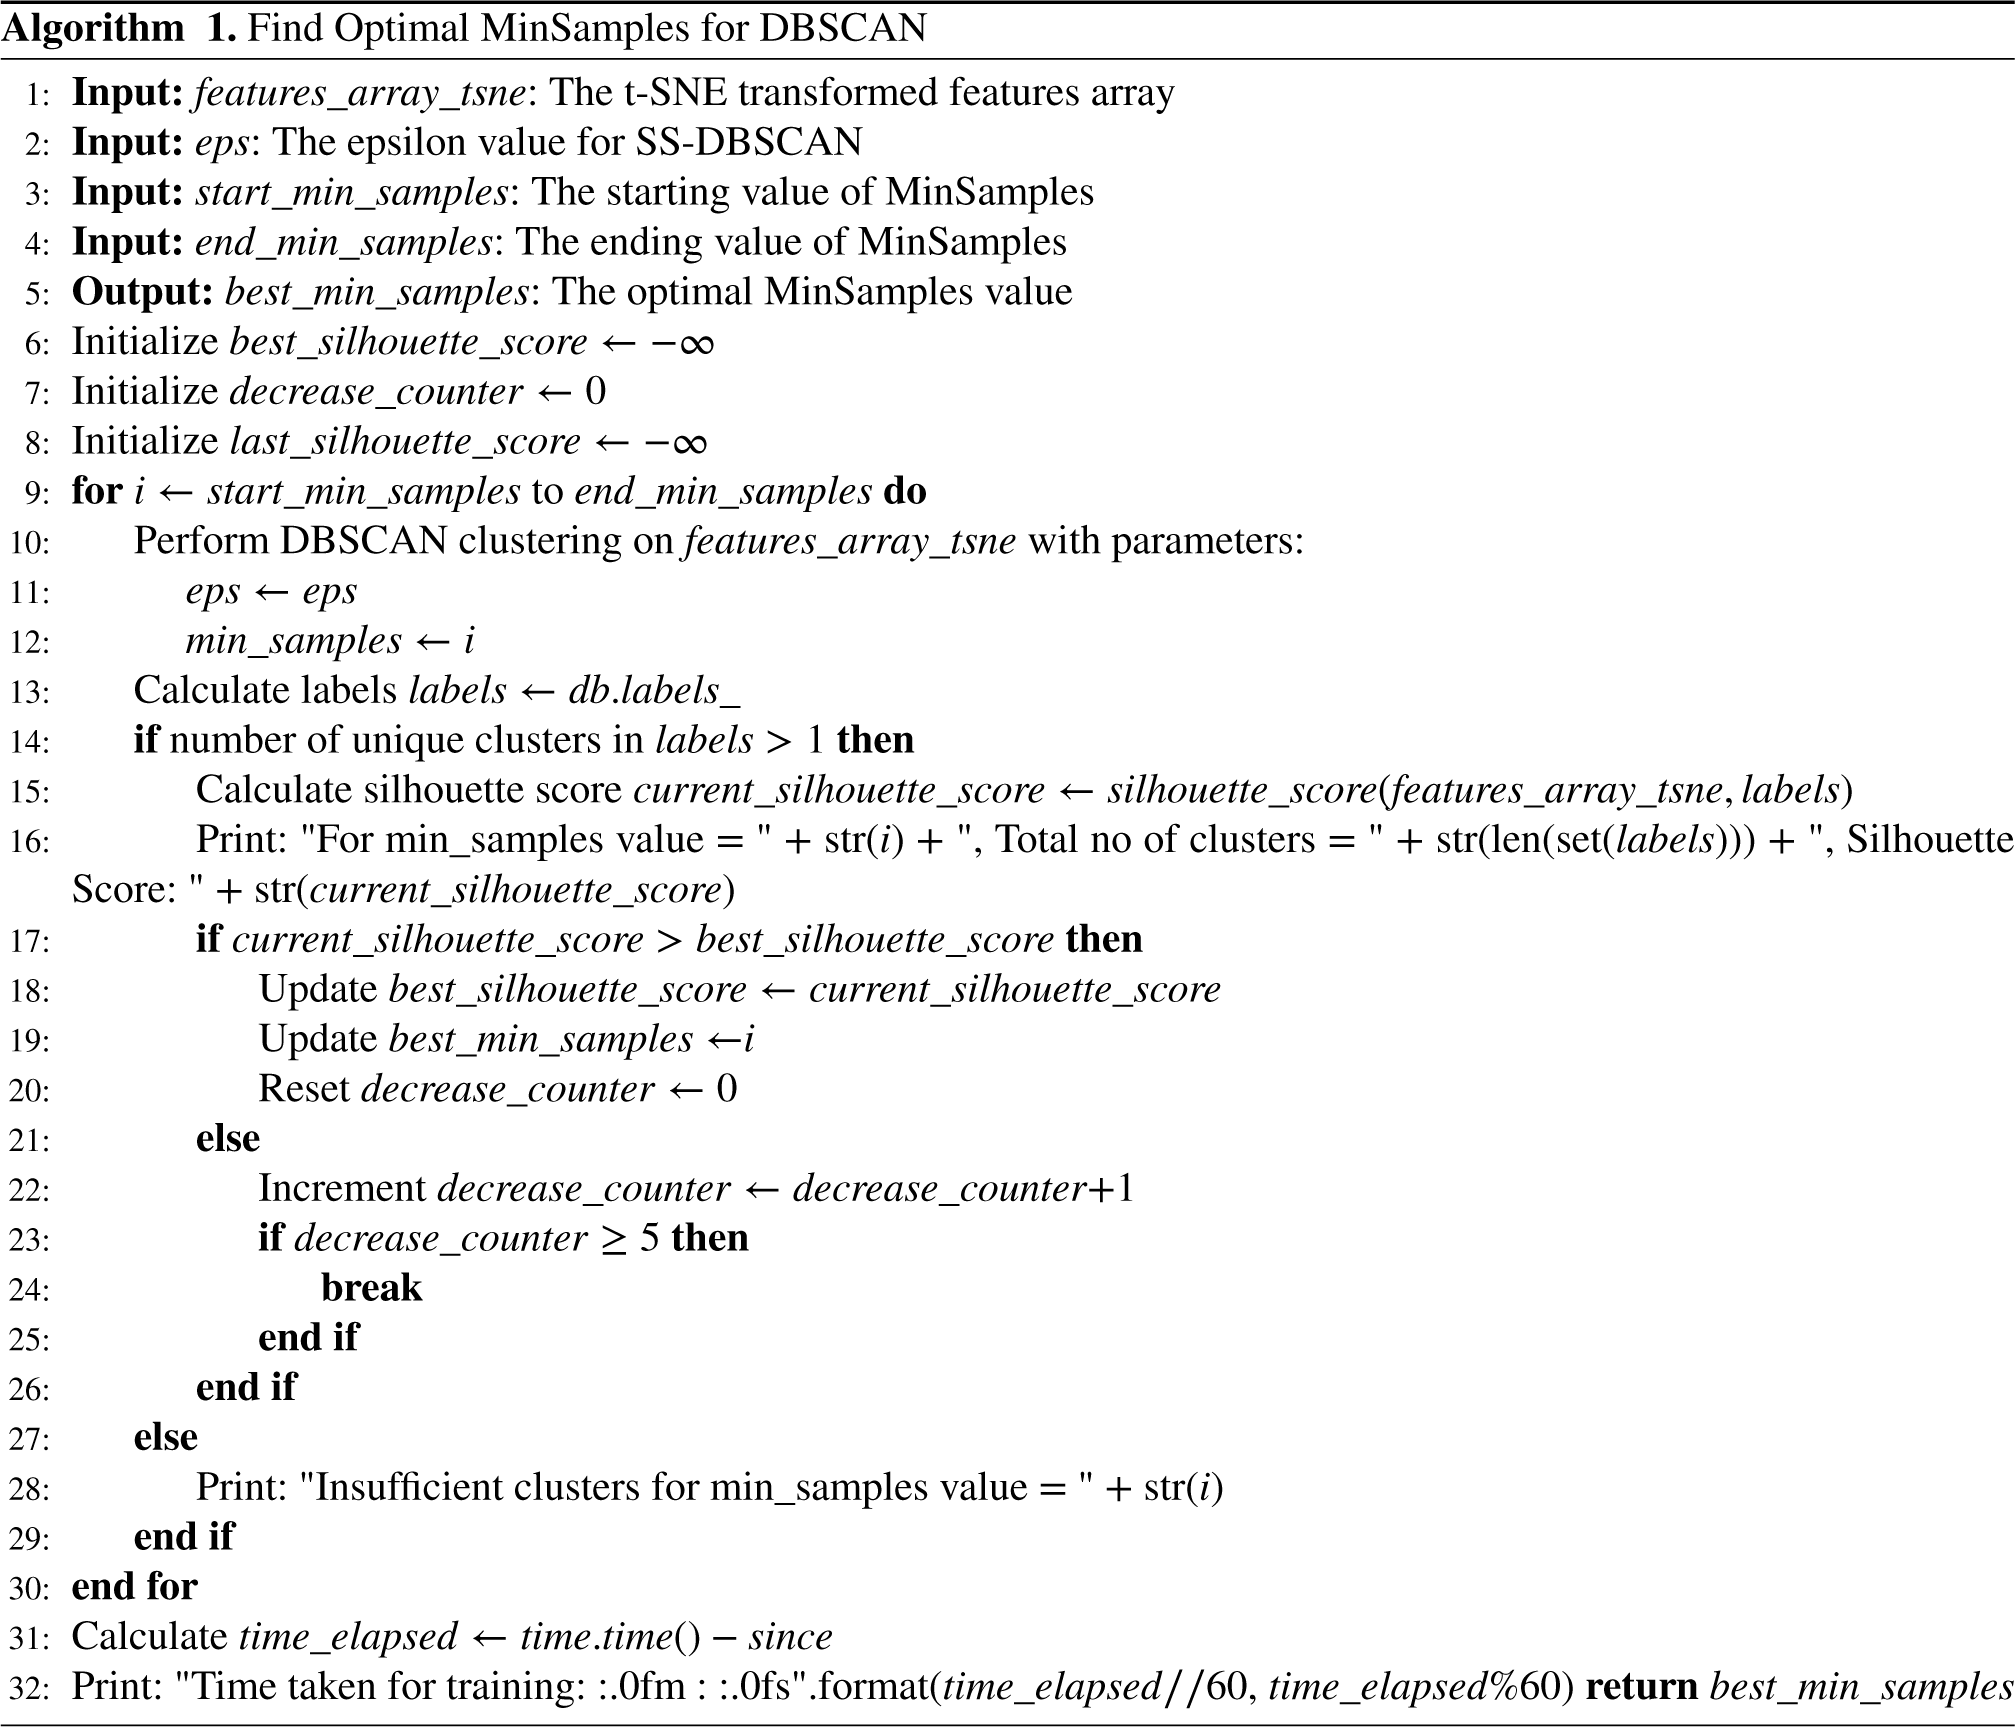
To optimize the selection of the MinPts, which dictate the core points in the DBSCAN algorithm, we implement an FSG strategy. This approach tests a range of MinPts values to pinpoint the optimal number that maximizes cluster validity, as measured by silhouette scores. This metric assesses how similar an object is to its own cluster compared to other clusters (Habib, 2021; Rousseeuw, 1987; Thinsungnoen et al., 2015). In our previous work, we employed a grid search technique to determine the optimal value for MinPts. We manually established a range, starting from 3 and extending to a maximum value, iterating by 1 or in steps of
Our novel method for selecting a single, optimal value for MinPts overcomes these limitations. It employs an adaptive range based on local density estimates. By calculating the density metrics
Calculating Density Metrics This function calculates the density metric for each point in a dataset by counting how many points lie within a certain distance Computing Standard Deviation We then compute the standard deviation of the density metrics to understand the variability or spread of the density metrics across the dataset (3). If Computing the Range for Minimum Samples Equation (4) computes a range for the MinPts parameter in SS-DBSCAN clustering based on the average density Here, Perform FSG After determining the optimal range for MinPts defined in equations (4)a and (4)b, we employ an FSG technique to identify the best value by utilizing the silhouette score as a metric shown in Algorithm 1. This approach was enhanced by iterating through the identified range and, crucially, addressing the previous issue of unnecessarily printing all values within this range. To optimize the process, we introduced a stopping criterion: after identifying the current best MinPts, the iteration continues for five additional steps, although this criterion can be adjusted to a higher number as it fits better results. If the silhouette score shows no improvement or consistently decreases during these iterations, the loop is terminated. This modification led to a significant reduction in computational time, decreasing execution from as long as 2,158 s to as short as 4 s in certain datasets, as demonstrated in Table 1. The execution time, however, increases proportionally with the data size, type, and the number of neighbors ( Through this dual optimization strategy (


We designed a comprehensive experimentation process to rigorously compare the effectiveness of various clustering algorithms across multiple datasets. In this research, we primarily worked with real-world text and numerical data of varying sizes and complexity to evaluate the effectiveness of SS-DBSCAN and other DBSCAN variants in clustering high-dimensional embeddings. The datasets selected for our experiments included Emotion-Sentiment, Coronavirus-Tweets, Cancer-Doc, Sonar, and MIMIC III, covering various applications. The datasets were chosen based on the following criteria: (1) Diversity: They include different domains such as medical records (MIMIC III, Cancer-Doc), sentiment analysis (Emotion-Sentiment, Coronavirus-Tweets), and structured data (Sonar). (2) Data Complexity: The data selected vary in structure, ensuring SS-DBSCAN’s applicability across different data types. (3) High-Dimensionality Challenges: Each dataset presents clustering challenges that standard DBSCAN struggles with, making them ideal for benchmarking our method.
The performance of each clustering algorithm was evaluated using the silhouette score and Davies–Bouldin index (DBI), whereas the silhouette score measures the quality of clustering (Habib, 2021; Rousseeuw, 1987; Thinsungnoen et al., 2015). A higher silhouette score indicates better-defined and more distinct clusters, thereby validating the effectiveness of the clustering technique. DBI was another metric used to evaluate the quality of clustering algorithms based on cluster compactness and separation (Wijaya et al., 2021). Lower DBI values (close to 0) indicate good clustering, while higher DBI values (much greater than 1) indicate poorer clustering.
Comparison of Grid Search and Fast Grid Search at Various Data Sizes.

Comparison of Grid Search and Fast Grid Search at Various Data Sizes.
Note. MinPts = minimum points.
Parameter Values and Cluster Results of Different Algorithms at Various Data Sizes of MIMIC III.

Note. DBSCAN = density-based spatial clustering of applications with noise; SS-DBSCAN = stratified sampling-DBSCAN; HDBSCAN = hierarchical DBSCAN; OPTICS = ordering points to identify the clustering structure; MinPt = minimum point.
To evaluate the effectiveness of our preprocessing and clustering methodologies, we performed comparative analyses of several algorithms across varying data sizes within the MIMIC III dataset. The primary objective of this experiment was to demonstrate the robustness of SS-DBSCAN, particularly in managing complex datasets, and to assess its performance consistency as data size increases, an area where other algorithms often exhibit limitations as seen in Table 2. The MIMIC dataset used in this study primarily consists of two distinct clusters: adverse drug reaction (ADR) and non-ADR cases. Among the algorithms tested, only SS-DBSCAN consistently identified the correct number of clusters, regardless of increasing data size. In contrast, the other algorithms produced varying numbers of clusters with inconsistent results as the dataset expanded. These findings demonstrate that the enhanced SS-DBSCAN algorithm delivers superior clustering accuracy and robustness compared to the other algorithms evaluated in this experiment. Clustering results are also visualized in Figures 2 to 5

Comparison of stratified sampling-density-based spatial clustering of applications with noise (SS-DBSCAN) results for different data sizes.

Comparison of density-based spatial clustering of applications with noise (DBSCAN) results for different data sizes.

Comparison of hierarchical density-based spatial clustering of applications with noise (HDBSCAN) results for different data sizes.

Comparison of ordering points to identify the clustering structure (OPTICS) results for different data sizes.
SS-DBSCAN employs stratified sampling for precise estimation of the
Clustering Results With DBSCAN
DBSCAN utilizes manually selected parameters based on established practices, specifically setting MinPts to 4 and
Clustering Results with HDBSCAN
Another preferred algorithm is HDBSCAN, which can handle varying density clusters without specifying the epsilon or a global density threshold. Figure 4 presents the cluster results for HDBSCAN.
Clustering Results With OPTICS
OPTICS is an extension of the DBSCAN algorithm designed to identify clusters in data with varying densities. Unlike DBSCAN, which relies on fixed parameters, OPTICS produces an ordered list of points based on their reachability distances, allowing it to reveal the clustering structure at multiple density levels. Figure 5 shows the cluster results for OPTICS algorithm.
Results for Clustering Algorithms Applied in Different Datasets
In addition to experimenting with a single dataset of various sizes, we also conducted experiments across multiple datasets using all four algorithms. The datasets included Emotion-Sentiment, Coronavirus-Tweets, Cancer-Doc, and Sonar. Our comprehensive evaluation demonstrated that SS-DBSCAN consistently outperformed the other algorithms across all datasets and data sizes by the use of parameter values indicated in Table 3. The results of these experiments are presented in Figure 6, providing a quantitative comparison of clustering performance. These visualizations highlight the algorithm’s ability to effectively manage varying data densities and complex structures, reinforcing its robustness and applicability across different types of high-dimensional data.
Parameter Values and Cluster Results of Different Algorithms on Various Datasets.

Parameter Values and Cluster Results of Different Algorithms on Various Datasets.
Note. DBSCAN = density-based spatial clustering of applications with noise; SS-DBSCAN = stratified sampling-DBSCAN; HDBSCAN = hierarchical DBSCAN; OPTICS = ordering points to identify the clustering structure; MinPt = minimum point.
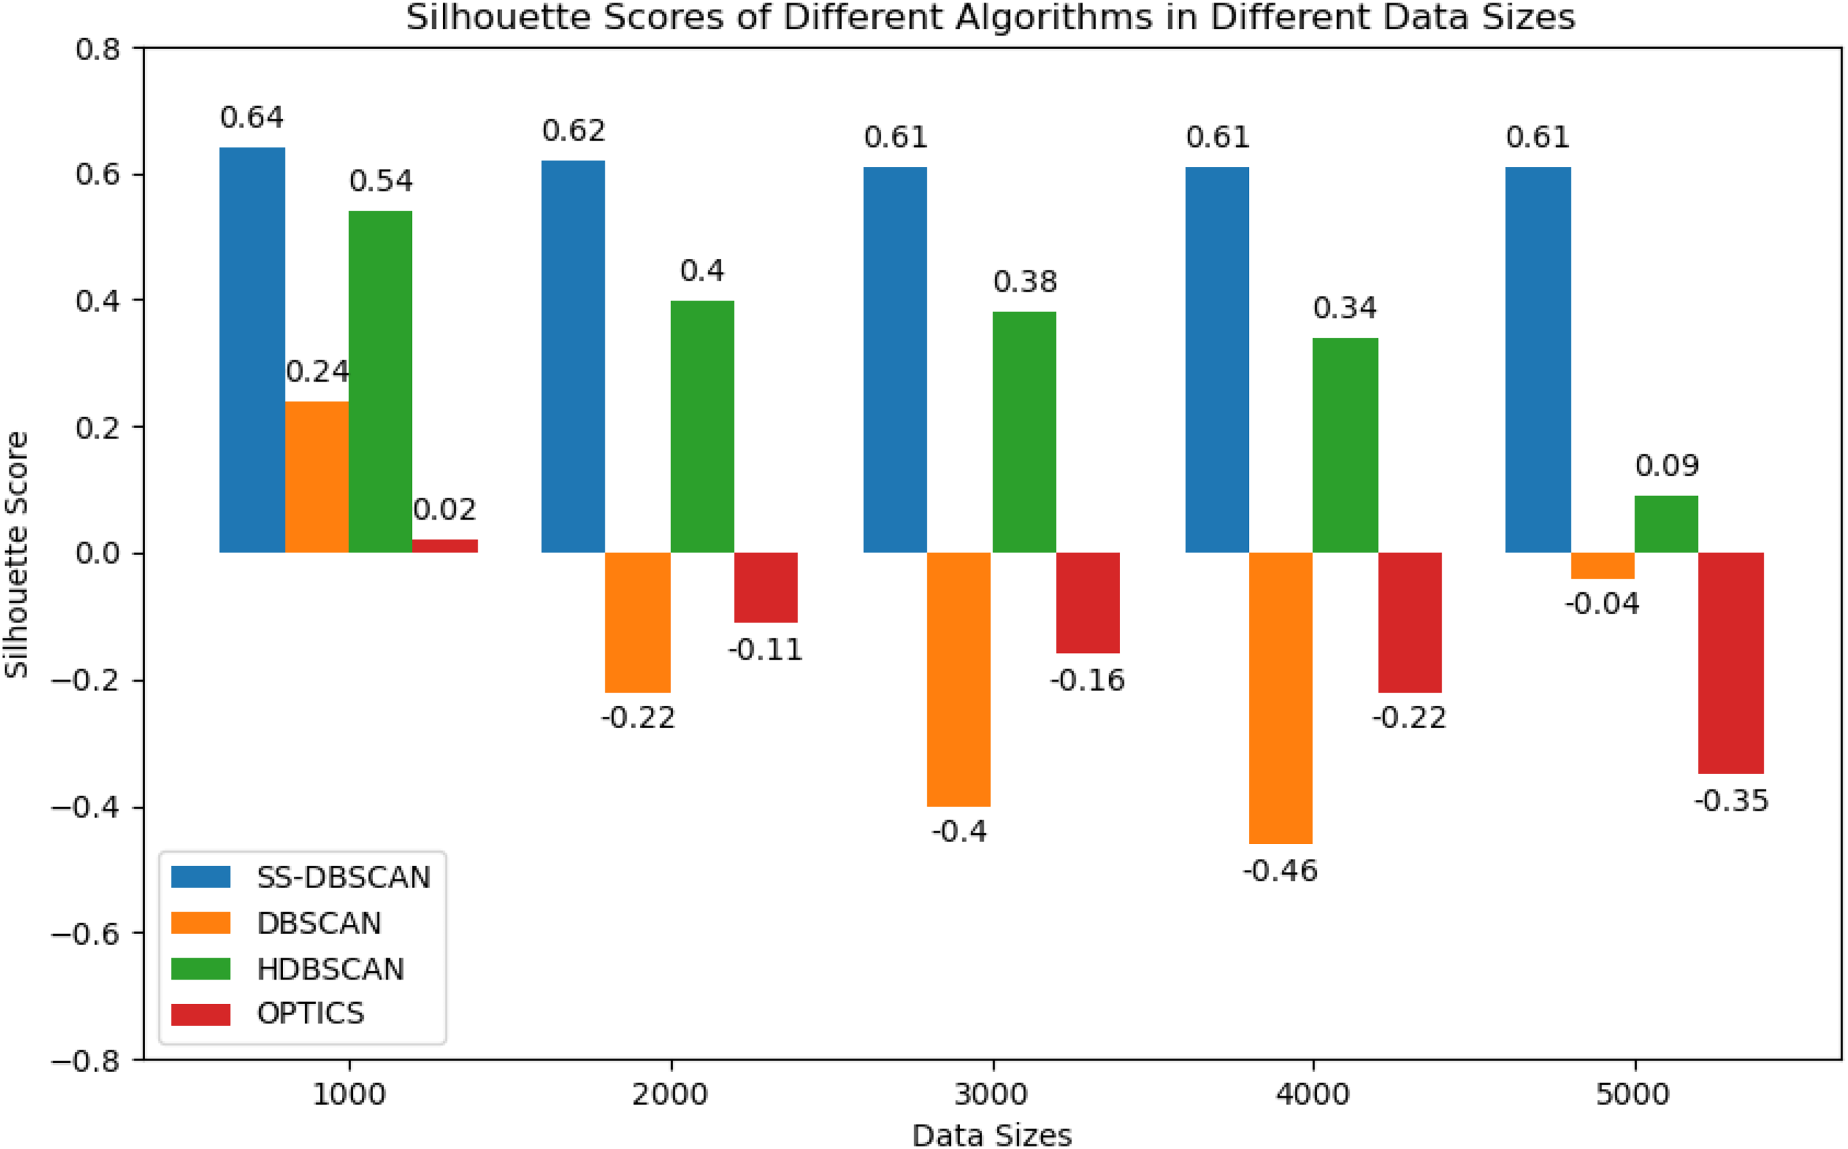
Algorithms’ performances in different data sizes of MIMIC III.
Each clustering technique is applied to the preprocessed data, and its performances are compared across algorithms with different data sizes and datasets. The clustering effectiveness is analyzed in the context of the data’s size, complexity, and high dimensionality, taking into account the nuances and variability inherent in these datasets.
Our results in Figures 7 and 6 demonstrate the effectiveness of SS-DBSCAN in achieving more reliable and meaningful clustering outcomes than other DBSCAN variants. More results are described in Tables 4 and 5. The stratified sampling approach for

Algorithms’ performance in different datasets of 4,000 size.
Our implementation of SS-DBSCAN significantly enhances the clustering process by allowing us to precisely select the optimal values for
In the standard DBSCAN framework, the MinPts parameter is typically determined using a heuristic based on the dataset’s dimensionality, often set at twice the number of dimensions. In our study, after reducing the data’s dimensionality from 768 to 2, we applied a MinPts value of 4 following this rule of thumb. However, this approach is somewhat arbitrary and fails to accurately reflect the true density distribution in more complex datasets. Consequently, this led to suboptimal clustering results as shown in our experiments.
On the other hand, HDBSCAN, another variation of DBSCAN, adjusts its sensitivity based on several parameters such as min_cluster_size, min_samples, and alpha. The performance of HDBSCAN hinges significantly on the appropriate selection of min_cluster_size. Ineffective choices for this parameter can lead to poor clustering results, whereas optimal parameter tuning can considerably enhance the clustering quality. However, as the data size increases, the performance of HDBSCAN reduces, often returning meaningless clusters, as seen in Figure 4.
OPTICS was also included in our experiment to explore its potential advantages over traditional density-based methods such as DBSCAN and HDBSCAN. OPTICS attempts to uncover the clustering structure of data by ordering points based on their density-reachability. However, in our experiments, OPTICS underperformed in all datasets, as illustrated in Figures 5 and 6. The algorithm’s sensitivity to initial parameter settings (min_samples, xi, min_cluster_size, metric), coupled with its computational complexity, resulted in very poor clusters. OPTICS struggled to adapt to the intricate density variations in the data, ultimately producing less meaningful clustering outcomes.
Therefore, SS-DBSCAN distinguishes itself from other algorithms by incorporating stratified sampling to determine the best values for
Silhouette and DBI Scores of Different Algorithms at Various Data Sizes of MIMIC III.

Silhouette and DBI Scores of Different Algorithms at Various Data Sizes of MIMIC III.
Note. DBI = Davies–Bouldin index; DBSCAN = density-based spatial clustering of applications with noise; SS-DBSCAN = stratified sampling-DBSCAN; HDBSCAN = hierarchical DBSCAN; OPTICS = ordering points to identify the clustering structure.
DBI Scores of Different Algorithms on Various Datasets.

Note. DBI = Davies–Bouldin index; DBSCAN = density-based spatial clustering of applications with noise; SS-DBSCAN = stratified sampling-DBSCAN; HDBSCAN = hierarchical DBSCAN; OPTICS = ordering points to identify the clustering structure.
In this paper, we enhanced the SS-DBSCAN and evaluated its performance in different data sizes and 1on different datasets. Our findings underscore the adaptability and robustness of SS-DBSCAN, especially in handling large and complex data. The unique parameter optimization approach of SS-DBSCAN enhances its efficacy in identifying meaningful clusters vital for data mining and decision-making. Below, we discuss several aspects of SS-DBSCAN’s application and the implications of our results:
Noise Sensitivity
SS-DBSCAN performed better in managing noise in all datasets used for the experiment than traditional DBSCAN, HDBSCAN, and OPTICS. In contrast to standard DBSCAN, which relies on a fixed global
Scalability
The scalability of SS-DBSCAN was rigorously evaluated using the MIMIC III dataset, a large and complex real-world dataset. The results demonstrate the algorithm’s efficiency in handling extensive data volumes while maintaining high-quality clustering performance. This establishes SS-DBSCAN as a highly suitable solution for large-scale datasets where computational efficiency and time constraints are critical factors. Furthermore, the algorithm’s flexibility in determining both the
Parameter Adaptivity and Robusteness
Our methodology dynamically adjusts
Cluster Validation
We employed a silhouette statistical measure and DBI to validate the clusters generated by SS-DBSCAN. Both silhouette and DBI scores confirm the distinctiveness and relevance of the clusters. In comparison with other algorithms used in our experiment, SS-DBSCAN stands out for its robustness and precision. Unlike methods that require extensive parameter tuning and may not form clusters effectively, SS-DBSCAN adapts its parameters automatically, offering more reliable clustering even in complex datasets.
Importance of Dimensionality Reduction
The S-BERT embeddings used in this study are 768-dimensional, and directly applying clustering algorithms such as SS-DBSCAN and others to such high-dimensional data has proven ineffective due to the curse of dimensionality. High dimensionality distorts distance metrics used in density-based clustering, increases computational complexity, and reduces interpretability and cluster separability. Therefore, dimensionality reduction is essential in clustering high-dimensional data, as it enhances cluster separability, reduces noise, and improves computational efficiency. While the choice of technique is not limited to a specific method, our research found that the combination of PCA and t-SNE yielded the best results for all algorithms used in our experiments. PCA removes noise and extracts principal features, while t-SNE preserves local structure and adapts to varying cluster densities, leading to better-defined clusters across different dataset sizes. Other techniques, such as Uniform Manifold Approximation and Projection (UMAP; McInnes et al., 2018), can also be used, but our experiments showed key differences. UMAP performed well on smaller datasets, producing compact clusters, but as dataset size increased, it introduced significant noise and fragmented clusters. In contrast, PCA
Limitations and Future Work
While we recognize that text data, particularly in high-dimensional embedding spaces, does not typically form spherical clusters, our experiments demonstrated that SS-DBSCAN could still identify meaningful and well-separated clusters with some datasets such as MIMIC III. This is attributed to the algorithm’s ability to adaptively estimate local density thresholds and handle complex, nonlinear cluster boundaries. Although we utilized the silhouette score and DBI to evaluate clustering performance metrics that traditionally favor spherical cluster structures, we observed that these metrics provided reasonable insights into cluster compactness and separation in our context. Nevertheless, these measures may not fully capture the structure of density-based, nonspherical clusters. As such, in future work, we plan to incorporate the density-based clustering validation index, which is more suitable for evaluating the quality of arbitrarily shaped clusters, thereby offering a more robust and accurate assessment of SS-DBSCAN’s performance on text data.
Future research could also explore the applicability of our technique to a broader range of datasets beyond those considered in this study. Our work primarily focused on text-based and structured (numerical) real-world data, where the proposed approach demonstrated effectiveness in handling high-dimensional and complex data distributions. However, its performance on other datasets, such as image, audio, or multi-modal data, remains an open question. Investigating how our method adapts to different data structures and domains would be a valuable direction for future work, potentially enhancing its generalizability and robustness across diverse applications.
Conclusion
In this study, we introduced an enhanced SS-DBSCAN algorithm designed to improve parameter selection and noise handling in complex and high-dimensional datasets. By leveraging adaptive
Our experiments demonstrate that SS-DBSCAN excels in clustering diverse datasets, including text embeddings and structured numerical data. The algorithm dynamically adapts to varying density distributions, ensuring more accurate cluster formations while reducing the risk of misclassification. Additionally, its efficiency in handling large data volumes makes it a valuable tool for real-world clustering applications in domains such as biomedical informatics, social media analysis, and anomaly detection.
Beyond improving clustering accuracy, these enhancements strengthen the interpretability of cluster structures, providing deeper, actionable insights into complex datasets. Such insights are crucial for data-driven decision-making in research and industry.
Footnotes
Funding
The authors received no financial support for the research, authorship, and/or publication of this article.
Declaration of Conflicting Interests
The authors declared no potential conflicts of interest with respect to the research, authorship, and/or publication of this article.
Appendix A: Dataset Formatting for S-BERT
While preparing the MIMIC III dataset, we selected clinically meaningful features such as patient age, gender, admission type, prescribed medications, diagnosis description, and clinical notes. To generate context-sensitive embeddings using S-BERT, we first preprocessed structured and semi-structured clinical records. This included removing punctuation, lowercasing, and segmenting relevant text fields. The resulting text inputs, formatted as plain natural language, were then passed to the S-BERT encoder. Below are representative examples from the MIMIC III dataset formatted for embeddings.