



Abstract
To balance growing single-family housing demand with the pursuit of compact development goals, the design of single-family subdivisions plays a crucial role. Despite emerging efforts to develop alternative zoning approaches and subdivision optimization methods, a key gap remains in the lack of a systematic understanding of the quantitative relationship between distinct zoning parameters and compact single-family subdivision outcomes, as well as the relative differences inherent in these relationships. In response, this study quantifies these relationships through a five-stage research design, in which building coverage ratio (BCR) and housing density are used to measure single-family subdivision compactness, and a Quasi-Monte Carlo Subdivision Simulator (QMCSS) is developed and calibrated with real-world data to simulate a wide range of single-family subdivision samples. The generated samples and associated compactness measurements are then used to fit both univariable and multivariable models. The results reveal nuanced insights into the relative effects of key zoning parameters across both linear and nonlinear models. For example, parcel width exerts the strongest influence on housing density, while side setbacks contribute most to variations in BCR. Collectively, the findings contribute new quantitative evidence to the literature and shed light on the development of finer-grained, data-informed zoning approaches for promoting compact single-family development in American contexts and comparable regulatory settings.
Introduction
Single-family residential, a dominant low-density development type preferred by most American homebuyers (Quint, 2024; Stone, 2025), plays a critical role in meeting the housing needs of growing populations, both now and in the foreseeable future (Berger and Kotkin, 2018; Joint Center for Housing Studies of Harvard University, 2025; Kaul et al., 2021). While a fraction of single-family residential development is located in higher-density urban centers, the vast majority is concentrated along the urban fringe (Heid, 2004). These regions, predominantly composed of single-family residential with population densities typically ranging from 1,000 to 3,000 persons per square mile, are commonly referred to as suburbs in the American context (Airgood-Obrycki et al., 2021). Although often dismissed as “sprawl,” American suburban single-family development is in fact shaped by a well-defined framework of land-use laws and development regulations, most commonly codified in zoning ordinances (Southworth and Owens 1993; Ziegler, 1983). Guided by such legal frameworks, a larger parcel of land designated for single-family residential is divided into smaller, individually owned lots through various zoning parameters (e.g., block size, parcel width, and setbacks)—a process referred to as subdivision (Freilich and Shultz, 1995). Over the past several decades, suburban single-family subdivisions shaped by Conventional Zoning Codes (CZCs) have faced widespread criticism for promoting low-density expansion, which in turn limits development potential, leads to inefficient land use, fosters car dependency, and ultimately exacerbates housing unaffordability and equity concerns (Brody, 2013; Bronin, 2023; Ewing, 1997, 2005; Forsyth, 2012; Talen, 2013).
In response, some scholars and policymakers alike have increasingly advocated for eliminating exclusive single-family zoning, often referred to in policy discussions as “upzoning” (Freemark, 2020; Kim, 2023), in favor of expanding middle-housing options and promoting more compact residential development with attendant efficiencies in land and resource use (Parolek, 2020; Smith and Billig, 2012). Research has highlighted the wide-ranging benefits of such compact forms (Ewing and Cervero, 2017), including encouraging walking and transit use (Brown et al., 2008), reducing residential energy consumption (Ewing and Rong, 2008), increasing sense of community (Kim, 2007), and many others. However, these efforts frequently confront market realities in which both developers and homebuyers exhibit a strong near-term preference for detached single-family housing (National Association of Home Builders, 2024; U.S. Census Bureau, 2025).
Another set of more pragmatic efforts, rather than seeking the wholesale elimination of suburban single-family subdivisions, examines how compact urban forms can be achieved by developing appropriately single-family subdivisions that both improve land-use efficiency and meet the requirements of sufficiently dense development (Bradecki and Katny, 2020; Smith and Billig, 2012). In line with this trend, approaches such as New Urbanism and traditional neighborhood design have gained substantial traction in American planning and design discourse over the past two decades. New Urbanists introduced Form-Based Codes (FBCs) in the late twentieth century as an alternative to CZCs, placing primary emphasis on regulating built form to achieve more compact development outcomes across diverse urban zones, including suburban regions (Parolek et al., 2008).
Setback dimensions from selected codes.

To address the aforementioned uncertainty, ambiguity, and subjectivity involved in setting zoning parameters and achieving desired subdivision outcomes, a longstanding line of research has examined the quantitative relationships between zoning parameters and optimal outcomes in American neighborhood development (Cannaday and Colwell, 1990; Chakrabarty, 1991; Colwell and Scheu, 1998). However, these former efforts tend to examine individual zoning parameters in isolation, leaving the relative influence of different parameters on single-family subdivision outcomes insufficiently understood. Taken together, the emerging gap lies in a lack of a systematic understanding of the quantitative relationships between distinct zoning parameters and compact single-family subdivision outcomes, as well as the relative differences inherent in these relationships. While zoning is a “wicked” problem that extends beyond the reach of purely quantitative solutions and inevitably involves socio-economic factors (Glaeser and Ward, 2009; Serkin, 2020), evidence-based relationships between zoning parameters and development outcomes remain an essential layer for cities and landholding developers to support data-driven zoning decision-making, particularly given the substantial financial consequences of subdivision processes (Thorsnes, 2000; Wrenn and Irwin, 2015).
Therefore, this study addresses this gap through a five-stage research design. First, a set of specific indicators is defined to quantify single-family subdivision compactness. Second, to enhance generalizability and analytical efficiency, an experimental simulation platform, Quasi-Monte Carlo Subdivision Simulator (QMCSS), is developed as an alternative to surveying a large number of real-world subdivision blocks. Third, baseline subdivision data are curated from existing zoning ordinances, development plans, and measurements of selected real-world single-family residential blocks to calibrate QMCSS input settings. In the fourth stage, QMCSS simulates predefined number of single-family subdivision samples using six key zoning parameters: block size, street width, parcel width, and front, side, and rear setbacks. Each sample is evaluated using indicators introduced in the first stage. Finally, a series of univariable and multivariable models are fitted using the simulated samples to quantify the relationships between the zoning parameters and the indicators.
This study aims to provide finer-grained insights into the quantitative relationships between zoning parameters and single-family subdivision outcomes. By linking specific zoning parameters to measurable indicators using both linear and nonlinear approaches, the study contributes new quantitative evidence to academic discussion on emerging zoning approaches and broader zoning reforms. At the same time, it offers actionable, context-sensitive, and data-informed guidance for planners, urban designers, developers, and policymakers working within the American context or in jurisdictions governed by similar regulatory frameworks to realize compact single-family subdivision outcomes in a more efficient manner. The analytical framework developed in this study also holds potential for examining similar issues in irregular subdivision patterns and development types beyond single-family residential.
Methods and materials
The five stages of research design (Figure 1) are detailed in the corresponding subsections: the first defines the indicators used to represent single-family subdivision compactness; the second describes the development of the QMCSS; the thrid explains the acquisition of baseline data to calibrate simulation settings; the fourth details the curation of QMCSS inputs and the selection of simulation algorithms; and the fifth outlines the construction of quantitative models. Research design.
Defining subdivision compactness
This stage defines the specific indicators used to measure single-family subdivision compactness. Since the early debates between urban sprawl and compact development highlighted in a pair of point–counterpoint articles, the question of how to measure compactness, or its counterpart sprawl, has remained a central topic in contemporary urbanization discourse (Ewing and Hamidi, 2015). To date, the measurement of development compactness has encompassed a wide range of indices covering population, land use, urban form, and transportation attributes (Abdullahi et al., 2018; Angel et al., 2020; Tsai, 2005). Among these indices, many of which have been developed at the city and regional scales (Artmann et al., 2019), urban form-based metrics are generally considered more suitable for neighborhood-scale compactness assessment (Rahman et al., 2022), where single-family subdivisions are implemented.
Given the relatively homogeneous design and spatial distribution of single-family subdivisions, urban form–based metrics that assess uneven distribution or mixed-use intensity, such as centering, evenness of distribution, and land-use mix (Hamidi and Ewing, 2014; Lee and Gordon, 2007), offer limited explanatory power for comparing alternative subdivision scenarios. Instead, drawing on prior research, this study adopts housing density and building coverage ratio (BCR) as indicators of subdivision compactness.
Housing density
Density has been commonly adopted in previous research as the most straightforward and effective indicator (Mouratidis, 2018). While population density (people per unit area) is commonly used in prior research, this study adopts housing density (dwelling units per acre) for two reasons: it is a metric commonly applied in American housing development industry, and, when average household size is held constant, it serves as a reasonable proxy for population density. The formulation for calculating housing density is as follows:
Building coverage ratio (BCR)
BCR measures the proportion of a building’s ground floor area relative to the total site area (Usui and Asami, 2024) and is widely recognized as a key indicator of compact urban form (Chen et al., 2006). Notably, BCR can be used in both ways of a zoning parameter regulating individual parcels or an outcome metric to represent the realized building coverage of a specific development scope. As a zoning parameter, BCR serves as a close proxy to the floor area ratio (FAR) or plot ratio in single-family residential developments, where building heights are typically low and relatively uniform across neighborhoods. For the later usage, BCR, as a measure of built form intensity, is closely associated with a range of economic and environmental performance outcomes (Cao et al., 2020; Le et al., 2022), underscoring its analytical relevance in evaluating compact development patterns. For the purpose of this research, BCR is defined as the realized building coverage applied to the whole site. The formulation for measuring BCR is presented below:
Emulating subdivision process
In the second stage, a Quasi–Monte Carlo Subdivision Simulator (QMCSS) is developed to emulate the typical single-family residential subdivision process within the Rhino3D environment (Robert McNeel & Associates, n.d). Typological single-family subdivision patterns can generally be categorized as gridiron, parallel, or lollipop (Southworth and Owens, 1993). Compared to other patterns, the gridiron block has dominated American neighborhood development since the pre–World War II era, forming the foundational structure of many cities (Alexander, 2024). Although such “griddedness” declined in the 1940s and throughout the latter half of the twentieth century, it has rebounded since 2000, driven by three key factors: (1) the emergence of certification standards such as LEED-ND; (2) better-planned redevelopment and retrofit projects in recent years; and (3) shifts in market demand (Boeing, 2021). Moreover, because higher “griddedness” is associated with lower car ownership, greater connectivity and accessibility, reduced vehicle miles traveled (VMT), and lower greenhouse gas emissions, interconnected gridiron layouts are generally favored by compact development paradigms over other subdivision patterns (Barrington-Leigh and Millard-Ball, 2019; Boeing, 2021; Handy, 2017; Sevtsuk et al., 2016). Therefore, the gridiron subdivision pattern is adopted as the archetype emulated by the QMCSS.
The QMCSS employs six zoning parameters relevant to the regulation of single-family subdivisions, as delineated in prior research (Beebe, 1956; Colwell and Scheu, 1998): block dimensions (length c and width d), street width (e), parcel width (f), and setback requirements (front h, side g, and rear i). The emulation process follows three key steps (Figure 2). First, based on block length (c), block width (d), and street width (e), individual blocks are generated within the site boundary defined by site length (a) and width (b). Next, each block is subdivided into individual parcels according to the specified parcel width (f). Finally, front, side, and rear setback dimensions (h,g,i) are applied to determine the buildable area within each parcel. Typological single-family subdivision process.
Acquiring baseline data
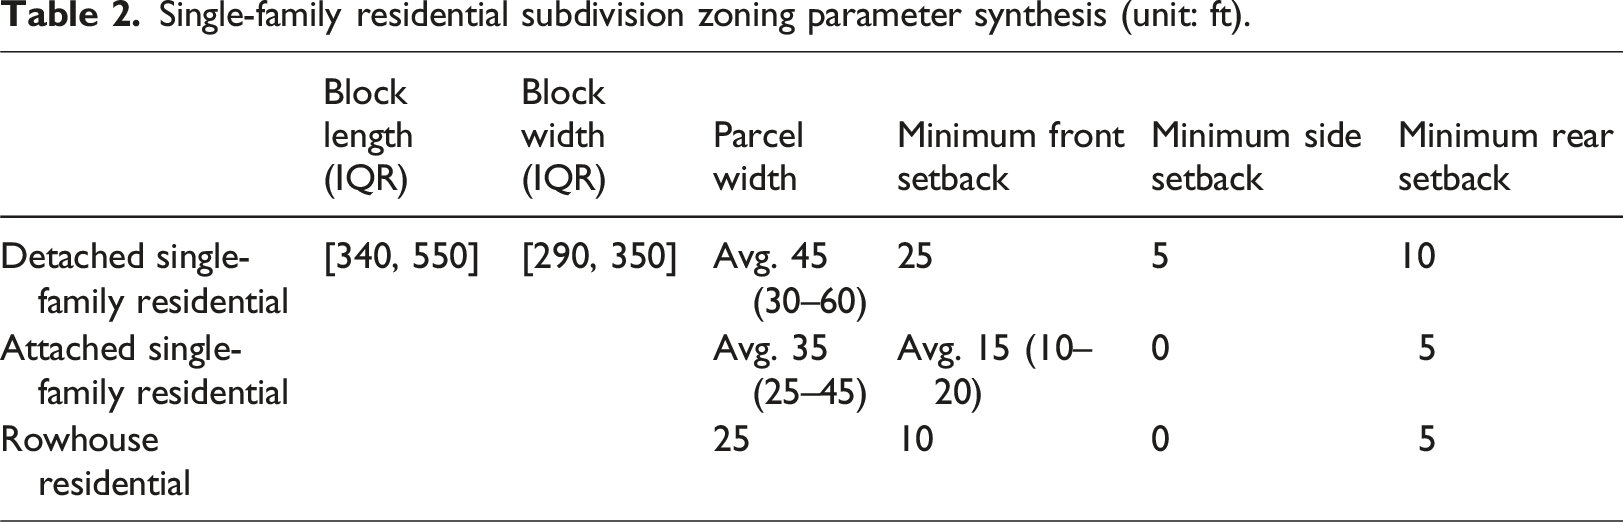
The third stage calibrates the QMCSS input settings using a synthesized set of baseline conditions derived from zoning ordinances across multiple U.S. cities (Supplement Material Table S1), representative development plans (Southstar Communities and City of New Braunfels, 2024; DPZ CoDesign, n.d.; Kissing Tree, n.d.; Southstar, n.d.; Turnleaf Manteca, n.d.), established literature on American suburban residential development (Hirt, 2013; Hoyt, 1939; Vialard et al., 2021), and empirical measurements of real-world single-family residential blocks (Supplement Material Figure S1 and Table S2). Notably, the baseline data curated in this study are intended solely to guide the input range settings for QMCSS and are not intended to serve as precise or exhaustive measurements of American suburban residential subdivisions.
Single-family residential subdivision zoning parameter synthesis (unit: ft).
Iterating and evaluating subdivision samples
In the fourth stage, the Quasi-Monte Carlo (QMC) method is selected to generate a predefined number of subdivision samples for further analysis. QMC are a class of numerical techniques that improve upon traditional Monte Carlo simulations by using low-discrepancy sequences, specifically the Sobol sequence in this research, to generate sample points that more uniformly cover the input space (Soboĺ, 1998). The method is selected for its ability to ensure a more even and deterministic distribution of samples (Caflisch, 1998). Unlike random sampling in standard Monte Carlo methods, QMC enhances convergence rates and reduces variance in the results (Soboĺ, 1990).
Considering the accuracy requirements of the subsequent quantitative model fitting, the simulated sample size is set to 1,000. The input parameters for executing QMCSS are provided in Supplement Material Table S3. After completing the iterations, each sample is evaluated using BCR and housing density. The zoning parameters and corresponding evaluation results are then paired and stored for fitting quantitative models.
Fitting quantitative models
Ultimately, two sets of quantitative models are constructed and fitted using the simulated samples to quantify the relationships between zoning parameters and compactness indicators, as outlined in Supplement Material Table S4. The first set (Models 1–12) consists of univariable Ordinary Least Squares (OLS) regressions, each estimating the marginal association between a single zoning parameter and a compactness indicator. The second set includes multivariable models, encompassing both linear and nonlinear specifications. The linear multivariable models (Models 13–14) are estimated using multivariable OLS regression and represent the full specification that jointly incorporates all zoning parameters examined in Models 1–12, along with an interaction term to capture conditional effects. The specification of the interaction term is determined by whether the parameters shape the subdivision independently or interdependently, as illustrated in Figure 2. The full multivariable model is specified as follows:
The nonlinear models are estimated using a suite of machine-learning (ML) techniques, including XGBoost (Chen and Guestrin, 2016), Random Forest (Breiman, 2001), Artificial Neural Networks (ANNs; Goodfellow et al., 2016), and Support Vector Regression (SVR). A Shapley Additive exPlanations (SHAP) analysis (Huang et al., 2020) is then performed on the best-performing nonlinear models to assess the relative contributions of individual zoning parameters to each compactness indicator. Detailed model configurations and hyperparameter settings are summarized in Supplement Material Table S4. During model fitting, all variables are standardized using the Z-scoring method to ensure that the resulting coefficients are aligned and comparable. The equation used for Z-score normalization is presented below:
The purpose of fitting nonlinear models is twofold. First, they serve to validate the findings of the linear models by assessing whether relationships inferred from OLS persist when linearity assumptions are relaxed. Second, they provide a more comprehensive assessment of the relative effects of zoning parameters on compact single-family subdivision outcomes by capturing potential nonlinearities and interaction patterns that may not be fully reflected in linear specifications, particularly given the inherently nonlinear, iterative, and constraint-driven nature of subdivision design processes.
Results
This section validates whether the variables of the generated subdivision samples are well distributed to ensure generalizability and then presents the fitting results.
Subdivision sample validation
Prior to model fitting, all 1,000 single-family subdivision samples were examined using descriptive statistics (Supplement Material Table S5), scatter plots (Figure 3, bottom), and a parallel coordinate plot (Figure 3, top). The descriptive statistics confirm that both the independent variables (zoning parameters) and dependent variables (compactness indicators) are well distributed across their respective ranges and align with real-world measurements (Supplement Material Table S2). The parallel coordinate plot and scatter plots further demonstrate that both zoning parameters and compactness indicators are evenly distributed across their respective ranges. These results validate the effectiveness of the QMC sampling method in generating a well-distributed simulation space, which in turn enhances the reliability and generalizability of model estimates and increases statistical power for identifying meaningful relationships between zoning parameters and compactness outcomes. Simulation validation. Top: parallel coordinate plot; bottom: scatter plots. In the parallel coordinate plot, each column represents an independent variable (zoning parameter) or a dependent variable (compactness indicator), as labeled at the top. Each horizontal line corresponds to a single sample, with its intersections along the columns indicating the specific values for each variable.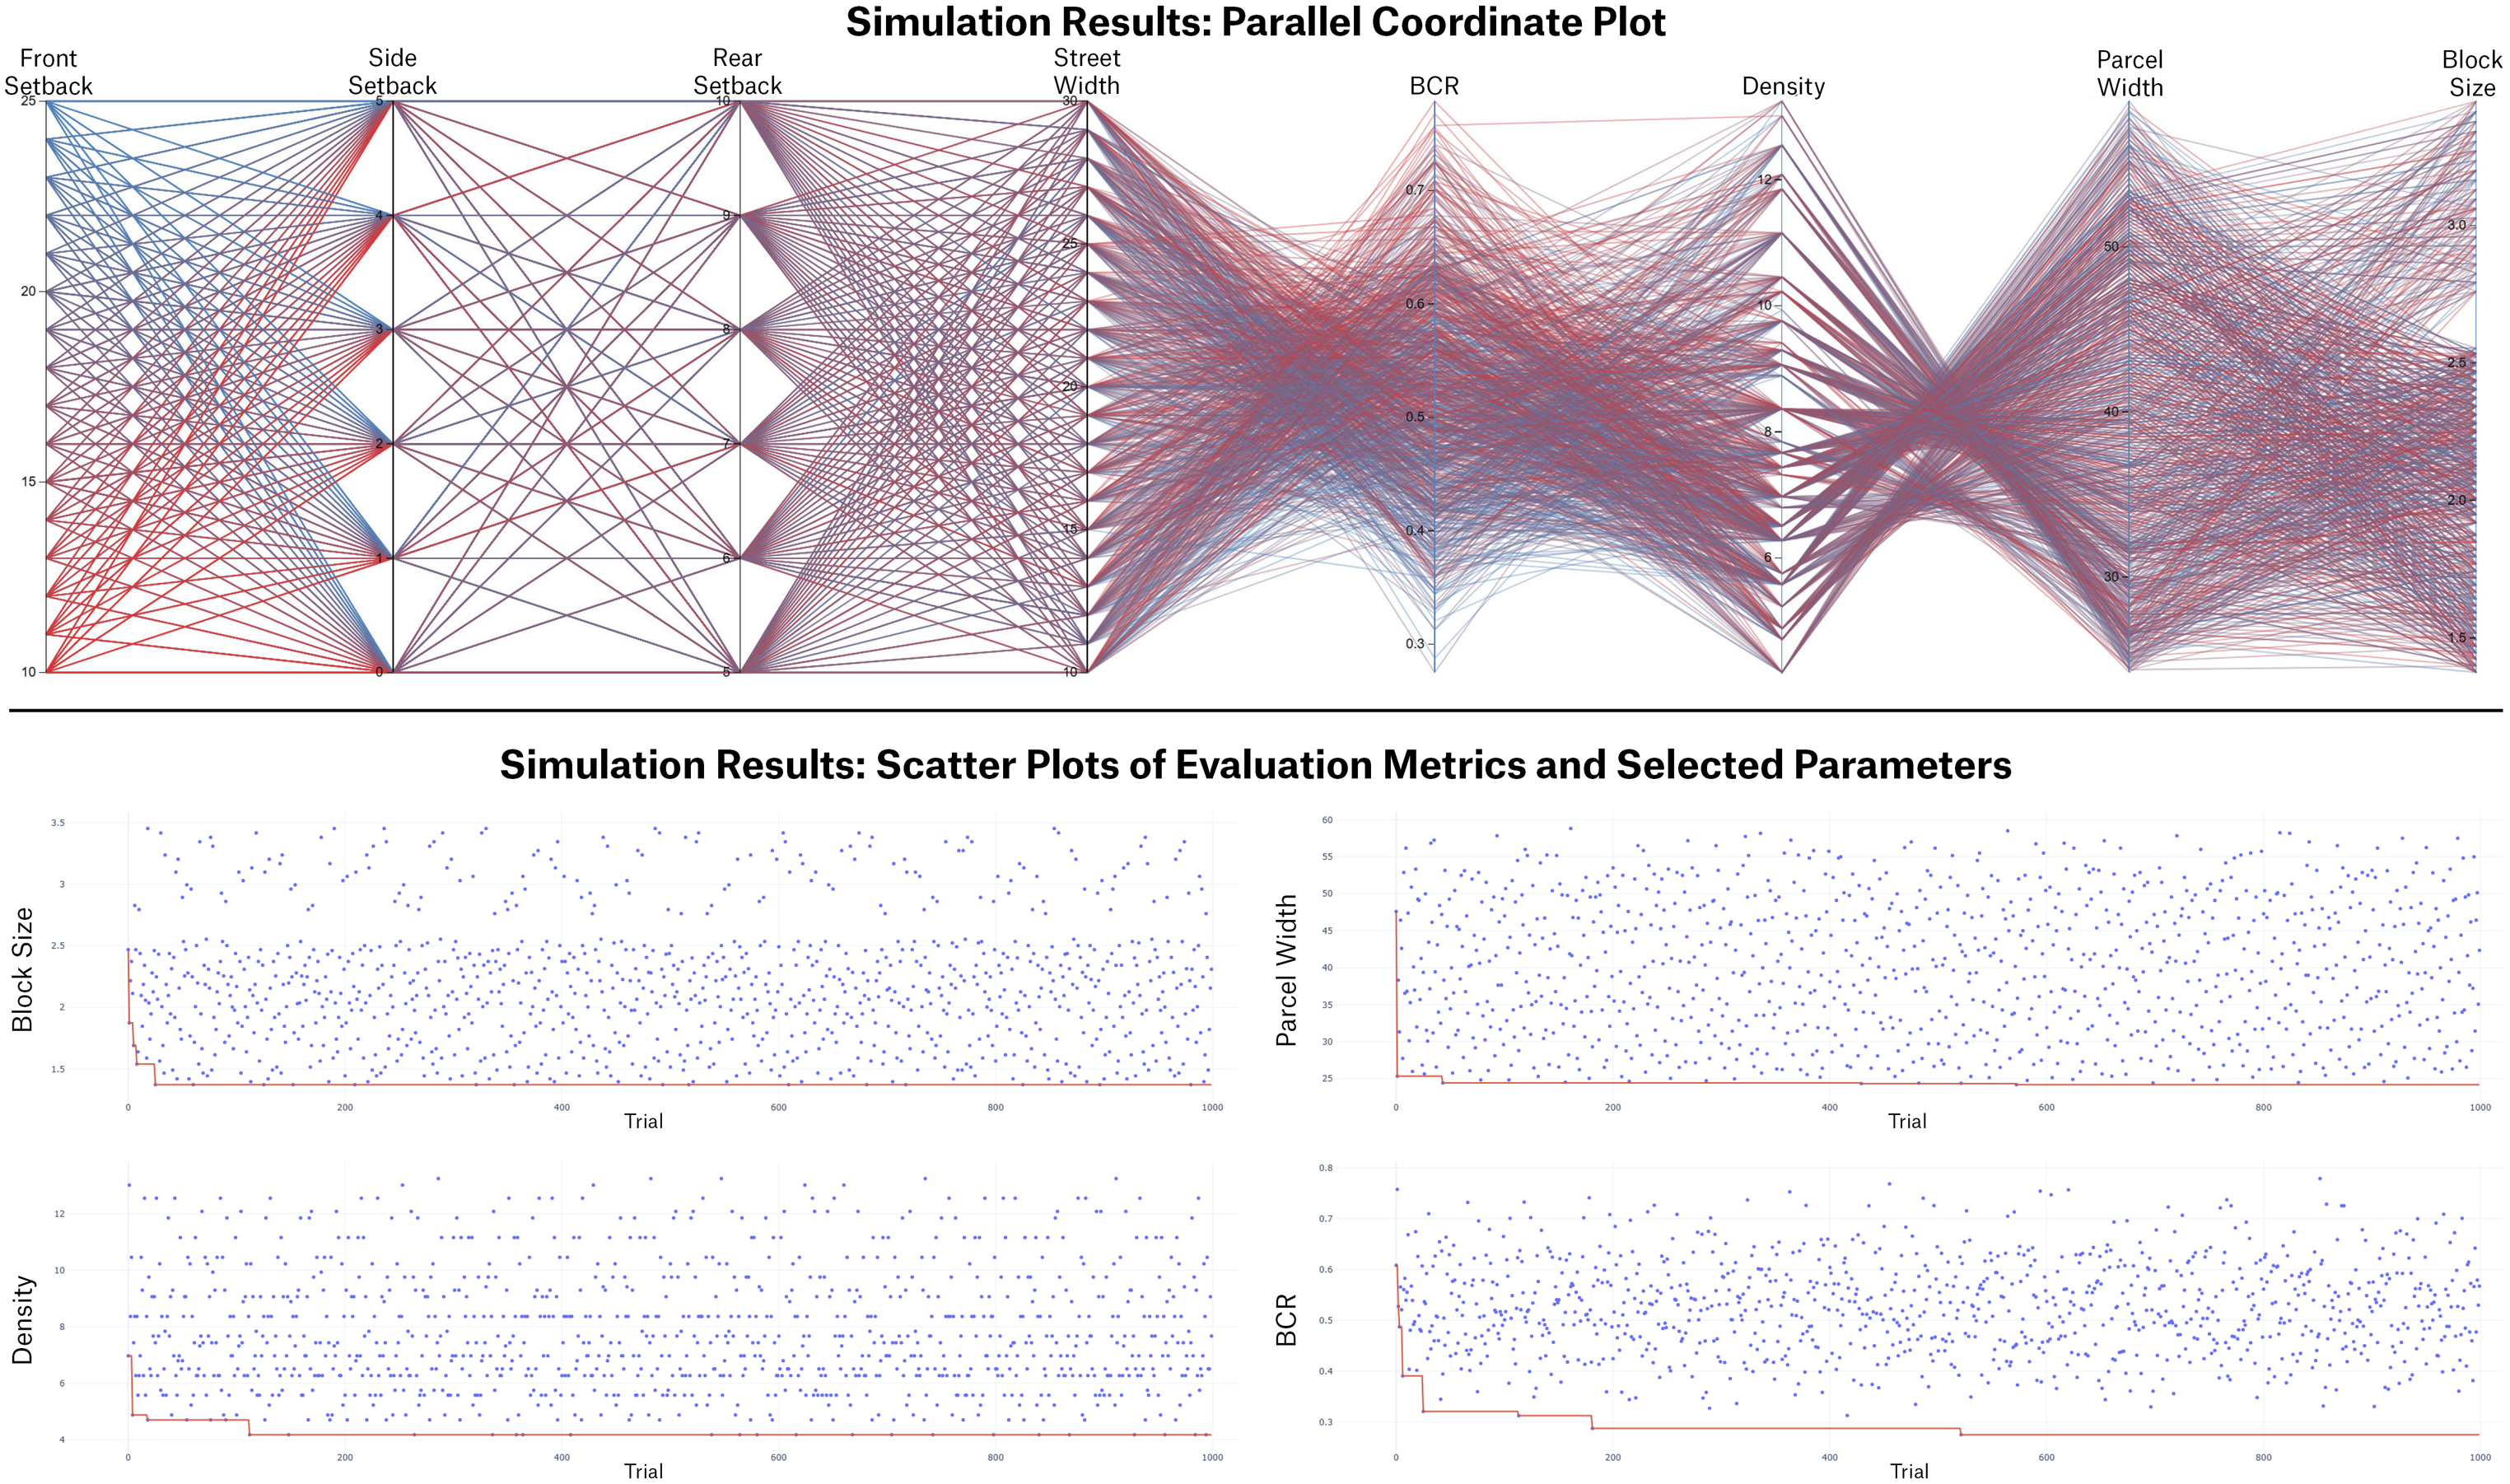
Univariable models
Univariable model results.

Corresponding significance levels (*p < 0.1; **p < 0.05; ***p < 0.01).
Block sizes and street widths
Block size and street width are derived from the initial step of dividing the site boundary into gridiron blocks. According to the p-values reported in Model (1), Model (6), Model (7), and Model (12), the null hypotheses of no association between block size or street width and the respective dependent variables were rejected in all cases. This indicates that both block size and street width have statistically significant relationships with BCR and housing density, respectively. In Model (1), the estimated slope coefficient of 0.086 (p < 0.001) indicates that for every one-acre increase in block size, BCR increases by an average of 0.086 units, while the estimated slope coefficient of −0.0042 (p < 0.001) in Model (6) indicates that for every one-foot increase in street width, BCR decreases by an average of 0.0042 units.
Model (7) yields a slope coefficient of −0.91 (p < 0.001), suggesting that each additional acre of block size is associated with an average decrease of 0.91 units in housing density. Model (12) yields a slope coefficient of −0.02 (p < 0.001), suggesting that each additional foot of street width is associated with an average decrease of 0.02 units in housing density. In summary, both block size and street width exhibit negative relationships with housing density, while block size shows an opposite (positive) relationship with BCR.
Parcel widths
After individual blocks are defined, parcel widths are used to subdivide each block into individual parcels. Based on the p-values reported in Model (2) and Model (8), the null hypothesis of no association between parcel width and the respective dependent variables was rejected in both cases, indicating that parcel width has a statistically significant relationship with both BCR and housing density. However, the relationships are in opposite directions. In Model (2), the estimated slope coefficient of 0.0020 (p < 0.001) indicates that for every one-foot increase in parcel width, BCR increases by an average of 0.0020 units. Model (8) yields a slope coefficient of −0.19 (p < 0.001), suggesting that each additional foot of parcel width is associated with an average 0.19 units decrease in subdivision housing density.
Setbacks
Front, side, and rear setbacks are applied to further divide each parcel into buildable and unbuildable areas. The p-values reported in Models (3), (4), and (5) indicate that the null hypotheses of no association between the three types of setbacks and BCR were rejected, suggesting a statistically significant relationship. In contrast, the p-values from Models (9), (10), and (11) are all larger than 0.5, indicating insufficient evidence to reject the null hypotheses, so we cannot conclude that there is a relationship between these setback dimensions and subdivision housing density.
Among models indicating statistical significance, Model (3) reports a slope coefficient of −0.0058 (p < 0.001) for front setbacks, meaning that for every one-foot increase in front setback, BCR decreases by an average of 0.0058 units. Model (4) reports a slope coefficient of −0.032 (p < 0.001) for side setbacks, meaning that for every one-foot increase in side setbacks, BCR decreases by 0.032 units on average. Model (5) reports a slope coefficient of −0.0061 (p < 0.001) for rear setback, meaning that for every one-foot increase in rear setback, BCR decreases by an average of 0.0061 units. In summary, all three types of setbacks exhibit a negative relationship with BCR, while there is insufficient evidence to suggest any significant relationship between setbacks and housing density.
Multivariable models
Linear models
Multivariable linear regression results.

Corresponding significance levels (*p < 0.1; **p < 0.05; ***p < 0.01).
Model (14) confirms that there is no statistically significant relationship between setbacks and housing density. The interaction term (Block Size × Street Width) is not statistically significant, indicating insufficient evidence to support the notion that the combined effect of larger blocks and wider streets influences subdivision housing density. An R-squared and an adjusted R-squared of 0.8 suggest that the model explains approximately 80% of the variance in housing density, indicating a strong overall fit.
By standardizing all parameters in the multivariable linear regression models, the effects of each zoning parameter on BCR and housing density become comparable. According to Model (13), side setback exerts the greatest influence on BCR, followed by street width and block size, while rear setback has the least impact. Among the three zoning parameters found to have a statistically significant effect on housing density in Model (14), parcel width exerts the greatest influence, followed by block size, with street width having the least impact.
Nonlinear models
XGBoost Shapley Additive exPlanations (SHAP) analysis.

aCorrelation _X_SHAP refers to the correlation between feature values (X) and their corresponding SHAP values.
For housing density, parcel width is the dominant factor by a clear margin, indicating that larger parcel widths consistently reduce housing density. Block size ranks second in importance and shows a negative SHAP correlation, meaning that larger block sizes tend to lower housing density, even though the average SHAP direction is near zero, suggesting potential nonlinearity. Street width has a smaller but still consistent negative effect. Front, rear, and side setbacks exhibit very small SHAP magnitudes and near-zero or slightly negative permutation importance scores, indicating no stable contribution once stronger features are accounted for.
Discussion
This section synthesizes insights into the relative effects of key zoning parameters across both linear and nonlinear models, contributes new quantitative evidence to the literature and data-driven zoning practice, and discusses the study’s key limitations.
Relative effects revealed through linear and nonlinear models
A strong convergence between the multivariable linear and nonlinear model results strengthens confidence in the robustness of the findings, suggesting that the identified parameter hierarchies are not model-dependent but structurally embedded in suburban subdivision design. Meanwhile, the nuanced distinctions between OLS- and ML-based interpretations clarify where linear specifications may mask more complex relationships.
For both BCR and housing density, the nonlinear models achieve higher predictive accuracy while largely confirming the parameter hierarchies observed in the linear regressions. Side setback remains the dominant driver of BCR, followed by street width and block size, whereas parcel width consistently exerts the strongest influence on housing density. This alignment suggests that the linear models capture the core structural relationships governing compact single-family subdivision outcomes, rather than artifacts of model specification.
When interpreted through the lens of the subdivision design and development process, linear models approximate the average regulatory trade-offs faced by planners and developers when adjusting zoning parameters, making them well suited for policy interpretation and comparative evaluation. However, the nonlinear models more closely reflect the iterative, constraint-driven nature of subdivision design, in which parameter effects are often conditional, threshold-based, and non-additive. The superior performance of nonlinear models, particularly for BCR, suggests that built-form outcomes emerge from compound interactions among zoning parameters rather than from independent parameter adjustments.
From subjectivity to quantification
The findings also contribute quantitative evidence to the ongoing discourse on zoning reform, lending empirical support to observations made in prior research and facilitating a shift in the evaluation of zoning approaches from subjectivity to quantification. For example, the analysis quantifies the observational statement from previous research like large setbacks pushing houses farther back and increasing spacing between them (Katz, 2004) by identifying statistically significant relationships between front, rear, and side setbacks and BCR. Moreover, understanding the relative effects of front, rear, and side setbacks on BCR allows subsequent zoning reform discussion to proceed in a more explicit and less generalized manner.
Meanwhile, the analysis also identifies instances where commonly held claims about specific zoning parameters may be misattributed. For example, setbacks prescribed under CZCs have long been criticized by New Urbanists for constraining housing density (Talen, 2013). However, the results show no statistically significant relationship between setbacks and housing density. In other words, although intuitive, mainstream critiques of setback requirements may be indirect and one-sided.
Additionally, the model results demonstrate that evaluating zoning parameters in isolation provides limited explanatory and predictive power for subdivision outcomes. A more fine-grained approach must account for compound interactions and trade-offs among multiple parameters, as several zoning controls exert opposing effects across different compactness indicators. For instance, block size and parcel width positively influence BCR while simultaneously reducing housing density, whereas other parameters interact in ways that partially offset their individual impacts, such as the interplay between block size and street width on BCR.
Supporting data-driven zoning decision-making
A systematic understanding of the relationships between zoning parameters and compact single-family subdivision outcomes as provided by this study, in return, can help subdivision practice avoid mismatches between zoning modifications and intended development goals. In many existing zoning ordinances, the regulatory emphasis placed on specific parameters is not well aligned with their actual influence on compact subdivision outcomes. As demonstrated by the results (Figure 4), parcel width exerts the strongest influence on housing density, whereas side setbacks account for the largest share of variation in BCR. Sankey diagram showing the relative contributions of individual zoning parameters to subdivision compactness indicators, based on multivariable linear regression results.
Yet normative standards governing both parameters are often arbitrary and insufficiently grounded in empirical evidence. For example, the widespread application of a uniform 5-foot side setback in detached single-family subdivisions lacks clear empirical justification, despite its measurable effects on BCR. From a practical standpoint, efforts to increase housing density should prioritize adjustments to parcel width, block size, and street width rather than setbacks. Conversely, when the objective is to influence BCR, modifying side setbacks and street width is substantially more effective than altering front or rear setbacks, given their comparatively greater marginal impacts.
More broadly, as local zoning ordinances increasingly move beyond a narrow set of measures that can be evaluated using dichotomous framework, defined by old (e.g., CZCs) versus new (e.g., FBCs), the findings of this research underscore the need for a data-informed approach that accounts for the interconnected effects of zoning parameters on compact development objectives, rather than relying on one-size-fits-all regulations. As demonstrated in this study, the QMCSS and the associated quantitative models not only enable systematic examination of relationships between individual zoning parameters and development outcomes, but also support proactive simulation and performance prediction of subdivision configurations under alternative zoning scenarios and objective metrics.
Study limitations
This study has several limitations that warrant future development. First, the QMCSS is tailored to homogeneous gridiron single-family subdivision forms, which limits its ability to generate blocks with heterogeneous lengths and widths or irregular geometries, such as those commonly found in parallel or lollipop subdivision patterns. Examining subdivisions with irregular parcel shapes or heterogeneous block/parcel widths and lengths would enhance the generalizability of the findings. However, developing a practical tool to emulate subdivision patterns with irregular parcel geometries or heterogeneous blocks remains a complex challenge beyond the scope of a single study.
Existing efforts have made partial progress but retain notable limitations. Wickramasuriya et al. (2011) introduced an automated subdivision tool that underperforms for irregular patterns, often generating excessively small triangular residual spaces along block edges. Habib (2020) proposed an algorithm to emulate irregular subdivisions, but its low spatial granularity and single-block focus limit its applicability to multi-block subdivision contexts. More recently, Sahebgharani and Wiśniewski (2024) developed algorithms for subdividing irregular blocks with varying lot areas. While their outputs more closely resemble real-world conditions, they still fall short of fully realistic subdivision patterns. More importantly, none of these approaches adequately address the challenge of consistently applying zoning controls, such as setbacks, across irregular and heterogeneous parcels. Therefore, future research is needed to extend the analytical framework of this study to irregular and heterogeneous subdivision patterns, thereby enhancing the generalizability and applicability of the findings.
That said, a recent study by Usui and Asami (2024) examines similar relationships using heterogeneous blocks in Tokyo and reports conclusions consistent with several of this study’s findings, including an inverse relationship between average plot frontage and gross building density, as well as the relative independence of average setback allowances from building density. These results suggest the potential applicability of this study’s findings beyond homogeneous gridiron subdivisions, while warranting further validation in U.S. contexts.
Another limitation lies in the inherently nonlinear nature of the subdivision design process. For example, although the analytical results may suggest that setbacks do not directly affect housing density, some decision-makers may proactively adjust block size or parcel width in anticipation of setback impacts, while others may not. Although the nonlinear models employed in this study aim to capture such upstream and latent decision-making processes, further research is needed to more directly address these complexities by incorporating interviews or surveys with practitioners.
Conclusions
This study examines the quantitative relationships between key zoning parameters and compact single-family subdivision outcomes, as well as the relative differences inherent in these relationships. It contributes new quantitative evidence to the literature on single-family zoning and its reform, while offering data-driven insights for policymakers, planners, developers, and urban designers seeking to promote more compact single-family residential development. The study also provides a practical analytical framework that can be extended in future research to examine subdivision practices involving heterogeneous and/or irregular block/parcel geometries, as well as development types beyond single-family housing.
Supplemental material
Supplemental Material - Shaping suburbia: Examining the quantitative relationship between zoning parameters, housing density, and building coverage ratios in American gridiron single-family subdivisions
Supplemental Material for Shaping suburbia: Examining the quantitative relationship between zoning parameters, housing density, and building coverage ratios in American gridiron single-family subdivisions by Chenhao Zhu Cong Cong and Yichao Shi in Environment and Planning B: Urban Analytics and City Science.
Footnotes
Acknowledgments
We sincerely appreciate the editors and reviewers for their invaluable feedback and support. We also gratefully acknowledge Eran Ben-Joseph for his insightful comments during the early development of this research. A special thanks is extended to Alan M. Berger, whose persistent inquiry into suburban development guided the early motivation of this research.
Author contributions
CRediT:
Funding
The authors received no financial support for the research, authorship, and/or publication of this article.
Declaration of conflicting interests
The authors declared no potential conflicts of interest with respect to the research, authorship, and/or publication of this article.
Data Availability Statement
The simulated subdivision sample data can be accessed through the following link. Other data will be made available on request: Chenhao Zhu (2025).  .
.
Disclosure
This manuscript has not been published or presented elsewhere in part or entirety and is not under consideration by another journal.
Declaration of generative AI and AI-assisted technologies in the writing process
During the preparation of this manuscript, the authors used ChatGPT-4o in order to check the spelling and grammar. After using this tool, the authors reviewed and edited the content as needed and take full responsibility for the content of the publication.
Supplemental material
Supplemental material for this article is available online.
Author biographies
References
Supplementary Material
Please find the following supplemental material available below.
For Open Access articles published under a Creative Commons License, all supplemental material carries the same license as the article it is associated with.
For non-Open Access articles published, all supplemental material carries a non-exclusive license, and permission requests for re-use of supplemental material or any part of supplemental material shall be sent directly to the copyright owner as specified in the copyright notice associated with the article.
