
Abstract
Connected vehicle (CV) data are increasingly available and widely used in transportation engineering for traffic monitoring, safety analysis, and infrastructure planning. However, the representativeness of CV data in general urban mobility analysis remains underexplored, raising concerns about potential biases between observed mobility patterns in CV data and actual travel behaviors, particularly across different demographic and socioeconomic groups. This study compares Wejo connected vehicle (CV) data with SafeGraph mobile phone records covering boarder population to reveal the representativeness of connected vehicle data in the context of urban mobility analysis. Using entropy-based measures of destination income diversity and normalized inter-neighborhood interaction strength, we examine how each dataset reflects mobility structures across income groups in San Antonio, Texas. Results show that SafeGraph data capture more multimodal and socially integrative travel behaviors, particularly among low-income communities, while Wejo data primarily reflect routine, vehicle-based movements concentrated among higher-income users. Interaction patterns in the CV data are more spatially clustered, with stronger flows observed within affluent neighborhoods. These differences underscore the behavioral and demographic selectivity embedded in CV data and point to important limitations when using such data to analyze mobility-based segregation. The findings contribute to ongoing efforts to evaluate the representativeness of emerging mobility datasets and their implications for urban spatial analysis.
Introduction
In recent years, with the advancement of Internet of Things technology, connected vehicles (CVs) have been widely accepted by many households (Schoettle and Sivak, 2014; Shin et al., 2015). Equipped with built-in telematic systems, connected vehicles can transmit and receive real-time data about their location, performance, and surroundings, which enhances driver safety and mobility efficiency on roadways (Olia et al., 2016). More and more drivers are choosing connected cars as their daily mobility tools to reduce the risk of accidents and increase driving experience (Bourne, 2024). As the massive amount of connected vehicle data being collected, it has opened new possibilities for understanding travel behavior and mobility patterns in urban transportation system. Based on the high-frequency recordings of vehicle trajectories and precise GPS-based tracking, CV datasets provide valuable insights into driving behavior analysis, driving safety estimation, and optimizing traffic signal timing (Ali et al., 2020; Goodall et al., 2013). In addition, CV datasets also offer the potential to support broader investigations into urban mobility, such as identifying travel demand patterns, evaluating accessibility, and measuring spatial connectivity among neighborhoods (Lin et al., 2019). As CVs become increasingly integrated into everyday transportation, the data they generate provide a novel lens through which to observe and analyze how people utilize urban space.
Although CVs have provided a source of high temporal and spatial resolution data for many studies, the question of the representativeness of CV data in overall urban mobility remains uncertain. Connected vehicles are typically owned by individuals with newer and more expensive vehicles, which could be concentrated in higher-income neighborhoods or some low and moderate income families who can afford it (Shin et al., 2015). Factors such as vehicle cost, insurance, and household income lead to an uneven distribution of CV users across the population. Thus, the observed CV data may capture only a subset of urban travel behaviors, particularly individuals associated with private automobile ownership. This limitation raises important questions about the extent to which mobility patterns derived from CV data can reflect the travel characteristics of the overall urban population.
Since the trip records documented by CV data tend to come from individuals with specific socioeconomic backgrounds, the captured mobility patterns may reflect the behavior of a selective segment of the urban population. Although this introduces limitations for generalizing to the broader public, it also offers a valuable opportunity to investigate the travel behaviors of this distinct subgroup. By systematically comparing CV-based mobility patterns with those derived from more inclusive data sources, such as mobile phone records, it becomes possible to identify behavioral differences, assess the spatial and social limitations of CV users’ movements, and explore whether they exhibit unique or structurally constrained mobility patterns within the urban context. Furthermore, this also creates an opportunity to further examine the mobility segregation and spatial interaction preferences among the CV user group. By measuring the diversity of their travel destinations and the intensity of inter-neighborhood interactions, it is possible to assess whether CV users tend to move within socioeconomically homogeneous environments or maintain diverse mobility connections. Integrating with neighborhood-level socioeconomic and built environment attributes, it allows us to identify the factors that may enhance or limit the spatial connectivity and social exposure of CV users. Such analysis not only contributes to a deeper understanding of the behavioral boundaries of connected vehicle users in urban space but also provides an empirical foundation for evaluating the applicability of CV data in transportation equity studies, mobility pattern analysis, and smart mobility planning.
This study aims to address the representativeness of connected vehicle data in the context of urban mobility analysis through the lens of destination-based diversity and spatial interaction. In this study, mobility refers to the aggregated intra-urban movements of residents, encompassing all trip purposes and times of day. Rather than focusing solely on daily commuting or specific trip types, we interpret mobility as a comprehensive reflection of how people traverse the city in their everyday lives. This broad definition allows both connected-vehicle and mobile-phone datasets to be analyzed under a consistent conceptual framework that emphasizes spatial representativeness over temporal or purpose-specific variations.
Through comparison with a more inclusive dataset of mobile phone-based location records, this study reveals the specific interaction patterns of the connected vehicle user group and the socioeconomic factors that drive the group’s interactions. Specifically, we examine connected vehicle data provided by Wejo and mobile phone data collected from SafeGraph in the city of San Antonio, Texas. We adopt the diversity of destinations by income group, measured by the Shannon entropy, and the normalized interaction strength between origin-destination pairs at the Census Block Group (CBG) level. These metrics are used to assess the extent to which connected vehicle users interact across socioeconomic boundaries or remain spatially and socially constrained in their travel behavior. Statistical models are employed to investigate the explanatory of neighborhood-level socioeconomic attributes and build environmental characteristics in shaping these patterns, allowing for direct comparison across data sources. This study provides empirical insights into the selective visibility embedded in connected vehicle datasets and highlights the implications of such bias for the interpretation of urban mobility structures.
Literature review
Urban mobility research has increasingly turned to mobile phone records (e.g., SafeGraph) to investigate travel flows and social interaction across cities. Although sampling bias in mobile phone data may result in activity characteristics not being extracted for certain segments of the urban population, their broad coverage and multimodal representation make them valuable for analyzing urban mobility patterns (Z. Li et al., 2024). Numerous studies have used origin-destination matrix derived from mobile phone data to reveal commuting patterns, accessibility, and population exposure to different social and demographic environments (Hu et al., 2021; Jiang et al., 2025; Sparks et al., 2022; Toole et al., 2012; Yabe et al., 2023). In particular, a growing number of studies have introduced entropy-based metrics to estimate destination diversity, quantifying the degree to which residents from a given neighborhood travel to areas with varying socioeconomic conditions (Abbasi et al., 2021; Huang et al., 2022; Iyer et al., 2024; Marin et al., 2022). For instance, scholars analyzed mobility data from multiple U.S. cities and shown that people from neighborhoods with higher median income, higher education level and less Black residents are more likely to have a higher place exploration and more diverse destination preference (Moro et al., 2021). Some studies also have investigated interaction strength, the intensity of mobility flows between neighborhoods, to understand spatial connectivity, potential social integration and the effects of travel distance on interaction strength (Xu et al., 2022). These metrics are effective to reveal structural social integration or segregation embedded in urban mobility and have been widely used in studies addressing mobility inequality across demographic groups. Overall, mobile phone data offer a relatively comprehensive description of urban travel behavior and spatial interaction, serving as an important benchmark for evaluating the representativeness of other mobility datasets (e.g., connected vehicle data), particularly in terms of sampling bias and behavioral selectivity (Jiang et al., 2025).
Connected vehicle data have drawn increasing attention in recent years as a valuable source for analyzing vehicle driving behavior, traffic performance with optimization, and traffic safety-related events. Generated by telematic-equipped vehicles, CV data captures high-frequency and GPS-accurate vehicular trajectories in real-world driving conditions, which provide good opportunities for applications such as real-time traffic monitoring, traffic signal optimization, emissions estimation, and crash or near-crash risk forecasting (Ali et al., 2020; Goodall et al., 2013; Li et al., 2024a; Sultana and Hassan, 2025; Xie et al., 2019). For example, connected vehicles, like a moving sensor for traffic speed, can detect the traffic speed on road segments in real time, which facilities dynamic traffic management and further improves the traffic efficiency in cities (Gao et al., 2019; Khan et al., 2017). Many studies also leverage detailed heading and speed information of connected vehicle movement to detect the near-crash events on roads, providing insights into driving behavior and road safety conditions that may not be captured through conventional crash reports (Islam and Abdel-Aty, 2023; Zhang and Abdel-Aty, 2022). However, the use of CV data in broader urban mobility research remains relatively limited, especially in relation to human travel behavior and socio-spatial interaction patterns.
Given its spatiotemporal granularity and large-scale availability, CV data offer significant potential for advancing urban mobility research. Based on the expectations of connected vehicle markets in the US, the connected vehicle user group will surpass 180 million by 2028, accounting for 70.9% of all licensed drivers across the country (Bourne, 2024). As adoption increases, the continuous and precise tracking of vehicles enables detailed reconstruction of origin–destination (OD) flows, providing an opportunity to investigate how mobility is structured across neighborhoods and social groups. Compared to traditional travel surveys, CV data can provide more temporally dense and route-specific information. However, despite these advantages, questions remain regarding the types of travelers CV data represent and how they compare with the general population in terms of socioeconomic characteristics and behavioral diversity.
Understanding the representativeness of CV data is particularly important when such data are used to estimate social segregation, accessibility, or policy impacts. Without a clear assessment of who is visible in CV datasets and how their mobility behaviors differ from the general population, there is a risk of drawing incomplete or skewed conclusions about mobility structures. This study contributes to addressing this gap by directly comparing mobility measures derived from CV and mobile phone data. In doing so, it highlights the demographic and behavioral specificity of CV users and evaluates the implications for using connected vehicle data in broader urban mobility research.
Study area, mobility datasets, and methodology
Study area
This study focuses on the city of San Antonio, the second-largest city in Texas and one of the fastest-growing urban regions in the United States. According to the 2020 U.S. Census, San Antonio’s population exceeded 1.4 million, of which more than 64% are Hispanic (Bureau, 2023b). The city exhibits a strong reliance on automobile travel, with over 70.5% of commuters using private vehicles and driving alone as their primary mode of transportation (Bureau, 2023a). Meanwhile, as one of the pilot cities for smart transportation, transportation department of San Antonio has been expanding the application of telematics technology in urban transportation system, attracting a large number of connected vehicle users (Antonio, 2019). Thus, the city of San Antonio is an ideal study area to address the representativeness of connected vehicle data in urban mobility analysis.
In this study, we concentrate on analyzing neighborhood-level interaction characteristics. Thus, we adopt the census block group (CBG) as the spatial analysis unit for aggregating mobility data, which is commonly used in mobility pattern analysis (Z. Li et al., 2024; Yang et al., 2023; Zhang et al., 2023). The CBG level provides a consistent spatial framework that allows integration of mobility records with census-based socioeconomic variables, such as median income, educational attainment, and demographic information. These variables represent the specific social and economic characteristics that could influence mobility diversity and interaction intensity, which will be used as explanatory factors in this study. Among the 1,047 CBGs, this study focuses on 940 CBGs that have valid observations in both the SafeGraph and Wejo datasets. In order to investigate the interaction patterns between neighborhoods with different income levels, we categorize CBGs into low, middle, and high income communities. Given the categorization of income levels is commonly used in existing studies (Clark and Fossett, 2008; Spiegel et al., 2025; Yip et al., 2016), we use 30% ($51,376.60) and 60% ($78,019.60) annual median household income as thresholds to classify the CBGs into three income levels. Specifically, CBGs with annual median household income below $51,376.60 are considered as low-income communities, the CBGs with median income higher than $78,019.60 are classified as high-income communities, and remaining CBGs are middle-income communities. As shown in Figure 1, the majority of high-income neighborhoods are primarily located in the northern suburb areas of the city, while low-income communities are mainly aggregated in the downtown and southern areas. This spatial differentiation offers a useful foundation for assessing the extent to which mobility diversity and interaction strength vary across income groups and urban contexts. Income-level categorization of census block groups in San Antonio.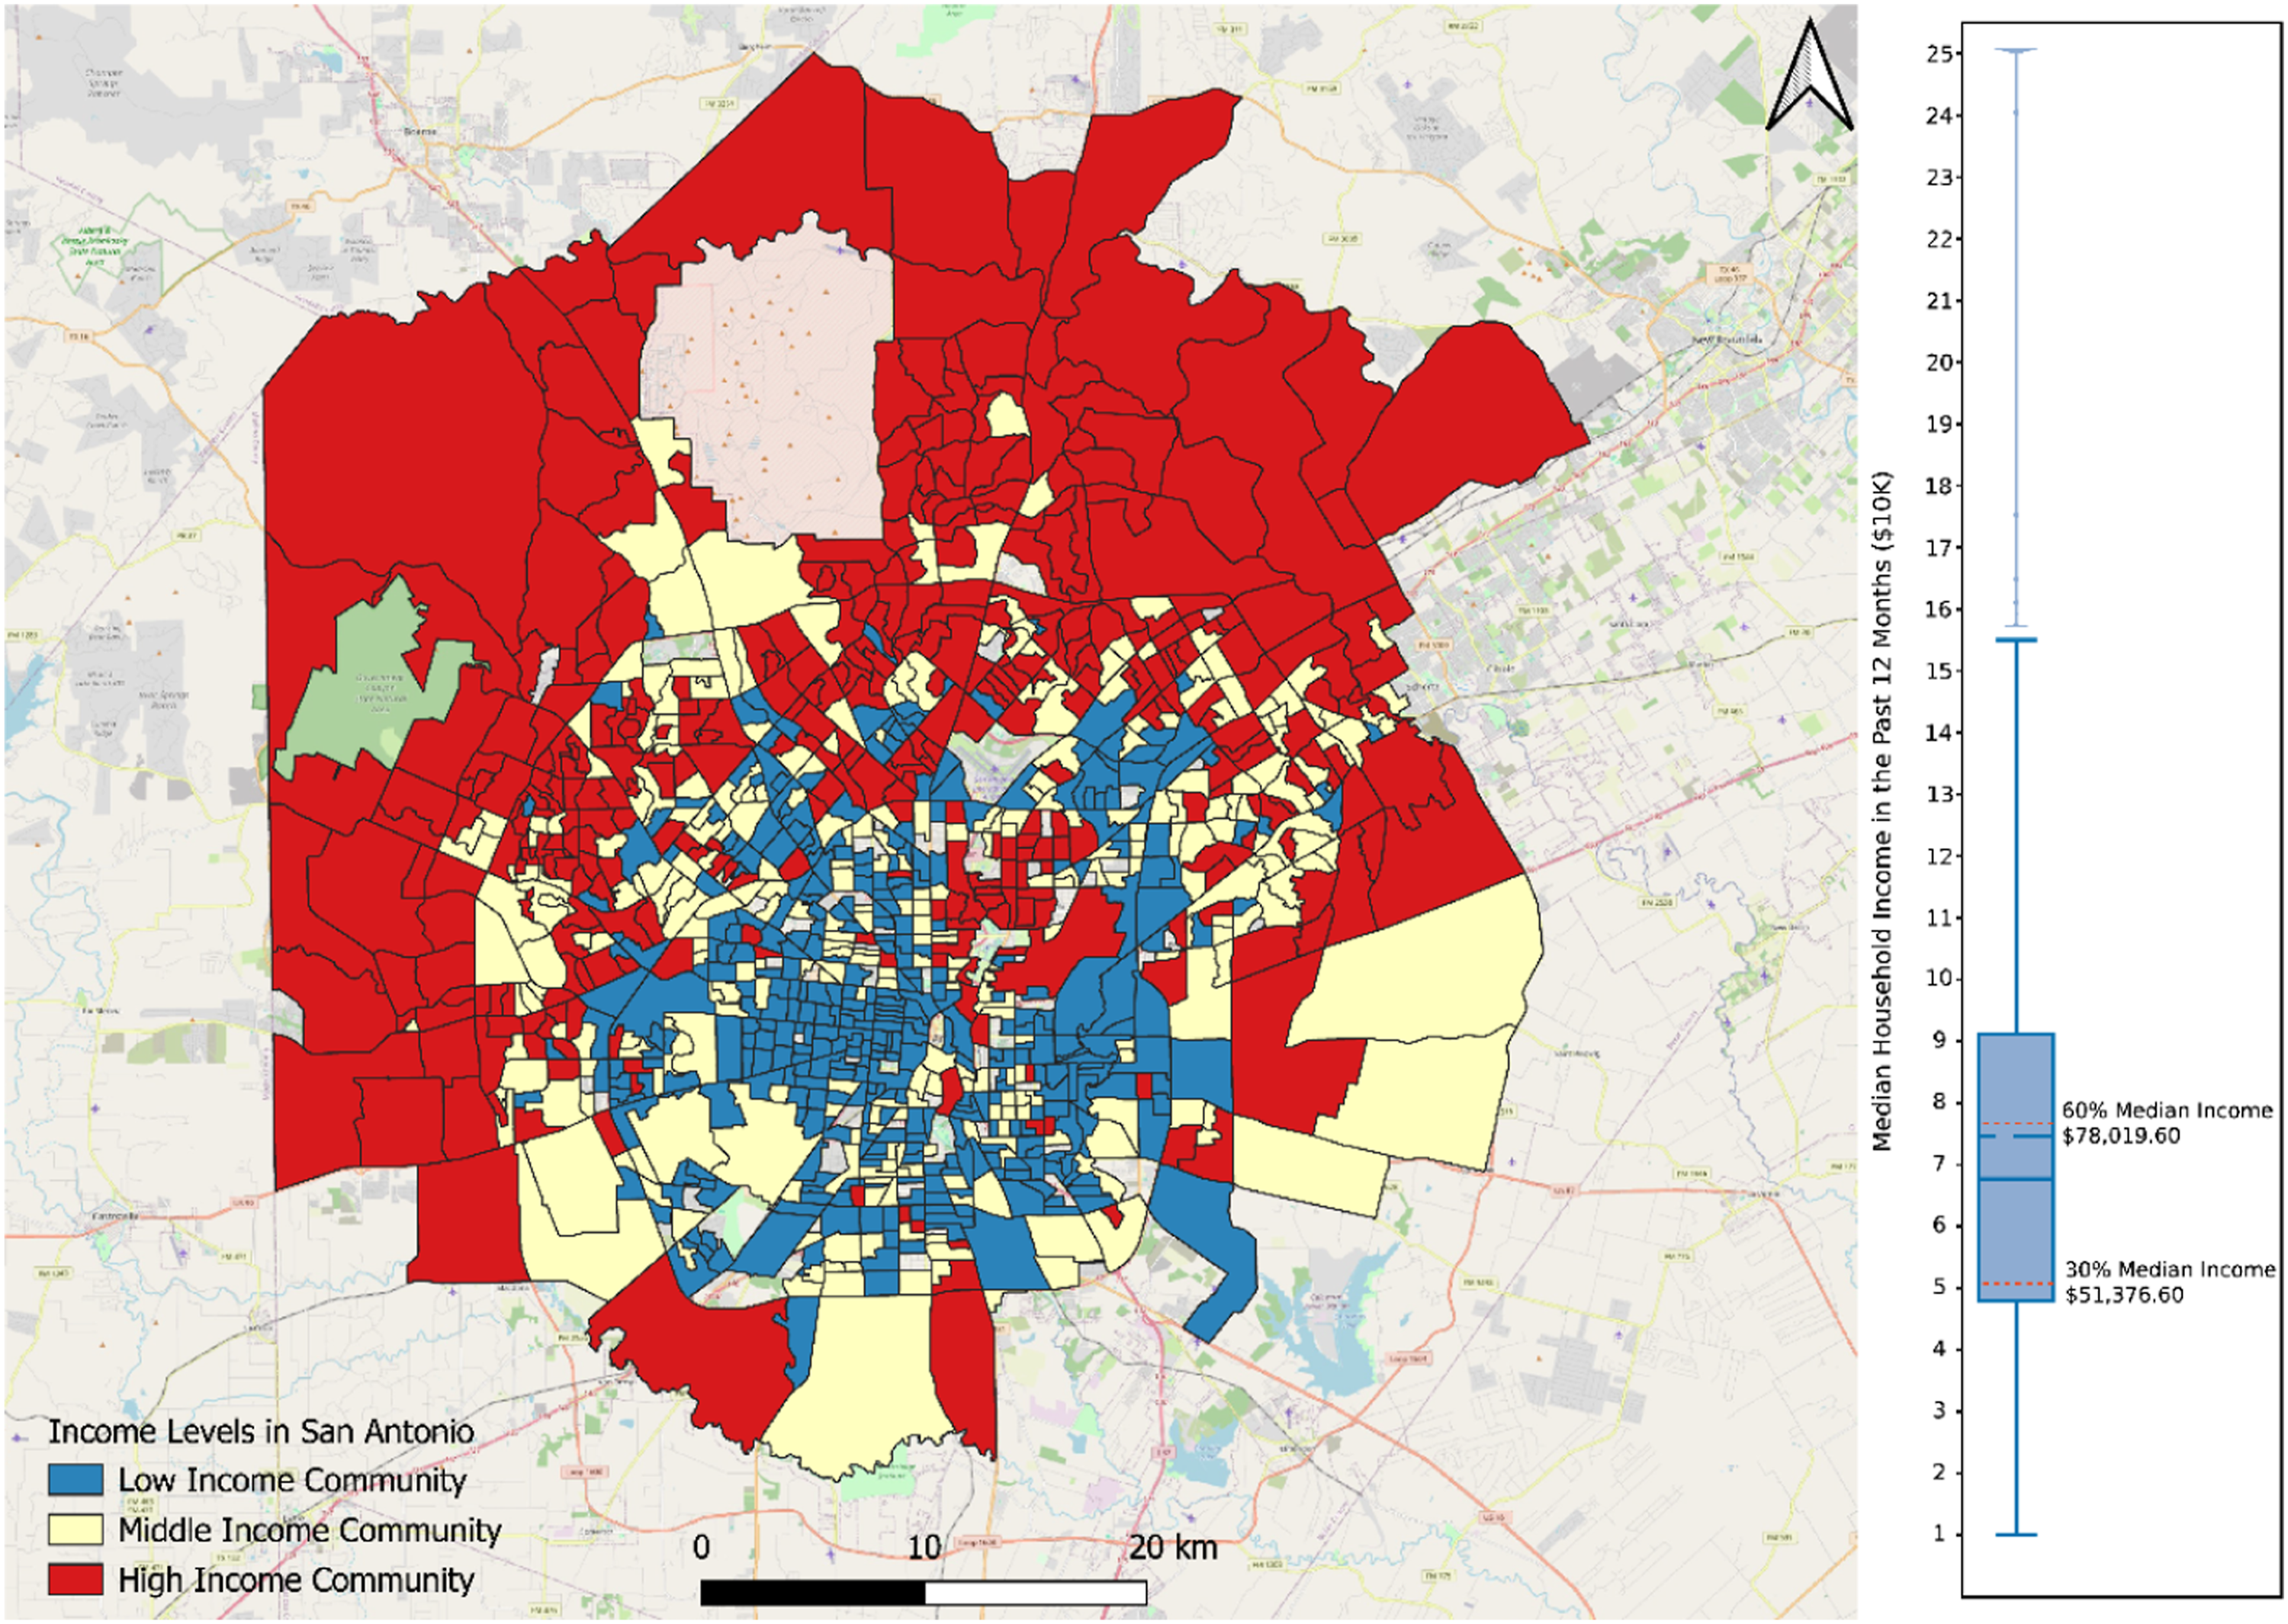
Mobility datasets: SafeGraph and Wejo connected vehicle datasets
To provide a broader context for understanding travel behavior, this study adopts the SafeGraph (SG) dataset as a background. Unlike connected vehicle data, SG offers insights into population movement across all transportation modes, allowing us to better reveal the specific preferences or bias of connected vehicle users’ travel patterns. We collected SG data in San Antonio from November 1, 2021, to January 3, 2022, and over 6 million records are observed. Based on the raw SG records, we aggregate the phone users’ home places and their visited Point of Interests (POIs) at the census block group level to build an original-destination (OD) matrix. This OD matrix will be used to represent the overall population’s movement in San Antonio and server as a baseline for comparison with connected vehicle user group.
Compared with general-sourced mobile phone data, we use anonymized connected vehicle (CV) trajectory data collected by Wejo Group Ltd. The Wejo dataset mainly captures privately owned connected passenger vehicles equipped with in-vehicle telematics systems. It does not include on-demand or fleet-based connected vehicles, such as ride-hailing, taxi, or delivery services. Therefore, the connected vehicle data in this study reflect the travel behavior of private vehicle users, which serves as a consistent basis for comparison with the population-level mobility patterns derived from SG data. The Wejo dataset contains high-resolution trajectory records collected via telematics devices, providing detailed spatial-temporal information. It covers the same period as the SG dataset (November 1, 2021, to January 3, 2022) and includes over 14 million raw trajectories. To ensure the analysis focuses on intra-urban mobility of San Antonio residents, we retain only trajectories that start from residential areas and end within the study boundary, resulting in approximately 5.6 million trips. We use USA Structures datasets, released by Federal Emergency Management Agency (FEMA), to map the starting locations of Wejo trajectories, determining the selected trajectories are starting from residential places.
While the two datasets differ in population coverage and sensing mechanisms, a consistent spatial boundary is critical for meaningful comparison in the following analysis. In this study, the focus is placed on intra-urban mobility behaviors of residents in San Antonio, rather than regional commuting across the metropolitan area. Therefore, both SG and Wejo trips are filtered to include only movements that originate from residential areas and terminate within the study area boundary. This design excludes the mobility patterns of external commuters or pass-through travelers whose trips could otherwise overestimate cross-income interaction strength or distort entropy-based diversity measures. With this consistent boundary setting, both datasets represent comparable resident-based travel patterns within the city. In addition to spatial consistency, both datasets are temporally aggregated over the same study period, which covers regular weekdays, weekends, and several public holidays. This aggregation provides a stable representation of urban mobility by smoothing short-term variations and highlighting the broader spatial patterns of residents’ travel behaviors. Accordingly, the datasets include trips for all purposes and times of day, instead of distinguishing specific daily or commuting patterns, in order to capture the overall structure of residents’ intra-urban movements.
It is possible that a small portion of users appear in both datasets, for example, some connected vehicle drivers may also carry mobile phones captured by SG. However, this potential overlap does not significantly affect the results of this study. SG data are used as a background reference to represent overall population mobility across all travel modes, while Wejo data describe the mobility of private connected vehicle users. The comparison between the two datasets is designed to reveal how connected vehicle data represent only a subset of the broader human mobility captured by mobile phone data, rather than to test their independence. Both datasets are aggregated and anonymized at the census block group level, some individual-level overlap could have a minor effect on the spatial patterns and statistical relationships discussed in this paper.
Methods
Destination diversity of income level
Based on the three income level categories, we calculate an entropy for each origin block group to measure the destination diversity of income levels. We adopt Shannon Entropy to represent the destination diversity, which is widely used in many studies (Marin et al., 2022; Zachary and Dobson, 2021). The entropy is computed as:
Higher entropy values suggest that trips from a block group are distributed evenly across low-, middle-, and high-income areas, reflecting diverse mobility patterns and greater socioeconomic exposure. Lower entropy values indicate that trips are concentrated within specific income categories, potentially showing limited mobility diversity or income-based segregation in travel behavior. This metric is calculated separately for both the Wejo connected vehicle data and SG mobile phone data, allowing us to compare how observed population from different data sources interact with income-diverse areas.
Normalized interaction strength
In addition to analyzing destination diversity, we quantify the strength of mobility interactions between different census block groups through a normalized interaction strength metric (Xu et al., 2022). This measure captures the relative strength of connections between origin-destination pairs, while accounting for differences in the total travel volume of each block group.
Given any two block groups
This normalization controls the activity level differences between block groups, allowing us to compare the relative strength of interactions across block pairs on an equal footing. By focusing on normalized values, we can better isolate the effects of socioeconomic and spatial attributes on mobility connectivity, independent of overall travel volume. By analyzing the interaction strength between block groups, we investigate how socioeconomic differences, geographic distance, and built environment characteristics shape the intensity of mobility flows.
Regression models
We employ two independent models to identify how the local socioeconomic, demographic and built environmental factors relate to mobility diversity and interaction intensity. For each model, we run separate regressions on the SafeGraph and on the Wejo datasets, using the same CBG-level explanatory variables. This design enables a direct comparison of the coefficient directions and significance across the two datasets, revealing whether connected vehicle data capture similar spatial relationships as population-wide mobility. The diversity model examples how neighborhood characteristics explain variations in the income heterogeneity of travel destinations, whereas the interaction model focuses on how the difference of these factors influences the strength of inter-CBG connections.
The first model focuses on mobility diversity, represented by the income-based entropy of travel destinations at each original CBG. This model is designed to capture how neighborhood socioeconomic and built-environment characteristics shape the heterogeneity of residents’ travel destinations, serving as an indicator of the spatial mixing across income groups. We regress this entropy value on a set of socioeconomic, demographic, and built environmental characteristics, specified as:
The second model examines the determinants of mobility interaction strength between pairs of block groups. For each origin-destination pair, the normalized interaction strength is regressed on differences in socioeconomic and built environment attributes, as well as geographic distance, formulated as:

Both regression models use continuous dependent variables that summarize relative variations in mobility behavior rather than raw trip frequencies. The income entropy index captures the diversity of income groups among destinations and ranges from 0 to ln(K), while the interaction strength index measures the normalized connection intensity between CBG pairs on a 0–1 scale. Because these indicators are derived from proportional and aggregated measures, the relationships between them and neighborhood characteristics are estimated through a linear regression framework. This approach allows the coefficients to be interpreted as changes in mobility diversity or interaction intensity associated with socioeconomic and built environmental factors across neighborhoods.
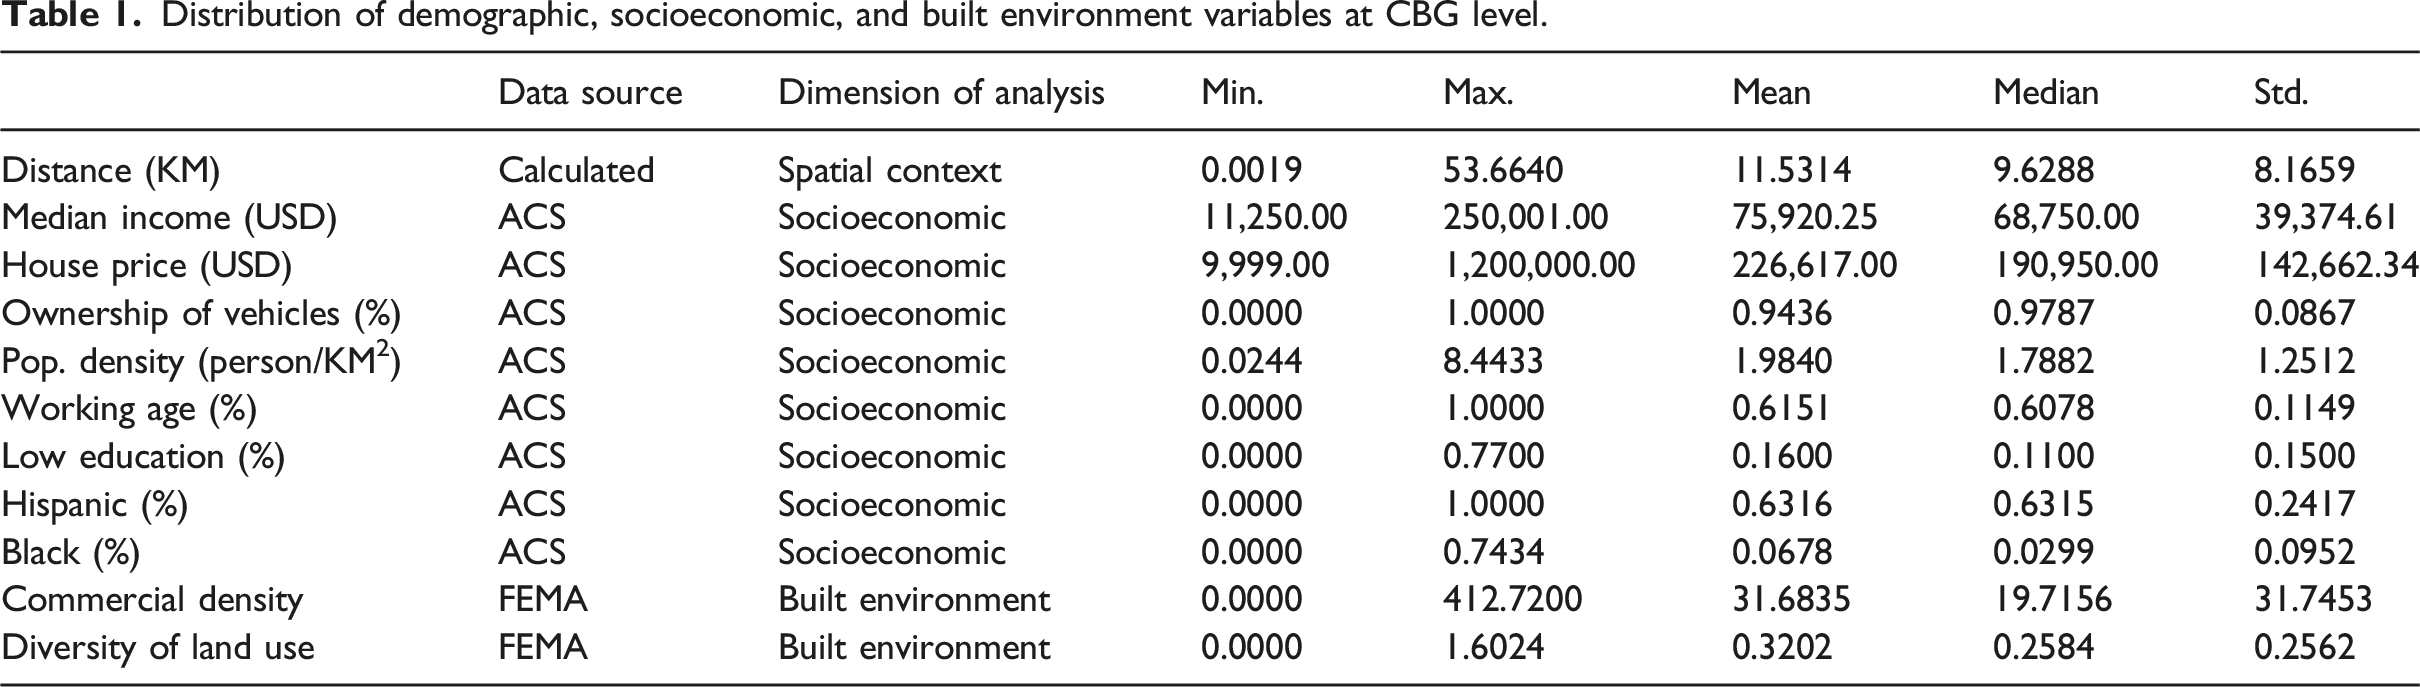
Distribution of demographic, socioeconomic, and built environment variables at CBG level.
Results
Descriptive analysis
The first step in our analysis is to examine whether the two mobility datasets capture comparable patterns of urban travel behavior. Understanding how significant these datasets align is important not only to validate subsequent comparative analyses but also to highlight potential differences in their representativeness. To ensure a consistent basis for comparison, the correlation analysis between SG and Wejo OD flows is calculated using only the overlapping origin–destination (OD) pairs that appear in both datasets. OD pairs observed in only one dataset are excluded from the computation to avoid bias caused by differences in spatial coverage or sampling density. This intersection-based approach allows the comparison to focus on mobility structures in both datasets rather than areas where one dataset lacks observations. Figure 2 illustrates the correlation of the number of interactions between SG and Wejo datasets at the CBG level. Figure 2(a) presents the overall correlation between OD pair interactions captured by Wejo and SG. The analysis reveals a strong positive correlation (R2 is 0.7569), indicating that the general structure of mobility flows is consistent between the two datasets. This result suggests that the overall number of interactions between neighborhoods captured by connected vehicle data is similar with that observed by mobile phone data. However, when focusing on the number of interactions between different income levels, significant variation is observed in the correlation between the two datasets. Correlation of trip counts between SG and Wejo datasets.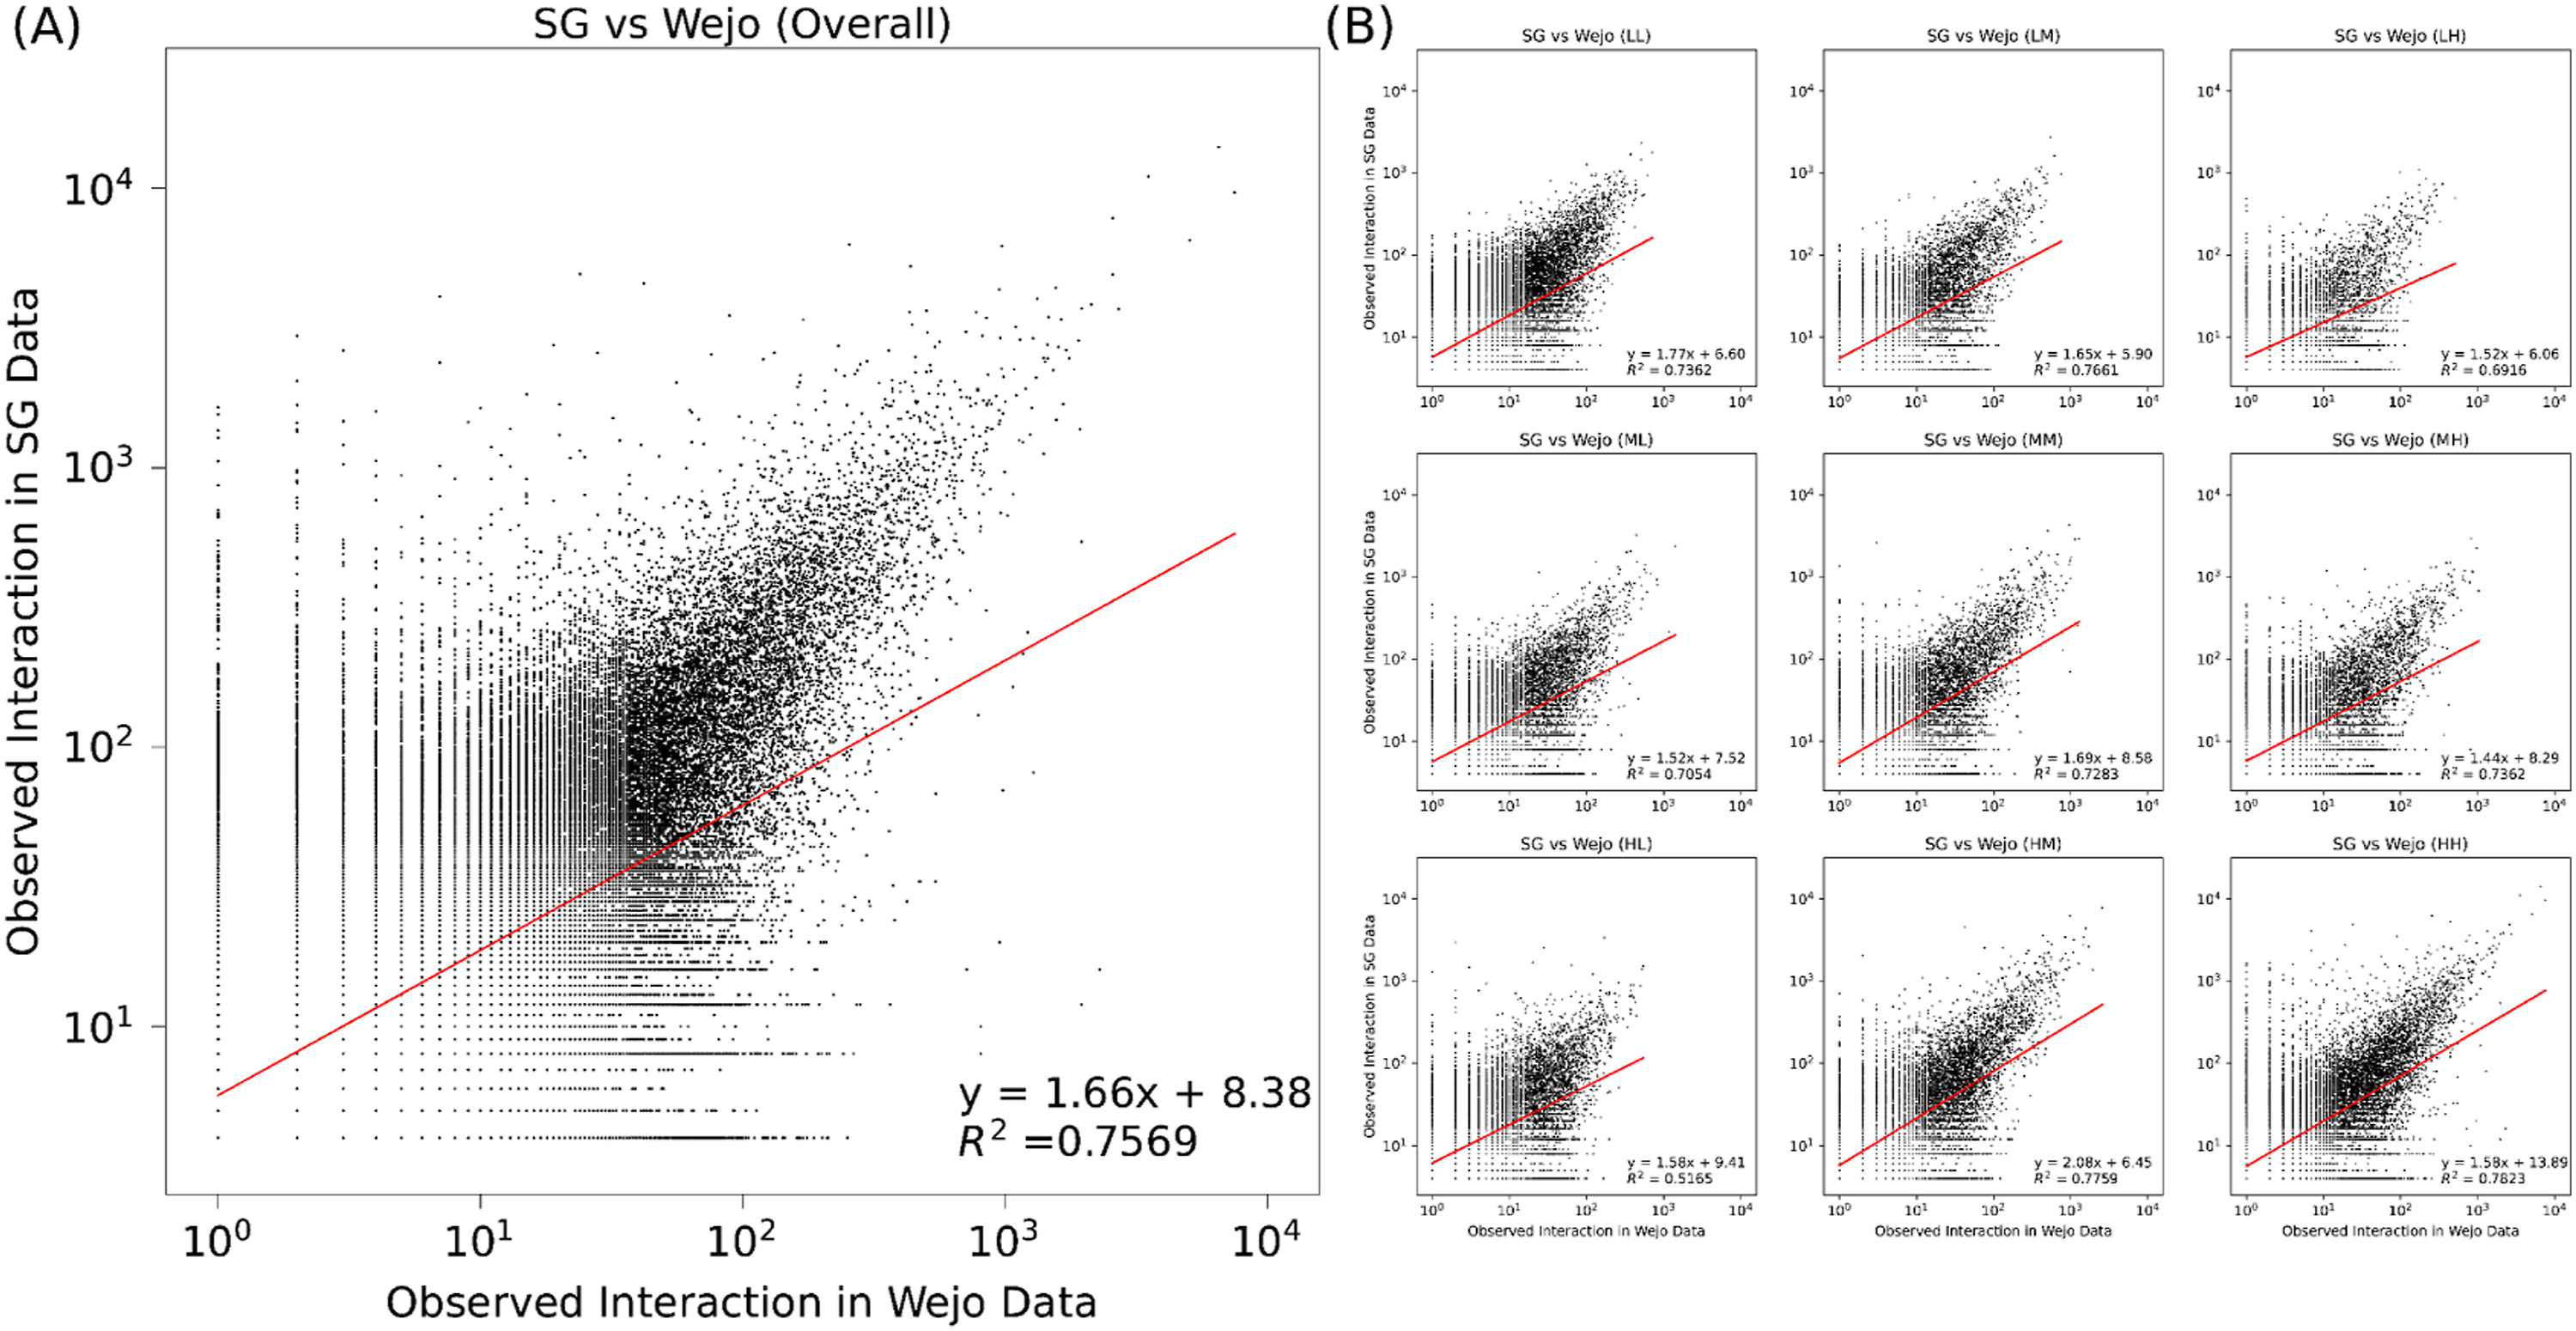
The nine figures of Figure 2(b) illustrate correlations for each income group pair. Generally, the correlation coefficients remain robust, with R2 ranging from approximately 0.52 to 0.78. Notably, the highest alignment appears in interactions involving high-income block groups, such as the high-income to high-income (R2 = 0.7823) and high-income to middle-income (R2 = 0.7759) flows. This suggests that mobility patterns in higher-income areas are particularly well-represented in the connected vehicle dataset. One possible explanation is that high-income residents are more likely to own private vehicles and actively use connected vehicle technologies, contributing to a stronger correlation. While lower correlation values are observed for interactions involving low-income block groups. For instance, high-income to low-income pairs (R2 = 0.5165) and low-income to high-income pairs (R2 = 0.6916). The possible reason is that low-income residents are less likely to own newer private vehicles with telematic technologies, leading to their underrepresentation in the connected vehicle dataset. Additionally, low-income individuals may rely more on alternative travel modes such as public transportation or carpooling, which are not reflected in Wejo datasets but are more comprehensively captured through mobile phone data. Such correlation differences across different income groups imply the limitations of connected vehicle data in mobility analysis of lower income groups. We also investigate the travel distance distributions of two datasets. We find that both datasets show the same distance-based pattern in which high-income origins travel farther and low-income origins make shorter, localized trips, with SafeGraph capturing slightly longer and more variable distances due to its broader modal coverage. Full statistical results and distance distribution comparisons are provided in Supplemental S1.
These findings confirm that both datasets reveal consistent patterns of distance-based inequality in urban mobility. Higher-income communities tend to travel farther, on average, while lower-income neighborhoods exhibit more localized movement, similar to the findings in (Liao et al., 2025). This alignment is further supported by the strong correlation in OD flows across the two datasets, particularly within high-income groups, implying that both SG and Wejo capture a similar structure of urban travel behavior. Even in low-income areas, where data representation is often a challenge, the observed distance distributions between the two datasets remain remarkably close, indicating that both sources reflect key socioeconomic mobility dynamics.
Factors related to diversity of destination at income levels
To examine how mobility behavior reflects socioeconomic exposure across space, we calculate the entropy of destination at income levels for each CBG, interpreted as the diversity of income categories visited from each origin block group. A higher entropy value indicates a more balanced distribution of trips across low-, middle-, and high-income destinations, suggesting broader socioeconomic connectivity in travel behavior. A lower value, in contrast, reflects a more segregated or restricted mobility pattern toward specific income groups.
Figure 3 (a) and (c) present the spatial distribution of destination income diversity calculated from SG and Wejo datasets, respectively. Despite differences in data sources, both datasets exhibit a broadly consistent spatial pattern: entropy values are generally higher in areas close to the downtown San Antonio and decline toward the suburban areas. This suggests that central neighborhoods tend to have more varied travel destinations in terms of income levels, while trips originating in outer areas are more homogenous, likely reflecting mono-functional land use or socioeconomically isolated travel behavior. Notably, Figure 3(a) shows a more spatially widespread distribution of moderate-to-high entropy values in SG dataset, while Figure 3(c) exhibits greater heterogeneity of CV dataset, with more low-entropy patches appearing in peripheral and northern parts of the city. This may reflect the differing population coverage in the two datasets. SG captures a broader cross-section of travelers while Wejo primarily reflects connected vehicle users whose travel tends to be more spatially and socioeconomically structured. Spatial distribution and cluster analysis of destination diversity across San Antonio.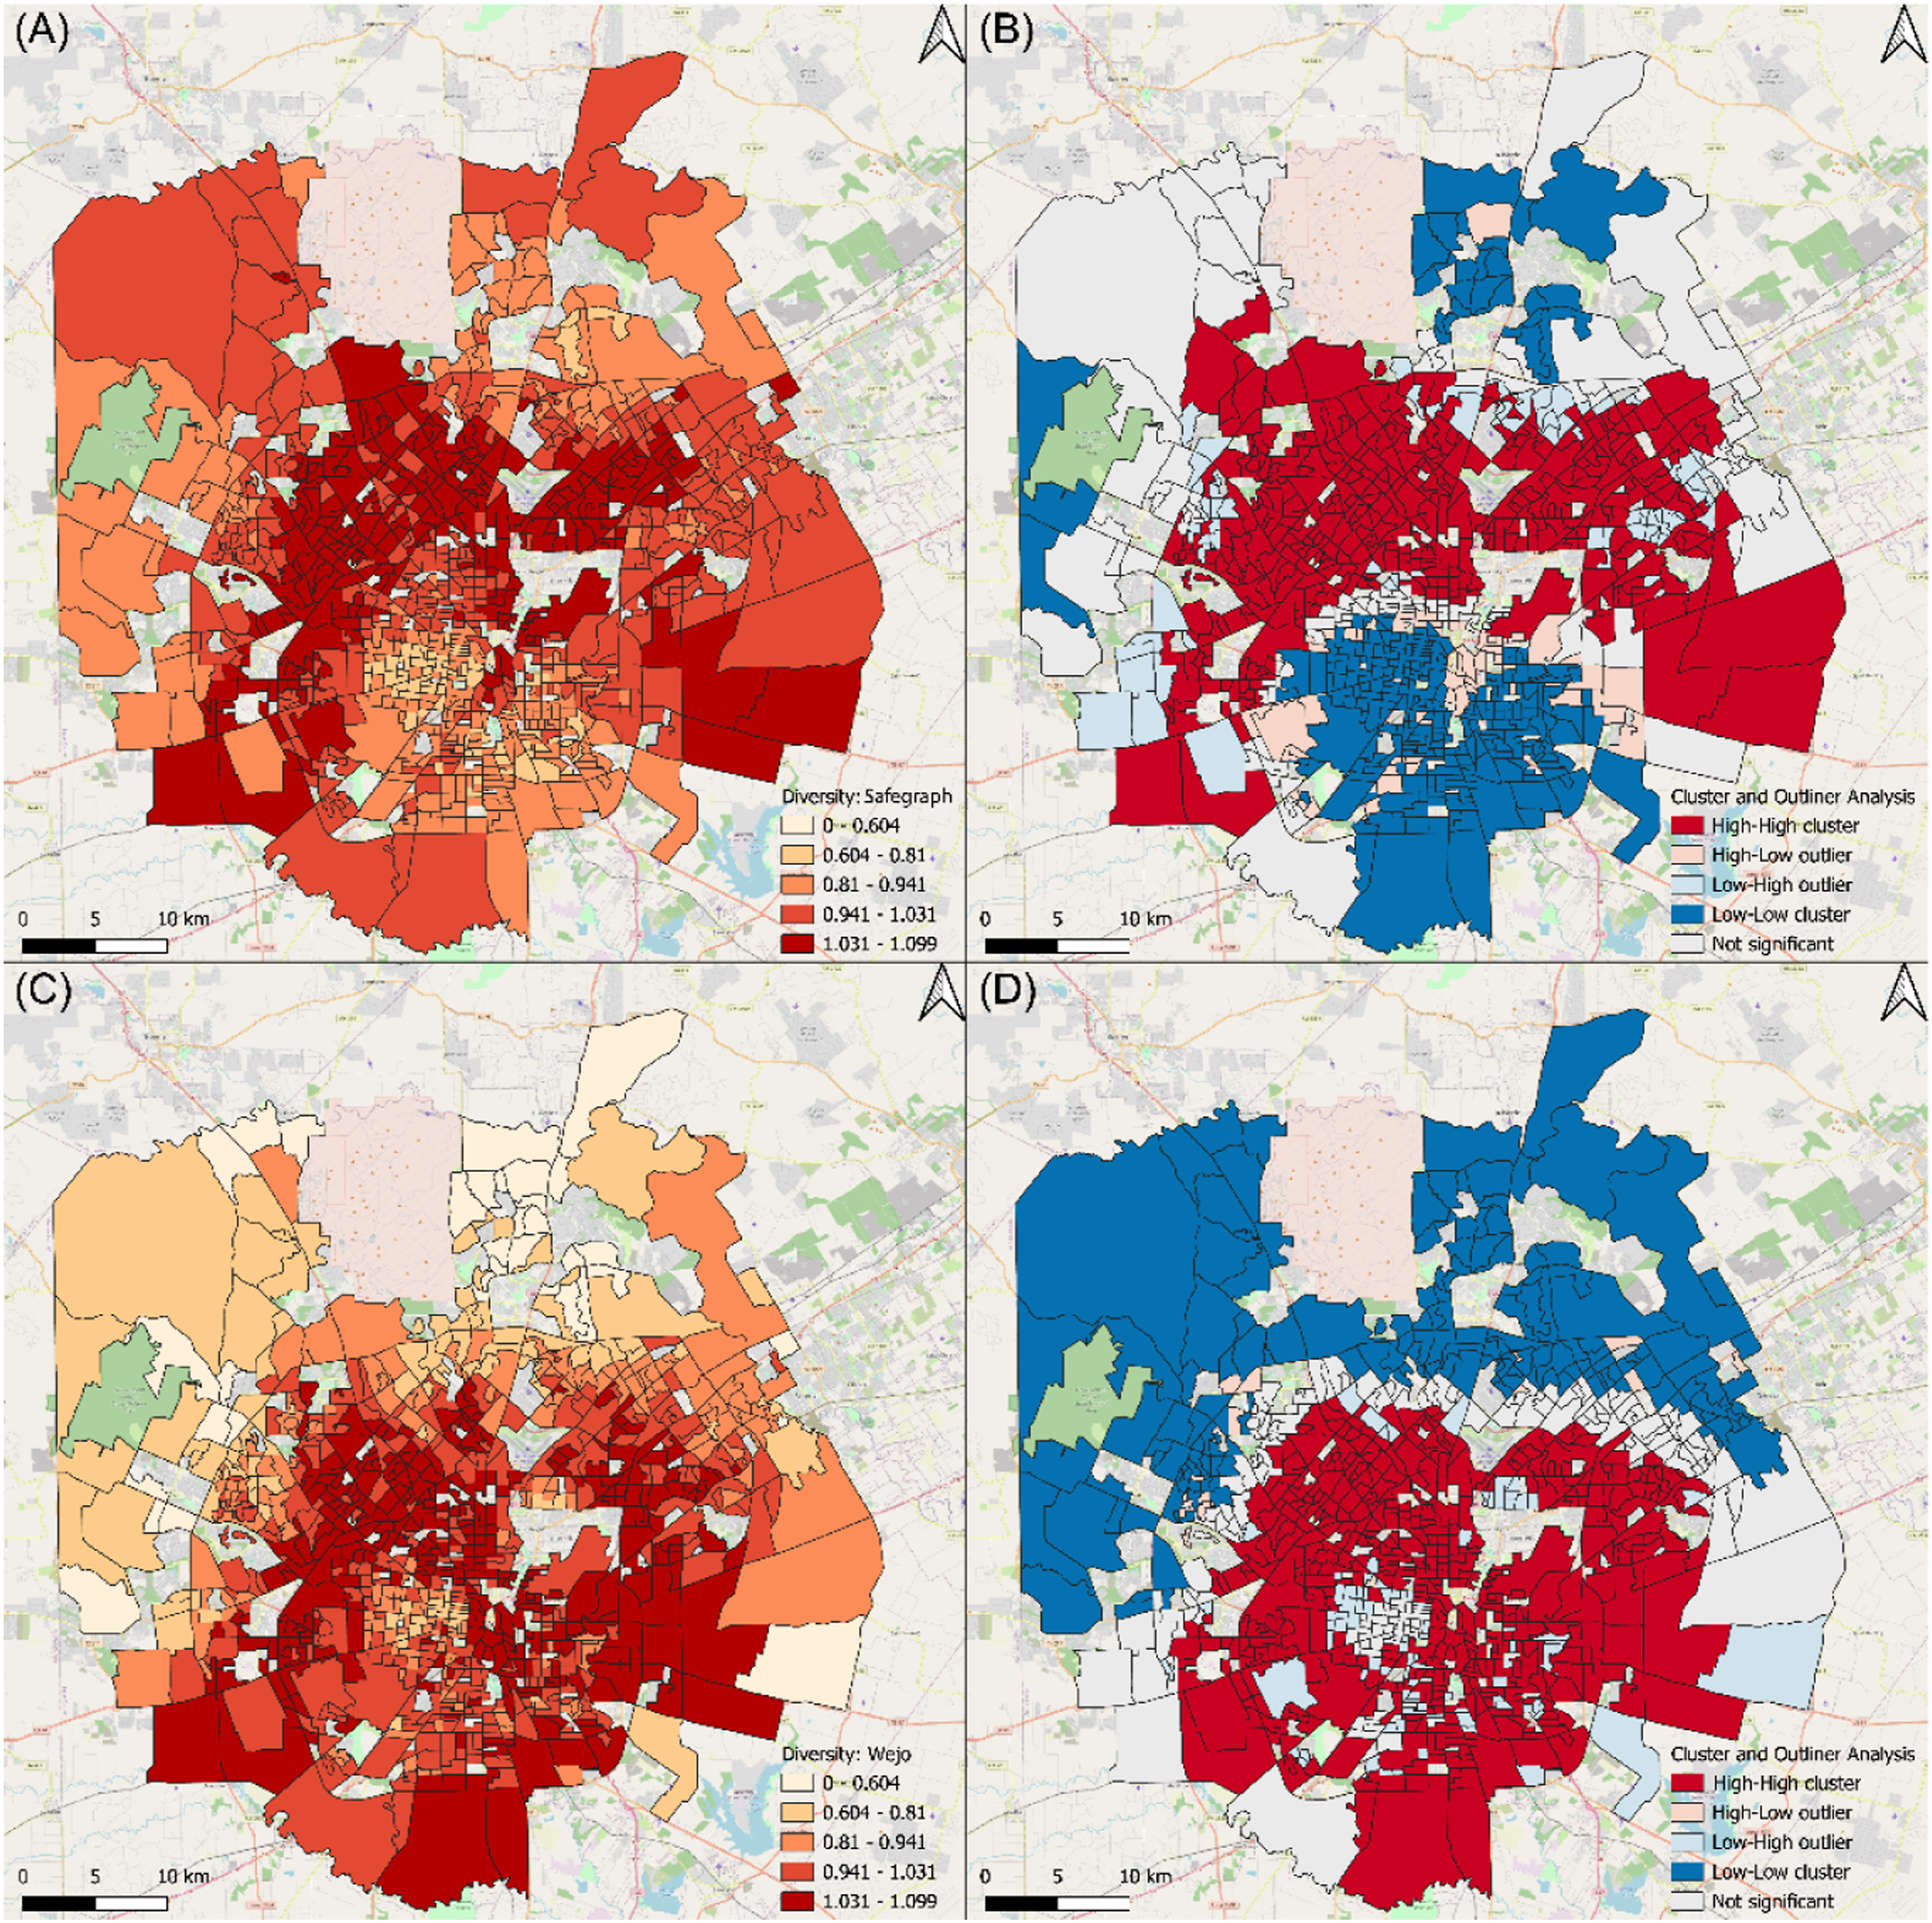
To explore the spatial dependencies of destination diversity in income levels, we apply Local Moran’s I to identify statistically significant clusters of high and low entropy values. As shown in Figure 3(b), the clusters of high entropy in the SG dataset are mainly concentrated in mid-northern neighborhoods in San Antonio, and low-entropy clusters are in the southern and parts of northern neighborhoods of the city. In contrast, the cluster results of CV dataset show a sharper north-south divide in Figure 3(d). The clusters of low entropy areas dominate the north and suburban areas (where high-income communities are primarily located), and high-entropy clusters are more compact and central, largely concentrated around the downtown areas. Such differences of cluster results between two datasets indicate that, compared to the dataset capturing a broader range of travel modes and user groups, the CV data may overestimate the income diversity of destination for lower income groups and may overemphasize the homogeneity of travel in high-income groups. These differences also imply that it is important to consider the representativeness of mobility data when interpreting the spatial structure of mobility-based social exposure.
Regression results for income diversity and explainable variables.
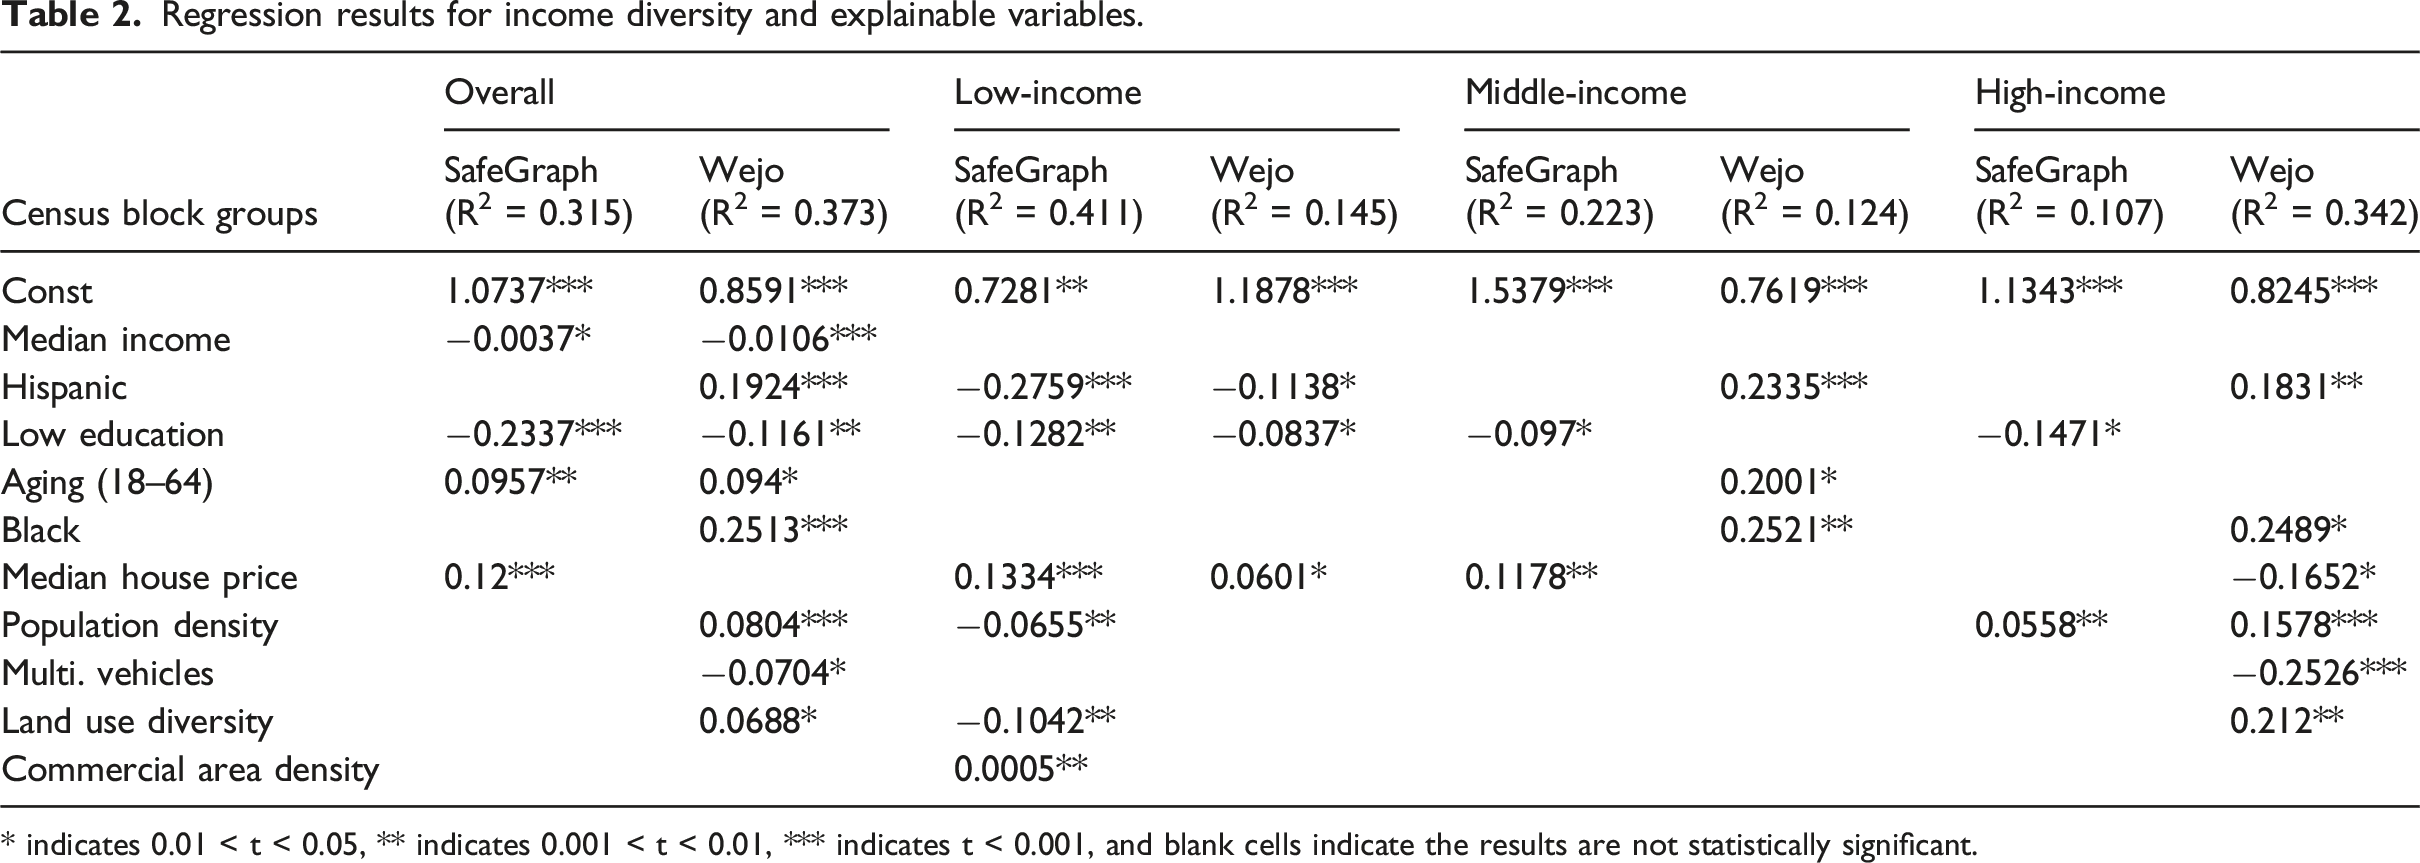
* indicates 0.01 < t < 0.05, ** indicates 0.001 < t < 0.01, *** indicates t < 0.001, and blank cells indicate the results are not statistically significant.
However, residual analysis from the ordinary least squares models revealed statistically significant spatial autocorrelation, according to Moran’s I test (SG: I = 0.80, p < 0.01; Wejo: I = 0.79, p < 0.01). This indicates that the unobserved spatial processes or omitted spatial structure may not be well captured by the standard linear models, suggesting the need for spatial econometric approaches. Thus, we further adopt a spatial lag model, which explicitly incorporates spatial interactions between adjacent CBGs through a spatially lagged dependent variable. We adopted 8 nearest neighbors to calculate a row-standardized spatial weights matrix. As shown in Figure 4, compared to the OLS model, the spatial lag model substantially improves model fit (SG: pseudo-R2 from 0.315 to 0.815; Wejo: from 0.373 to 0.758), suggesting that accounting for spatial dependence is crucial in modeling urban travel diversity. The spatial lag coefficient (ρ) is large and statistically significant in both models (SG: 0.874, p < 0.001; Wejo: 0.853, p < 0.001), indicating strong spatial spillover. Destination diversity in one CBG is influenced by that in neighboring CBGs. While some coefficients appear small in magnitude, the total effects (including spatial feedback) are substantially amplified. For instance, the effect of median income in the SG model has a total effect of −0.0132 compared to the coefficient in OLS of −0.0037. The difference between the SG and Wejo models further reinforces the differing representativeness of the two datasets. SG’s total effects are stronger for variables such as multi-vehicle ownership and education, whereas Wejo reflects more spatial clustering and attenuation of built environment effects. General regression results of spatial lag model with total effects of explainable variables on income diversity.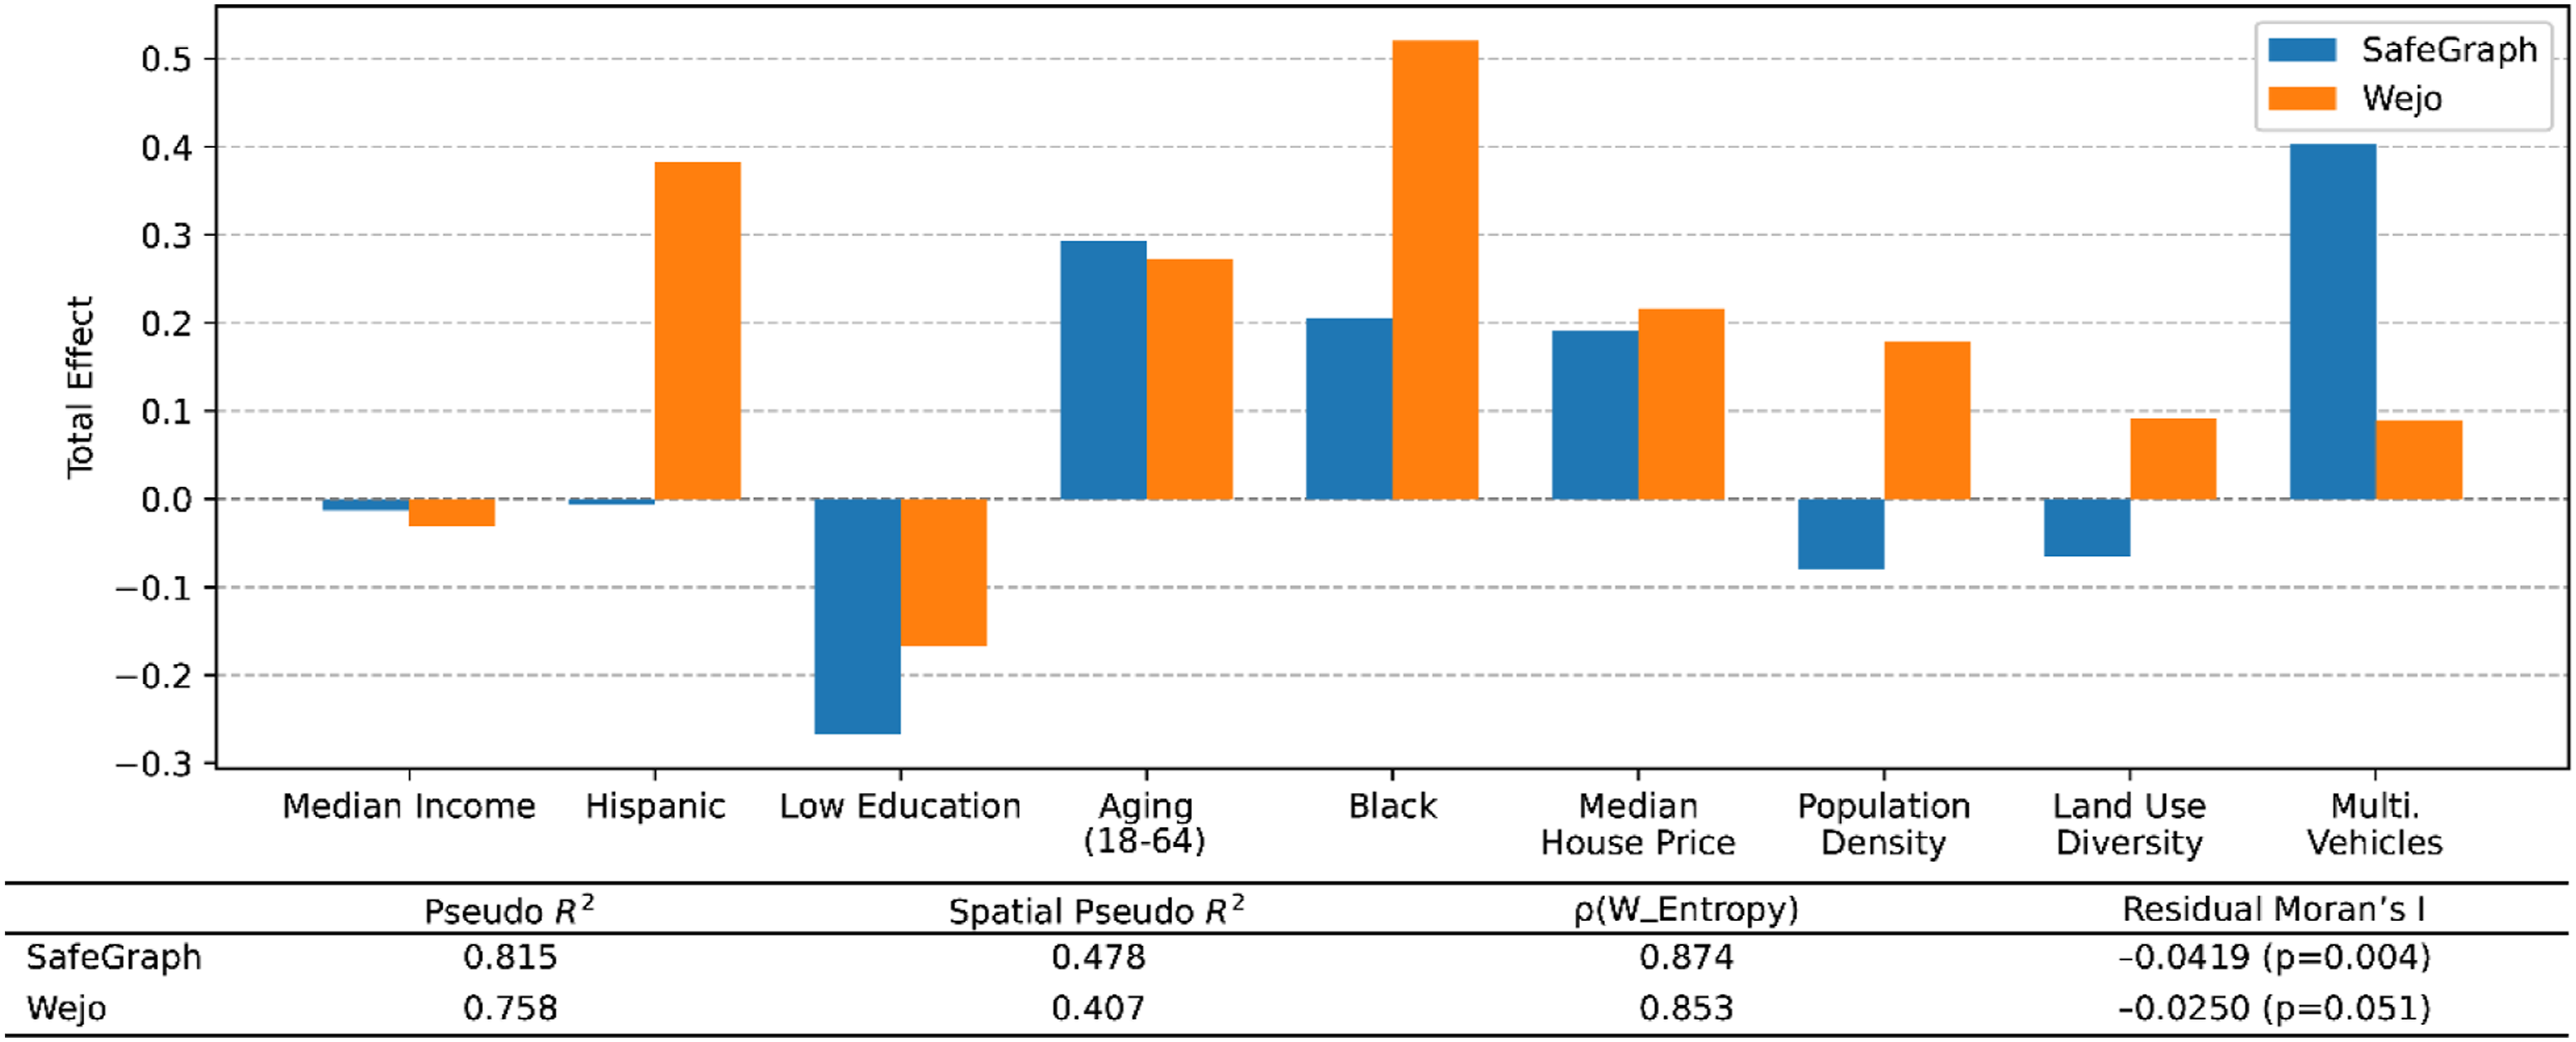
In summary, the regression models confirm and enrich the spatial clustering results while also revealing differences in data representativeness. SG data, which captures a broader and more general population through mobile phone signals, shows stronger associations with demographic factors in low-income neighborhoods. In contrast, CV data, derived from connected vehicle trajectories, better captures mobility patterns in high-income, vehicle-dependent communities. These differences reflect the inherent sampling biases and user profiles of each dataset and emphasize the value of using both sources to understand mobility diversity across socioeconomic contexts.
Impact of socioeconomic, demographic, and built environment on interaction strength across datasets
Regression results for interaction strength and explanatory variables (overall and intra-group interactions).
* indicates 0.01 < t < 0.05, ** indicates 0.001 < t < 0.01, *** indicates t < 0.001, and blank cells indicate the results are not statistically significant.
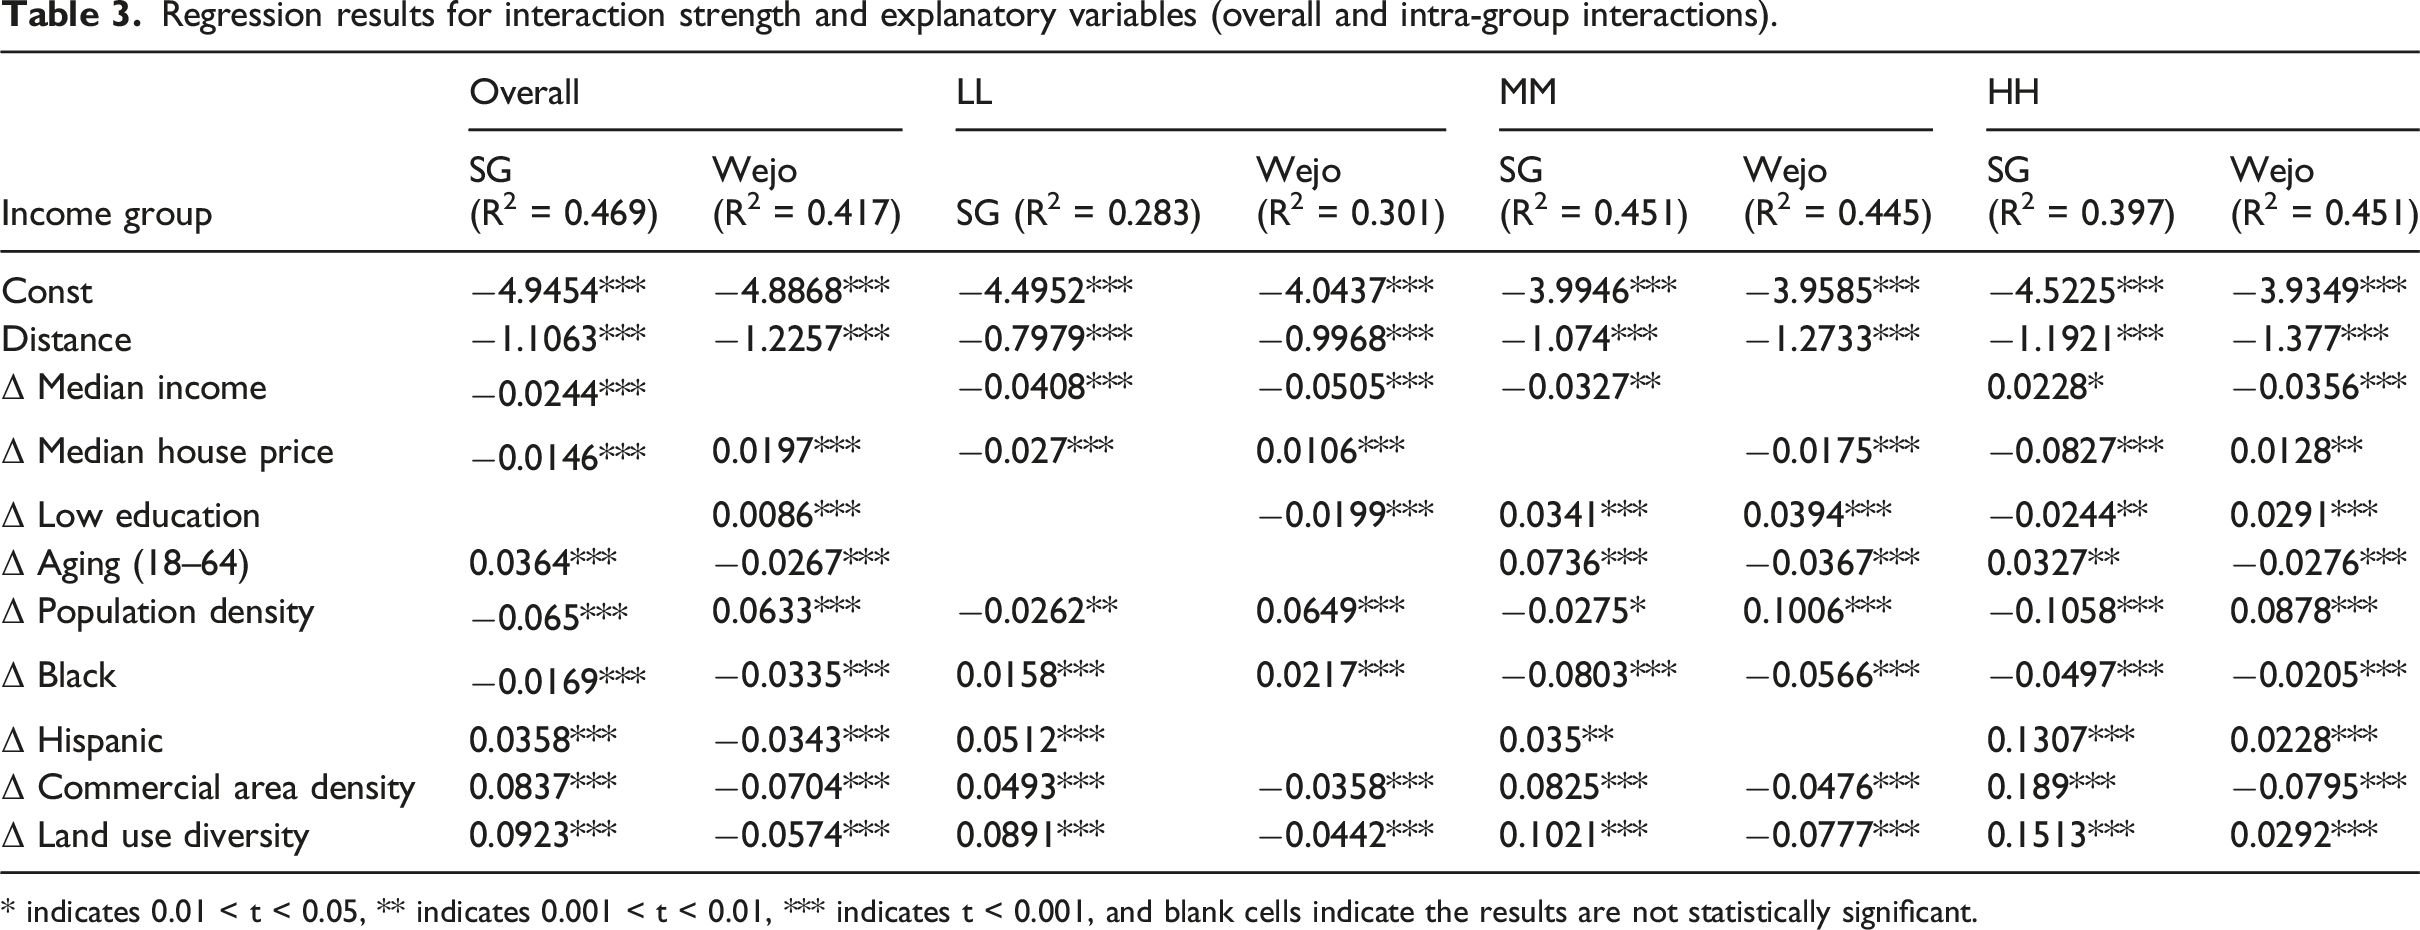
Based on the regression results, SG data reveals greater interaction among socioeconomically similar and built environmentally diverse neighborhoods, indicating broader and more socially integrative mobility. In contrast, Wejo interactions are more segmented. In specific, CV users exhibit stronger ties within affluent, vehicle-oriented areas and weaker connections in socially or spatially diverse neighborhoods. Spatial distance remains the strongest negative factor across both datasets. Full variable-level results for overall, within-group, and cross-group interactions are provided in Supplemental S3.
Moreover, we estimate regression models for inter-group interactions to understand how socioeconomic disparity shapes mobility across social boundaries, and how these relationships differ between SG and Wejo data sources. Full regression results are provided in Supplemental S4. Based on the regression results shown in S4. Table 1, spatial distance remains a strong and negative predictor of interaction strength, consistent with prior findings. Beyond this, several socioeconomic disparities show meaningful contrasts. In both datasets, larger differences in median income and educational attainment are associated with stronger cross-income interactions, suggesting the presence of functional linkages such as commuting from lower- to higher-income neighborhoods. However, differences in demographic composition and built environmental characteristics diverge across SG and Wejo. SG generally captures stronger cross-income connections in neighborhoods with varied land-use patterns or greater social diversity, while Wejo shows weaker and more selective interaction patterns, reflecting the mode- and population-specific nature of connected-vehicle data.
Conclusion, discussion, and limitations
This study compares connected vehicle and mobile phone datasets to evaluate their effectiveness in capturing urban mobility patterns, with particular attention to destination diversity and spatial interaction across income groups. While both data sources reveal broad consistent patterns in aggregate flows and travel distance stratified by income, deeper analysis uncovers important divergences rooted in data representativeness and user behavior. These differences carry meaningful implications for how each dataset reflects urban social structures and mobility inequalities (Wang et al., 2018).
First, our findings highlight that connected vehicle data reflect a more behaviorally specialized and demographically selective subset of the urban population. CV users are disproportionately drawn from higher-income households with access to newer, telematics-equipped vehicles, which contributes to strong correlation in high-income OD flows and longer average trip distances for affluent communities. In contrast, the SafeGraph mobile phone dataset offers a more inclusive representation of travel behavior across income levels, capturing a broader diversity of travel modes and user demographics. However, as Shelton et al. argue, the apparent inclusiveness of digital trace data should be critically examined in light of structural biases in who generates and who is visible within these datasets (Shelton et al., 2015). This distinction becomes particularly evident in the modeling of destination income diversity, where SafeGraph explains significantly more variation among low-income communities, whereas CV data exhibit greater explanatory power in high-income areas. This reflects ongoing concerns in the mobility data literature about how data infrastructures systematically privilege certain populations while obscuring others (Zook and Graham, 2007).
Second, the spatial clustering of destination diversity reveals fundamental differences in the geographic distribution of social exposure. While both datasets identify higher diversity in central urban areas, the CV data display sharper spatial segmentation, with lower entropy concentrated in suburban, high-income zones. These findings are consistent with the spatial mismatch hypothesis (Kain, 1968; Ong and Blumenberg, 1998) which suggests that physical distance and infrastructure limit cross-group access to opportunities. These patterns suggest that CV users may be less likely to engage in cross-income travel compared to the general population. Such spatial homogeneity is further reinforced by regression results showing that multi-vehicle ownership and high median house prices are associated with lower diversity of destinations in the CV data, an indication of routine, car-dependent, and potentially socially insulated travel behavior.
Third, the analysis of interaction strength further differentiates the datasets. Although spatial distance consistently serves as a key mobility constraint in both, other socioeconomic and demographic factors exhibit contrasting effects. SafeGraph data point to higher interaction between demographically and socioeconomically similar areas, consistent with mobility bounded by residential segregation. Yet, they also capture stronger intergroup interaction where built environment diversity is high, suggesting that urban complexity fosters cross-boundary mobility. This supports recent conceptualizations of mobility as a form of social exposure and integration (Liao et al., 2025; Wang et al., 2018), where movement through diverse urban spaces contributes to contact across group boundaries. Conversely, CV data show a greater degree of segmentation, with negative associations between interaction strength and land use diversity, Hispanic population differences, and commercial activity differences. This may reflect not only behavioral specialization but also biases in data coverage, which are known to affect mobility estimates and have implications for downstream modeling (Schlosser et al., 2021). While some of this segmentation may arise from users’ more destination-specific or commuting-driven patterns, the possibility of underrepresentation in diverse or marginalized communities cannot be ruled out.
Finally, our disaggregated regression models provide additional insights into the behavioral structure of mobility across income groups. Cross-income mobility is positively associated with income and educational disparities, especially in the CV dataset, which may reflect commuting flows from lower-to higher-income areas. However, demographic differences, particularly in the share of Black residents, consistently reduce cross-income interaction in both datasets, pointing to the persistent role of racial homophily in shaping spatial exposure and reinforcing urban segregation (Athey et al., 2019; Vachuska, 2023). Notably, the SafeGraph data more consistently capture the integrative effects of urban form and social diversity, while the CV data highlight the influence of travel mode and user selectivity in shaping mobility patterns.
Based on the above findings, several observed patterns—such as the concentration of connected-vehicle trips in higher-income neighborhoods—align with expectations; however, their empirical confirmation offers valuable evidence for evaluating the representativeness of emerging mobility data sources. The comparison between SG and Wejo further quantifies how socioeconomic disparities manifest spatially and exposes systematic differences in data coverage that mirror the broader digital and vehicular divide. By comparing mobility patterns extracted from both datasets, the study also reveals neighborhood-level variations in travel mode preferences and mobility intensity, providing critical insight into how large-scale mobility datasets represent, or fail to represent, real-world travel behavior. To sum up, these findings emphasize the importance of interpreting connected-vehicle–based mobility analysis within a wider context of data accessibility and equity. Moreover, the comparative framework established in this study can be extended to other cities or data sources to assess how different sensing technologies capture urban mobility and social diversity.
Although the comparative advantages of mobile phone data in capturing diverse travel behaviors, some potential representative biases of the SafeGraph dataset could impact the reliability of inferences. Its representativeness depends on the underlying panel of mobile devices, which may under-sample certain population groups such as children, elderly individuals, or those without smartphones (Jardel and Delamater, 2024; Z. Li et al., 2024). Additionally, device-level anonymization and location sampling strategies can affect spatial precision and completeness of OD flows. While SafeGraph appears to capture greater social diversity in our analysis, potential biases in data coverage and signal quality should be acknowledged when interpreting its apparent inclusivity. Future research should consider validation using multiple mobile data sources to assess consistency and coverage.
While SafeGraph and Wejo datasets both capture large-scale mobility patterns, they differ in their modal coverage. SG data represent movements across all transportation modes, including walking, public transit, and driving, whereas Wejo data reflect only motorized trips generated by connected private vehicles. In this study, SG serves as a background representation of overall population mobility rather than a mode-specific comparison. This design highlights how connected-vehicle data represent a distinct subset of urban travel behaviors, particularly those associated with private vehicle use. Although SafeGraph does not contain explicit information about transportation mode, prior studies have shown that its aggregated mobility patterns tend to align more closely with car-based movements than with walking or transit activity (Jiang et al., 2025). This characteristic suggests that SG captures a substantial portion of vehicular travel, supporting its use as a meaningful background dataset for comparison with Wejo. However, identifying the subset of SG trips that are more likely associated with driving would allow for a more mode-consistent comparison with Wejo. Such a targeted comparison could reveal how well connected-vehicle data capture the spatial patterns of vehicular mobility represented in aggregated population data, providing a clearer understanding of the representativeness and potential biases of connected-vehicle–based mobility analysis.
Moreover, we acknowledge that the connected vehicle data used in this study represent only a portion of privately owned vehicles and do not include on-demand or fleet-based connected vehicles. In the next step, we will incorporate multiple sources of connected vehicle data in this comparison to better capture the diversity of the connected vehicle ecosystem. In addition, future analyses will compare SafeGraph and Wejo data across different periods of the day and day types. Such differentiation will help identify when connected-vehicle data align or diverge from population-level mobility. For example, stronger agreement during weekday commuting peaks and larger gaps on weekends or holidays could be observed. This temporal extension will help evaluate the stability of connected-vehicle representativeness within broader human mobility patterns.
At last, public transportation accessibility represents an important structural factor shaping urban mobility and its socioeconomic patterns. Areas with dense transit coverage often exhibit different travel behaviors and income compositions than those primarily dependent on private vehicles. While this study centers on resident-based vehicular and general mobility captured by connected vehicle and mobile phone data, the role of public transit remains crucial for understanding mobility equity and segregation in U.S. cities. In the future, we plan to incorporate measures of transit coverage and service availability to extend this comparative framework, enabling a more comprehensive examination of how public and private mobility systems jointly shape urban accessibility and social interaction.
Despite these limitations, the comparative framework developed in this study provides a transferable methodology for evaluating the representativeness and spatial bias of emerging mobility datasets. By jointly analyzing connected-vehicle and mobile-phone data within a unified spatial and socioeconomic structure, the framework enables researchers and planners to identify where data sources over- or under-represent certain populations and travel behaviors. This approach can support evidence-based mobility planning, improve the design of data-driven transportation models, and guide more equitable integration of multi-source mobility information in smart-city initiatives. Furthermore, it offers a foundation for future comparative studies across different cities and data types, helping to establish standardized benchmarks for assessing mobility data quality and inclusivity.
In summary, these findings emphasize the importance of evaluating data source characteristics when interpreting mobility-based social structures. While connected vehicle data offer detailed insights into private vehicular travel, they are limited in their representation of transit-dependent, lower-income, and racially marginalized populations. Mobile phone data, despite certain limitations in temporal granularity, provide a more comprehensive view of urban mobility, especially in capturing socially integrative and spatially complex behaviors. These distinctions underline the need for careful consideration in the application of emerging mobility datasets in transportation equity research, urban planning, and policy design.
Supplemental material
Supplemental material - Comparing connected vehicle and mobile phone data for urban mobility analysis: Examining mobility diversity and spatial interaction across income groups
Supplemental material for Comparing connected vehicle and mobile phone data for urban mobility analysis: Examining mobility diversity and spatial interaction across income groups by Xinyu Li, Shih-Lung Shaw, Dayong Wu, Xinyue Ye, Xiao Huang, Zhenlong Li, Qi Wang, and Chunwu Zhu in Environment and Planning B: Urban Analytics and City Science
Footnotes
Funding
The authors disclosed receipt of the following financial support for the research, authorship, and/or publication of this article: This work was supported by the National Science Foundation, (2323419, 2401860, 2430700, 2526487) and Texas Department of Transportation (TxDOT) (693JJ22330000Y560TX0511224).
Declaration of conflicting interests
The authors declared no potential conflicts of interest with respect to the research, authorship, and/or publication of this article.
Data Availability Statement
The research team previously accessed Wejo connected vehicle data through TxDOT RTI Project 0-7200 under a statewide data agreement. This agreement has since expired, and the data are no longer available.
Supplemental material
Supplemental material for this article is available online.
Author biographies
References
Supplementary Material
Please find the following supplemental material available below.
For Open Access articles published under a Creative Commons License, all supplemental material carries the same license as the article it is associated with.
For non-Open Access articles published, all supplemental material carries a non-exclusive license, and permission requests for re-use of supplemental material or any part of supplemental material shall be sent directly to the copyright owner as specified in the copyright notice associated with the article.