
Abstract
This study analyses intra-urban consumption flows in Madrid through a spatial analysis using over 689 million anonymized bank card transactions recorded in 2023. By disaggregating data by age and income groups, the research uncovers significant variations in consumer mobility patterns and spatial preferences. Older adults and high-income groups exhibit more localized consumption behaviors, while middle-income groups demonstrate wider mobility across the city. High-income populations concentrate their activity in affluent areas, whereas central districts emerge as common ground with higher levels of social interaction. The study applies network and centrality analysis to identify functional commercial areas and their degree of connectivity, revealing strong links between sociodemographic structure and urban spatial dynamics. Results underscore the relevance of integrating consumption-related mobility into urban planning frameworks to address spatial segregation and promote social mix. The research contributes to a growing body of work leveraging Big Data to understand complex urban behaviors at a granular scale.
Introduction
The rise of large retail outlets has threatened small neighborhood shops. Their consolidation on city peripheries has created new urban centralities that challenge the relevance of traditional commercial areas (Guy, 2000). These transformations have reshaped consumption patterns and established a new intra-urban consumption landscape, linked to broader urban restructuring. Factors such as the redefinition of city centers; gentrification (Janoschka et al., 2014); changes in lifestyles, values, household composition, and leisure practices; the spread of new technologies and e-commerce (Jones and Livingstone, 2018); and the growth of activities like the night-time economy, large-scale events, and tourism are among the many transformations that impact the ways consumption takes place in cities (López-González, 2024). In this context, consumer spatial behavior has become increasingly complex. Christaller’s premise of choosing the nearest store is now surpassed by a decision-making process involving numerous factors, such as the consumer, the offering (Guy, 1998), trip utility (Fotheringham, 1988), or the socio-symbolic capital of the spaces (Carpio-Pinedo and Gutiérrez, 2020).
Traditionally, marketing and psychology have been the main disciplines focusing on the study of consumer spatial behavior (Kivell and Shaw, 1980). Research relied on surveys and fieldwork, whose high cost and limited scope confined analysis to specific cases (Schuler, 1979; Vithanage et al., 2023). This situation—exacerbated by the lack of official statistics with an intra-urban and spatial focus on spending—has hindered the development of broader studies on intra-urban mobility and consumption to better explore the relationship between consumption and the city.
The emergence of new data sources associated with Big Data has enabled advances in this research area. These studies often rely on sources that act as proxies for consumption, such as social media data (Carpio-Pinedo and Gutiérrez, 2020; Martí et al., 2019), or more direct sources like credit card transactions. The latter has been used in previous academic research for various purposes (Aparicio et al., 2022; De Las Obras-Loscertales et al., 2025; Hashemian et al., 2017; Lenormand et al., 2015; Sobolevsky, Bojic, et al., 2015; Sobolevsky et al., 2014, 2016; Sobolevsky, Massaro, et al., 2015; Yoshimura et al., 2016, 2018, 2021, 2022); however, only three studies have jointly analyzed mobility and consumption (Lenormand et al., 2015; Yoshimura et al., 2016, 2018), focusing on multi-purpose shopping and differentiating by age, gender, and occupation.
This research makes a fourfold contribution to the international literature using bank card transaction data: (1) it considers differences by both age and income, the latter so far unexplored; (2) it deepens the understanding of urban spatial structure by classifying consumption spaces according to levels of centrality and attractiveness; (3) it identifies consumption functional areas by applying a modularity analysis and characterizes them with indicators such as distance and social mix; and (4) it reflects on the implications for urban planning and social interaction, emphasizing the importance of integrating these dynamics into policy design.
The article is structured as follows: after this brief introduction, Section 2 reviews the related literature, and Section 3 describes the study area. Section 4 presents the data and methodology, Section 5 shows the main results, and Section 6 discusses findings and conclusions.
Literature review: Big Data sources, consumption, and mobility
The emergence of new Big Data sources helps address some of the limitations of traditional consumption studies. Their high spatial and temporal resolution, combined with the large data volumes and sample sizes (Kaisler et al., 2013; Kitchin, 2013), provides a unique opportunity to complement and enhance traditional survey-based approaches (Girardin et al., 2008). In recent years, numerous studies have analyzed intra-urban consumption using social media data from various perspectives. In most cases, these data serve as proxies for commercial activity. For instance, studies based on Google Places data have enabled the identification of the most frequented areas in cities and their temporal variations (Martí et al., 2017, 2019; Santiago-Iglesias et al., 2023). Other widely used proxies include social media platforms such as Foursquare, which have been used to locate popular establishments (Carpio-Pinedo and Gutiérrez, 2020) and analyze visitor activities (Salas-Olmedo et al., 2018). These articles deal with consumption in the city using proxies, but they do not properly study the consumption mobility patterns.
On the other hand, Big Data has been widely applied to urban mobility studies using diverse methods, sources, and purposes (Wang et al., 2020). Several studies have examined spatial behavior across population groups. For instance, Luo et al. (2016) used Twitter data to analyze the radius of gyration by age, gender, and race/ethnicity, finding the largest differences in the latter. Xie et al. (2016) employed GPS trajectories to explore variations by gender, age, and occupation. Mobile phone data have also been used to identify gender-based mobility differences (Gauvin et al., 2020), patterns that have likewise appeared in studies on urban vitality, where greater gender disparities are associated with higher densities of third places (Collins et al., 2024); spaces where differences by age have also been studied (Botta and Gutiérrez-Roig, 2021). However, these studies generally adopt a broad perspective. In fact, mobility studies based on mobile phone data have not been able to differentiate shopping trips from other types of trips (Wang et al., 2020).
To overcome these limitations, the most suitable source for studying urban consumption is bank card transaction records. This data source allows for an accurate measurement of actual spending, the number and location of transactions, and even certain sociodemographic characteristics of consumers. Despite the inherent bias—Yoshimura et al. (2018) point to a possible bias in the representativeness of the economically active population—the increasing use of card payments as a common payment method supports their growing validity. According to the Bank of Spain (Rodríguez Molina and Esandi Erro, 2025), card usage increased from 28% to 32% between 2022 and 2024, with up to 86% of the population now using them, making these records increasingly broad and representative for consumption studies. However, due to the sensitive nature of this information and the difficulty of accessing it, their use remains in its early stages, with limited application to intra-urban research. In fact, most existing studies have employed interurban or regional scales (Hashemian et al., 2017; Sobolevsky et al., 2014, 2015, 2016; Sun et al., 2024).
Using an intra-urban approach, Di Clemente et al. (2018) studied the sequences of credit card purchases to detect patterns of collective behaviour and generate consumer profiles. Yoshimura et al. (2021) examined how retail density and accessibility influence consumption. More recently, Aparicio et al. (2022) examined tourist spending patterns in Madrid, while Carpio-Pinedo et al. (2022) focused on the spatiotemporal patterns of consumption by commercial sector in the same city. Additionally, De Las Obras-Loscertales et al. (2025) explored the spatial distribution of spending in the nighttime economy and its links to urban and sociodemographic variables.
To our knowledge, only a limited number of studies have approached the intersection between mobility, consumption and urban space. Lenormand et al. (2015) examined the influence of age, gender, and occupation on mobility, measured in terms of distance and time between consecutive transactions and the radius of gyration. Meanwhile, Yoshimura et al. (2016, 2018) focused on multi-purpose travel behavior. Yoshimura et al. (2016) analyzed the pre- and post-visit behavior of customers to a retail brand with multiple store locations, aiming to determine whether factors such as store location or seasonal variation influence the number, origin, and type of consumers. Yoshimura et al. (2018) applied urban association rules to analyze relationships between different stores and commercial sectors within shopping trips. However, none of these studies analyze differences across income strata or the implications of consumption mobility patterns for the city’s spatial structure in terms of centrality and functionality.
Area of study
Madrid, with over 3.3 million inhabitants (7.3 million in its metropolitan area), is the largest city in Spain and one of the largest in Europe (INE, 2023). Its economy is highly tertiarized, and commercial deregulation has facilitated the proliferation of diverse retail establishments across the city. Consequently, the historical duality between central traditional commerce and large peripheral malls has evolved into a more heterogeneous landscape with multiple retail formats (Carpio-Pinedo and Gutiérrez, 2020).
The city’s commercial structure shows a sharp contrast between the center—characterized by a high density of neighborhood shops—and the periphery, where density is low except in planned areas such as retail parks and large shopping centers (Figure S1a). On the other hand, Madrid exhibits a pronounced spatial differentiation of the population according to income level (Figure S1(b)). Lower-income groups are concentrated in the southern and southeastern periphery, whereas wealthier populations are found in the center and northwest of the city (Carpio-Pinedo and Gutiérrez, 2020).
Data and methods
Dataset
The dataset used contains anonymized bank card transaction data from one of the main banks in Spain during 2023 1 . More than 689.2 million transactions were recorded. The data include card payments at any point of sale (POS) terminal. For each transaction, the amount spent and the location (500 × 500 m grid cells) where the payment occurred are recorded, as well as the postal code of the consumer’s residence and their age group. In this way, for each consumption cell, we have the total expenditure and the number of transactions originating from each of the residential postal codes, disaggregated by age groups.
Since the spatial origin unit in the dataset is postal codes and the destination unit is grid cells, the first step was to transform the origin spatial unit to match the destination unit. Using regular tessellation is more appropriate than administrative units because it avoids potential distortions in distance due to the varying sizes of postal codes and mitigates the problem of MAUP (Modifiable Area Unit Problem (Openshaw, 1979)). To do this, each grid cell was assigned to the postal code covering the largest portion of the cell, and transactions from each postal code were redistributed to the corresponding grid cells, weighted by the estimated population of each age group. Population per grid cell was estimated using census tracts and adjusted based on residential square meters per building from the Cadastre. The selected age groups (≤35, 35–65, and >65) have been defined based on the available data and labor considerations. These ranges capture the differences between young people (≤35), the economically active population with greater family responsibilities (35–65), and retirees (>65), reflecting groups with distinct characteristics and lifestyles.
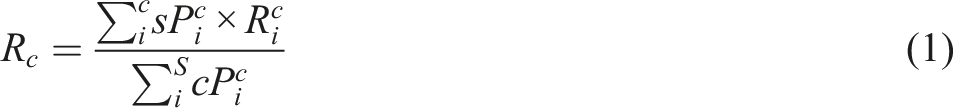
This information has been enriched with data on average per capita income available at the census tract level (INE, 2022) (Eq 1). Five income strata have been established by quintiles–with Q1 = lowest income and Q5 = highest–ensuring equal representation of spatial units in the Origin-Destination (O-D) analysis, even if population shares differ (Figure S1(b)).
Methodology
The transaction numbers and total expenditure data for the city of Madrid have been analyzed to understand the consumption relationships between different areas of the city. Network analysis methods have been applied to identify the spatial structure of the consumption network, calculate centralities, and detect commercial functional areas for the different sociodemographic groups.
Network analysis
Creation of origin-destination matrices
Origin-Destination (OD) matrices have been widely used in mobility studies to identify patterns, estimate trips, or predict them (Mohammed and Oke, 2023). Their cartographic representation serves as a valuable tool for visual analysis, helping to understand complex spatial datasets and uncover patterns and flows (Robinson et al., 2017). In this study, the OD matrices were constructed to represent the spatial relationships between places of residence and transaction locations, disaggregated by population groups, allowing us to analyze the connections between different parts of the city and consumer spatial behavior.
Matrices were generated in ArcGIS Pro using the network dataset to calculate pedestrian distances, providing distance statistics for the entire population and each study group.
Centrality calculation
Centrality measures the relative importance of nodes within a network. The definitions and formulas used to estimate centrality depend on the analysis objective and network properties. Degree centrality, one of the most widely used metrics, quantifies the number of nodes connected to a given node (Freeman, 1979) and has been extended to weighted networks by summing the connection weights (Barrat et al., 2004; Newman, 2004). However, this approach presents limitations, as it considers only the total weights, without accounting for the number of nodes to which a node is connected (Opsahl et al., 2010).
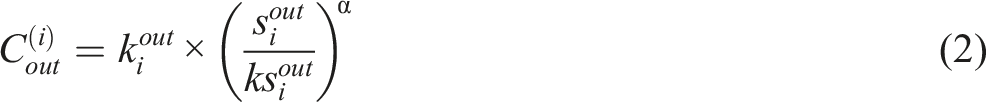
In our directed and weighted network, we aim to measure the input degree centrality, based on the consumption recorded at them—considering that consumption activity is higher the greater the number of transactions recorded at a node—but also accounting for the number of connections established. Therefore, between two nodes receiving the same number of transactions, the one with transactions from a greater number of other nodes will have higher centrality, as this implies greater attraction from different parts of the city. For its calculation, Opsahl et al. (2010) propose the following formula (Eq. 2): • Main centralities or outliers, corresponding to the highest outlier values of the distribution, using the interquartile method. Centrality values that are 1.5 times the interquartile range above the third quartile. • Secondary centralities or Top10, corresponding to values above the 90th percentile of the data. • Tertiary centralities or Top25, corresponding to values above the 75th percentile of the data. • Moderate centralities, which correspond to values above the average. • All other spaces are considered to have low centrality.
Detection of functional areas
Identifying functional areas is a key aspect of urban planning (Zhong et al., 2014). Numerous studies have calculated functional areas from various data sources, methodologies, and purposes, including approaches based on urban morphology, land use, landscape (Xing and Meng, 2018), human activities (Gao et al., 2017), or mobility (Osorio Arjona et al., 2023). In this study, functional areas are defined as a set of nodes that have a stronger link in consumption, measured through the number of transactions recorded. Thus, each generated area is characterized by stronger connections within it than with other areas.
To delineate these areas, the modularity value has been calculated, which is an optimization performed on a network to detect and obtain an adequate number of clusters (Fortunato and Barthélemy, 2007). Modularity was calculated using the algorithm by Blondel et al. (2008) implemented in the Gephi software. This method estimates modularity in large, directed, weighted networks in two phases: first, each node is assigned to a community, and nodes are iteratively moved to the community that maximizes modularity gain; second, a new network is built with communities as nodes and link weights recalculated. In this way, each node shares a modularity value with its functional area (Blondel et al., 2008), without necessarily being spatially contiguous.
This algorithm has limitations, such as fitting issues or the tendency to search for communities of similar size (Peixoto, 2021). Therefore, the detected areas are considered useful for summarizing key patterns for urban planning but not as an inferential method. For functional areas by income strata, due to the observed distribution, matrices representing less than 0.004% of transactions were removed to reduce noise and emphasize the main functional areas.
Results
Our dataset reveals distinct consumption patterns by age and income. Individuals under 35 accounted for 21.5% of transactions, those aged 35–65 for 57.9%, and those over 65 for 20.6%, the latter averaging the highest number of transactions per card (2.7 vs 2.2). Higher-income groups also showed more transactions per card (2.6). Average transaction amounts decreased with both age (€31.1 to €18.1) and income (€27.7 to €23.5), while middle-aged and lower-income individuals exhibited greater mobility, with longer travel distances and more connections (Table S1).
Origin–Destination Matrix
Most interactions took place between nodes located less than 3 km apart (Figure 1(a)), indicating strong spatial relationships between nearby areas. Although these short-distance flows represent only 10.45% of connections, they account for 69.33% of the total transactions. The remaining 30% take place over longer distances, with the number of connections decreasing as distance increases (Figure 1(b)). Notably, some long-distance flows, particularly toward the Centro and Salamanca districts, stand out due to higher transaction volumes and spending, driven by increased average transaction amounts with distance (Figure 1(d)). Origin–Destination Matrix. (a) Flows between nodes >3 km apart; (b) Flows between nodes >3 km; (c) spatial distribution of transactions; (d) relationship between average ticket (points) and number of transactions (bars) with distance.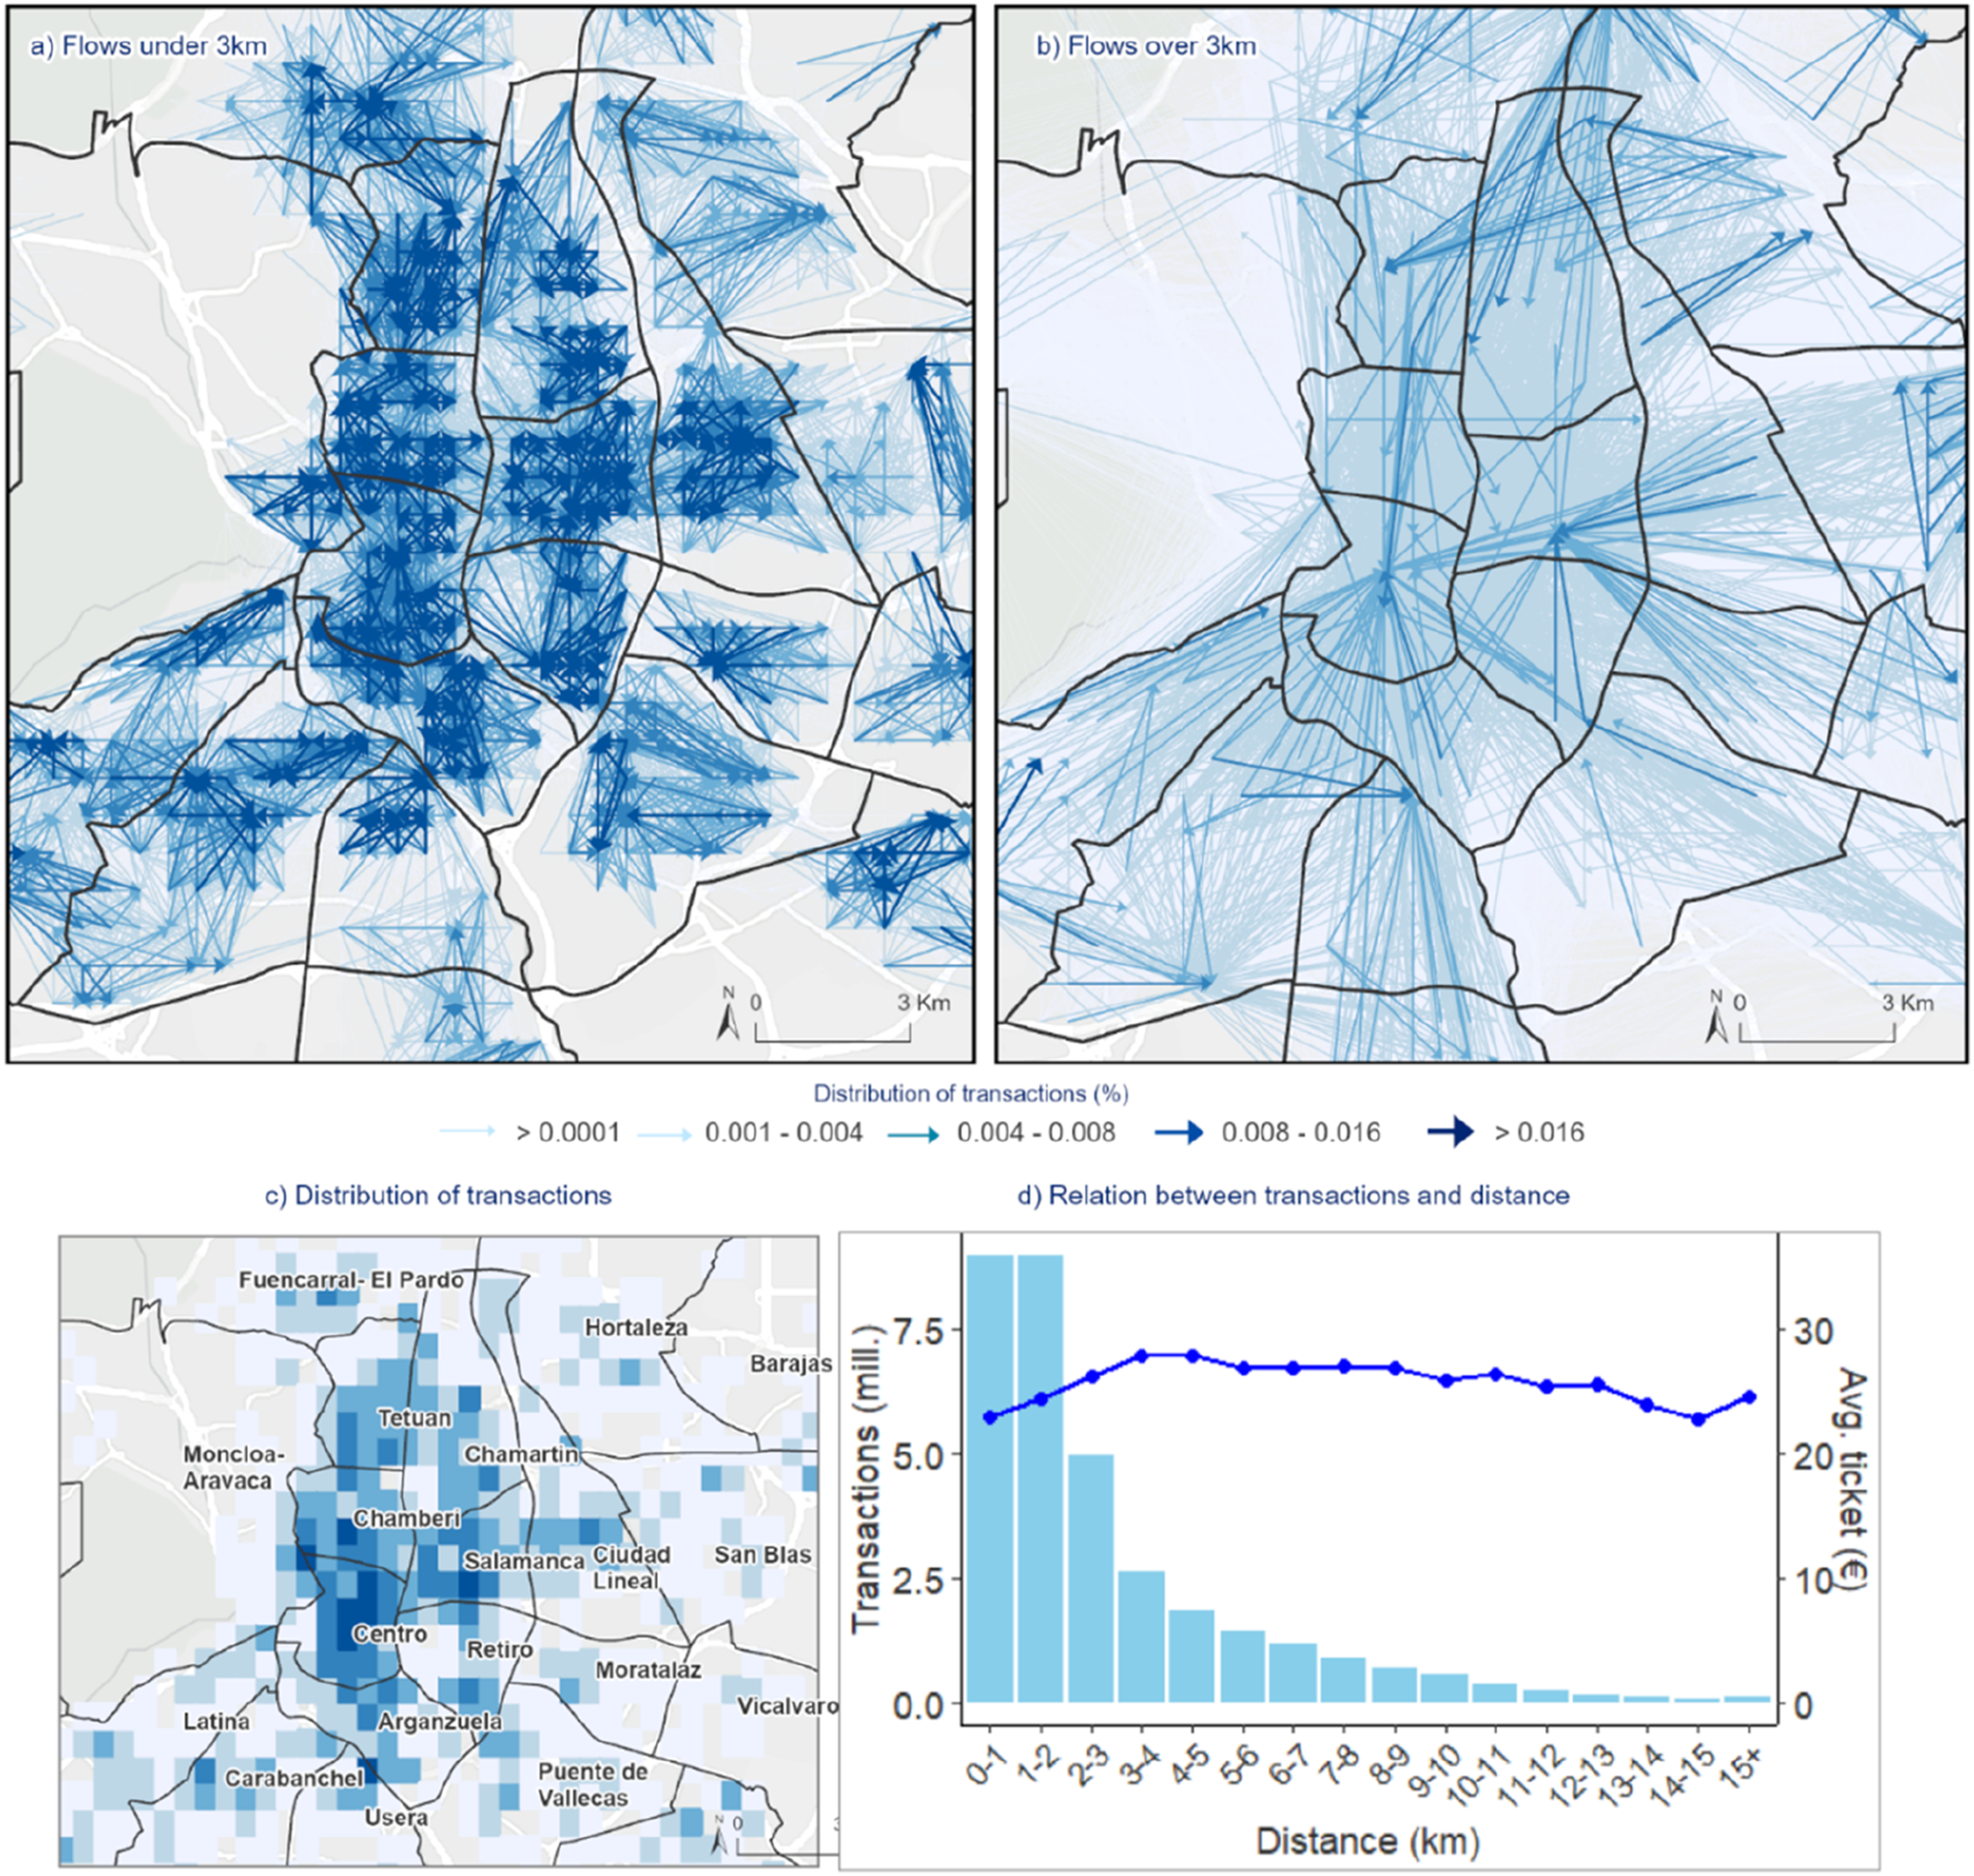
Each age group shows distinct spatial behaviors. Older adults concentrate more activity within 3 km (18% of connections, 84% of transactions), compared to 12% and 69% for aged 35–65, and 11% and 62% for those under 35 (Table S2). Average ticket size remains stable with distance for younger individuals, varies slightly for middle-aged adults, and increases notably for older adults (Figure 2). Origin–Destination matrix by groups. (a) Flows by age group; (b) By income.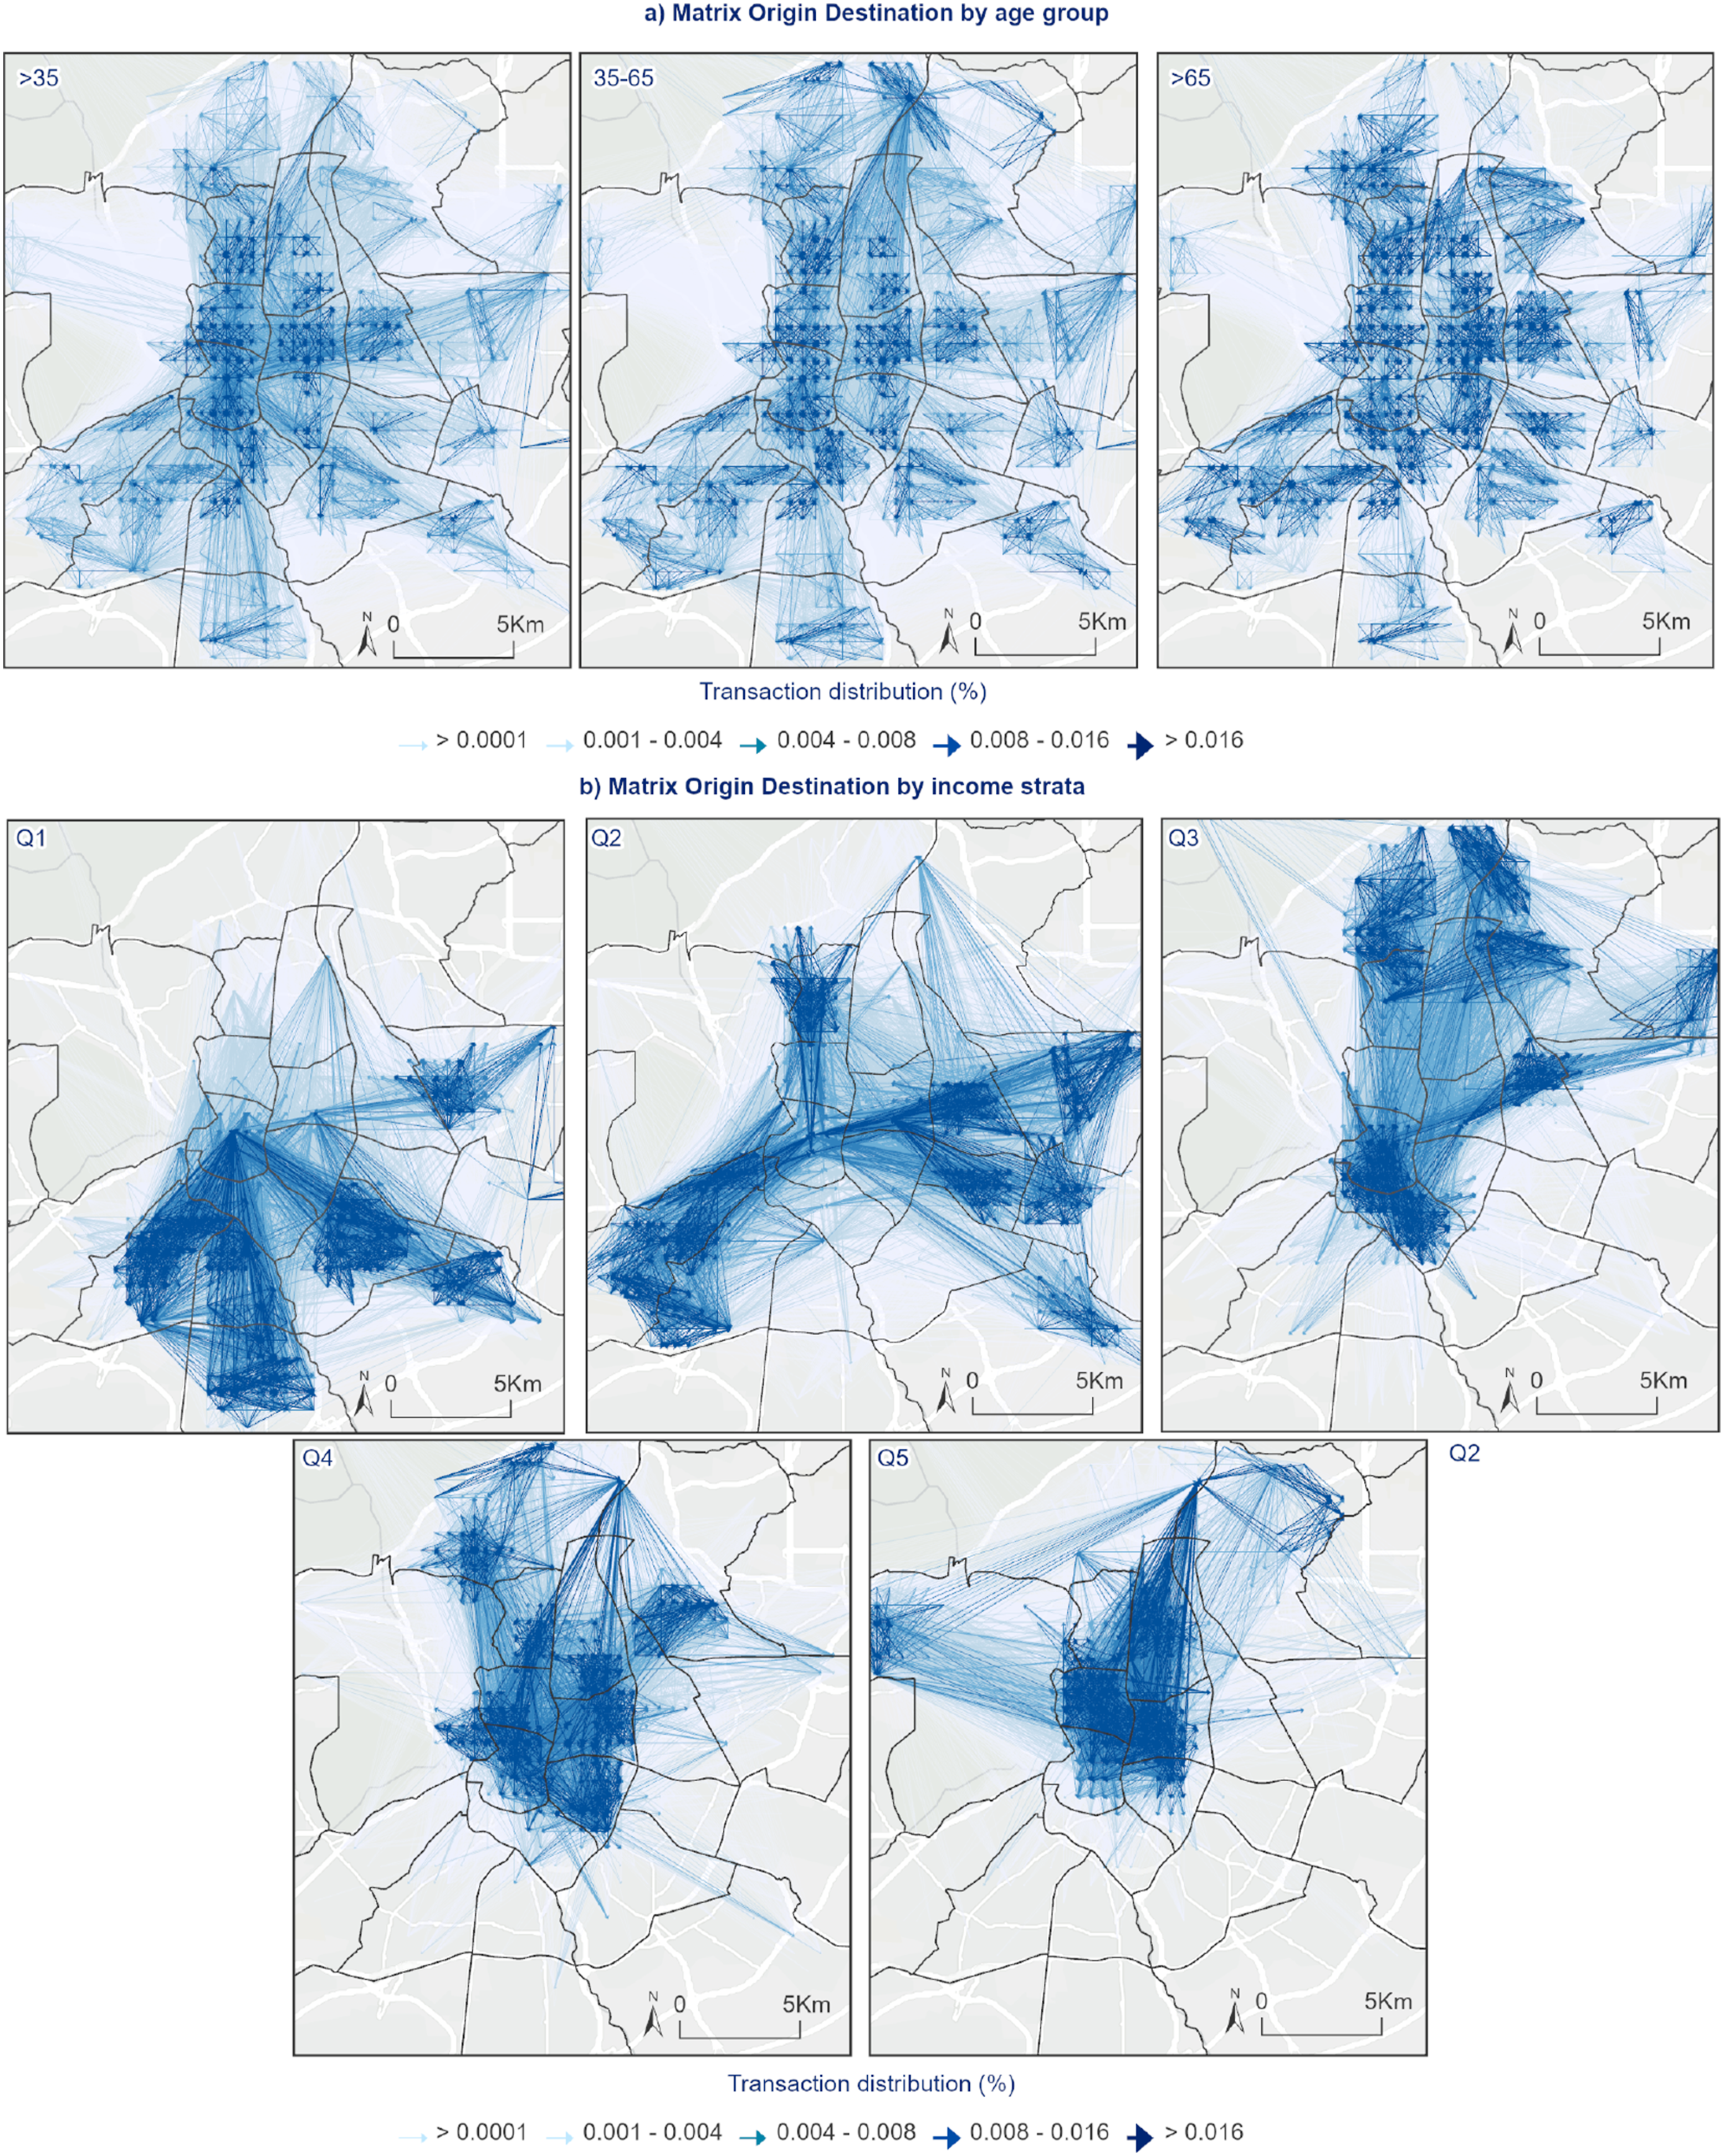
Income level also reflects spatial patterns. High-income groups (Q5–Q3) connect mainly in the affluent central-northern areas, while lower-income groups (Q2–Q1) connect both within their neighborhoods and in areas like the city center, Salamanca, and peripheral malls. Consequently, higher-income groups make over 13% of connections and 80% of transactions within 3 km, while middle- and lower-income groups travel further (Table S2). Ticket size generally increases with distance, especially among higher-income groups (Figure S2).
Centrality analysis
Centrality reflects the areas that concentrate the highest volumes of transactions and maintain connections with a larger number of other locations. Therefore, highly central areas can be considered consumption centralities, characterized by both high activity levels (more transactions) and a strong ability to attract consumers from across the city.
Using the classification from the Methods section, centrality scores were grouped to define a typology of consumption spaces. Primary centralities are found in the Centro and Salamanca districts, as well as in peripheral shopping centers. These are surrounded by secondary centralities, while tertiary ones are spread across all city districts (Figure 3). This distribution is closely related to the presence of bars, restaurants, and commercial areas (Figure S3). Centrality spaces. (a) Centrality values; (b) Classification by centrality types.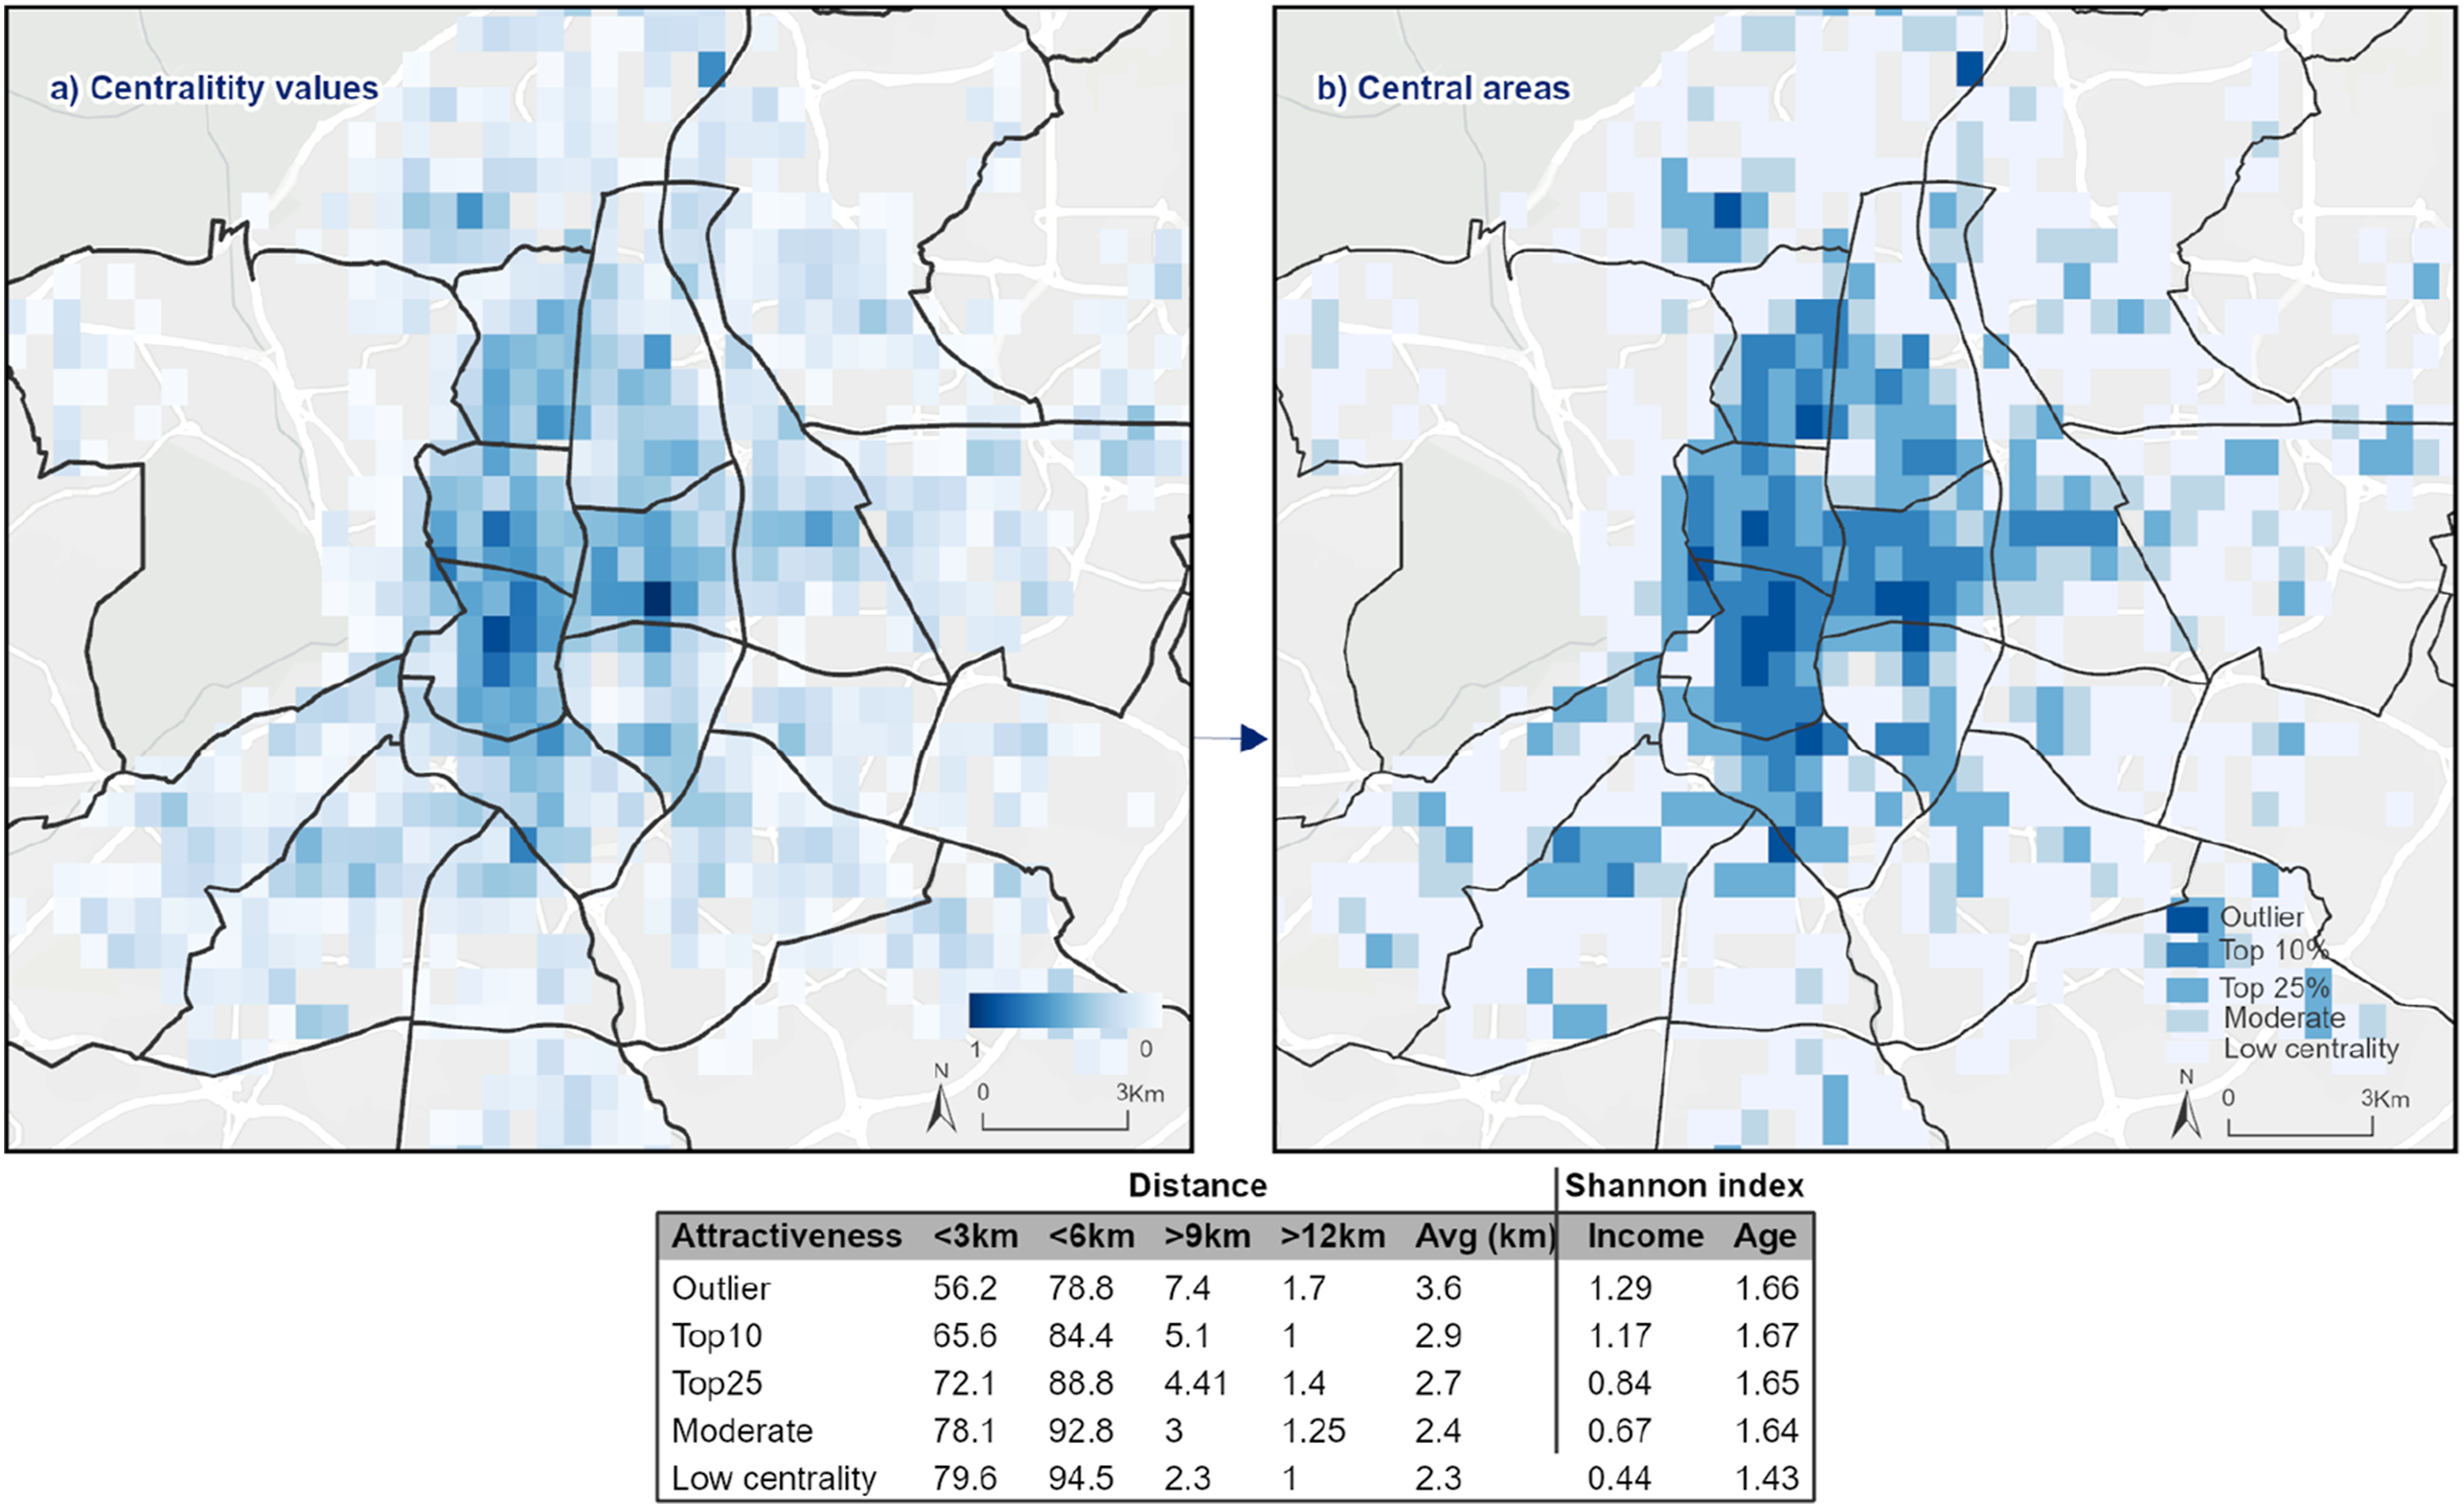
Centrality also relates to attractiveness, measured by the distance consumers are willing to travel or the social mixing (Figure 3). Low and moderate-central areas attract more nearby residents (79.1 and 78.1% within 3 km) compared to higher-order centralities (72.1%, 65.6%, and 56.2%, respectively), with shorter average travel distances (3.3 km vs 4.9 km in primary centralities).
Social mixing is highest in primary centralities, especially in terms of socioeconomic diversity (1.29 in primary ones vs 0.44 in low-centralities), revealing a clear center-periphery gradient. In contrast, age diversity is more evenly distributed across (Figure S4).
The spatial distribution of centrality varies by age (Figure 4). For younger individuals, primary centralities are concentrated in the city center (5.7% of cells), the 35–65 age group shows more secondary centralities (2.2%), and those over 65, primary centralities regain importance (4%) with wider city coverage. Centrality values correlate strongly with bars and commercial areas, particularly for young people (Figure S3). Centrality by population groups. (a) By age; (b) By income strata.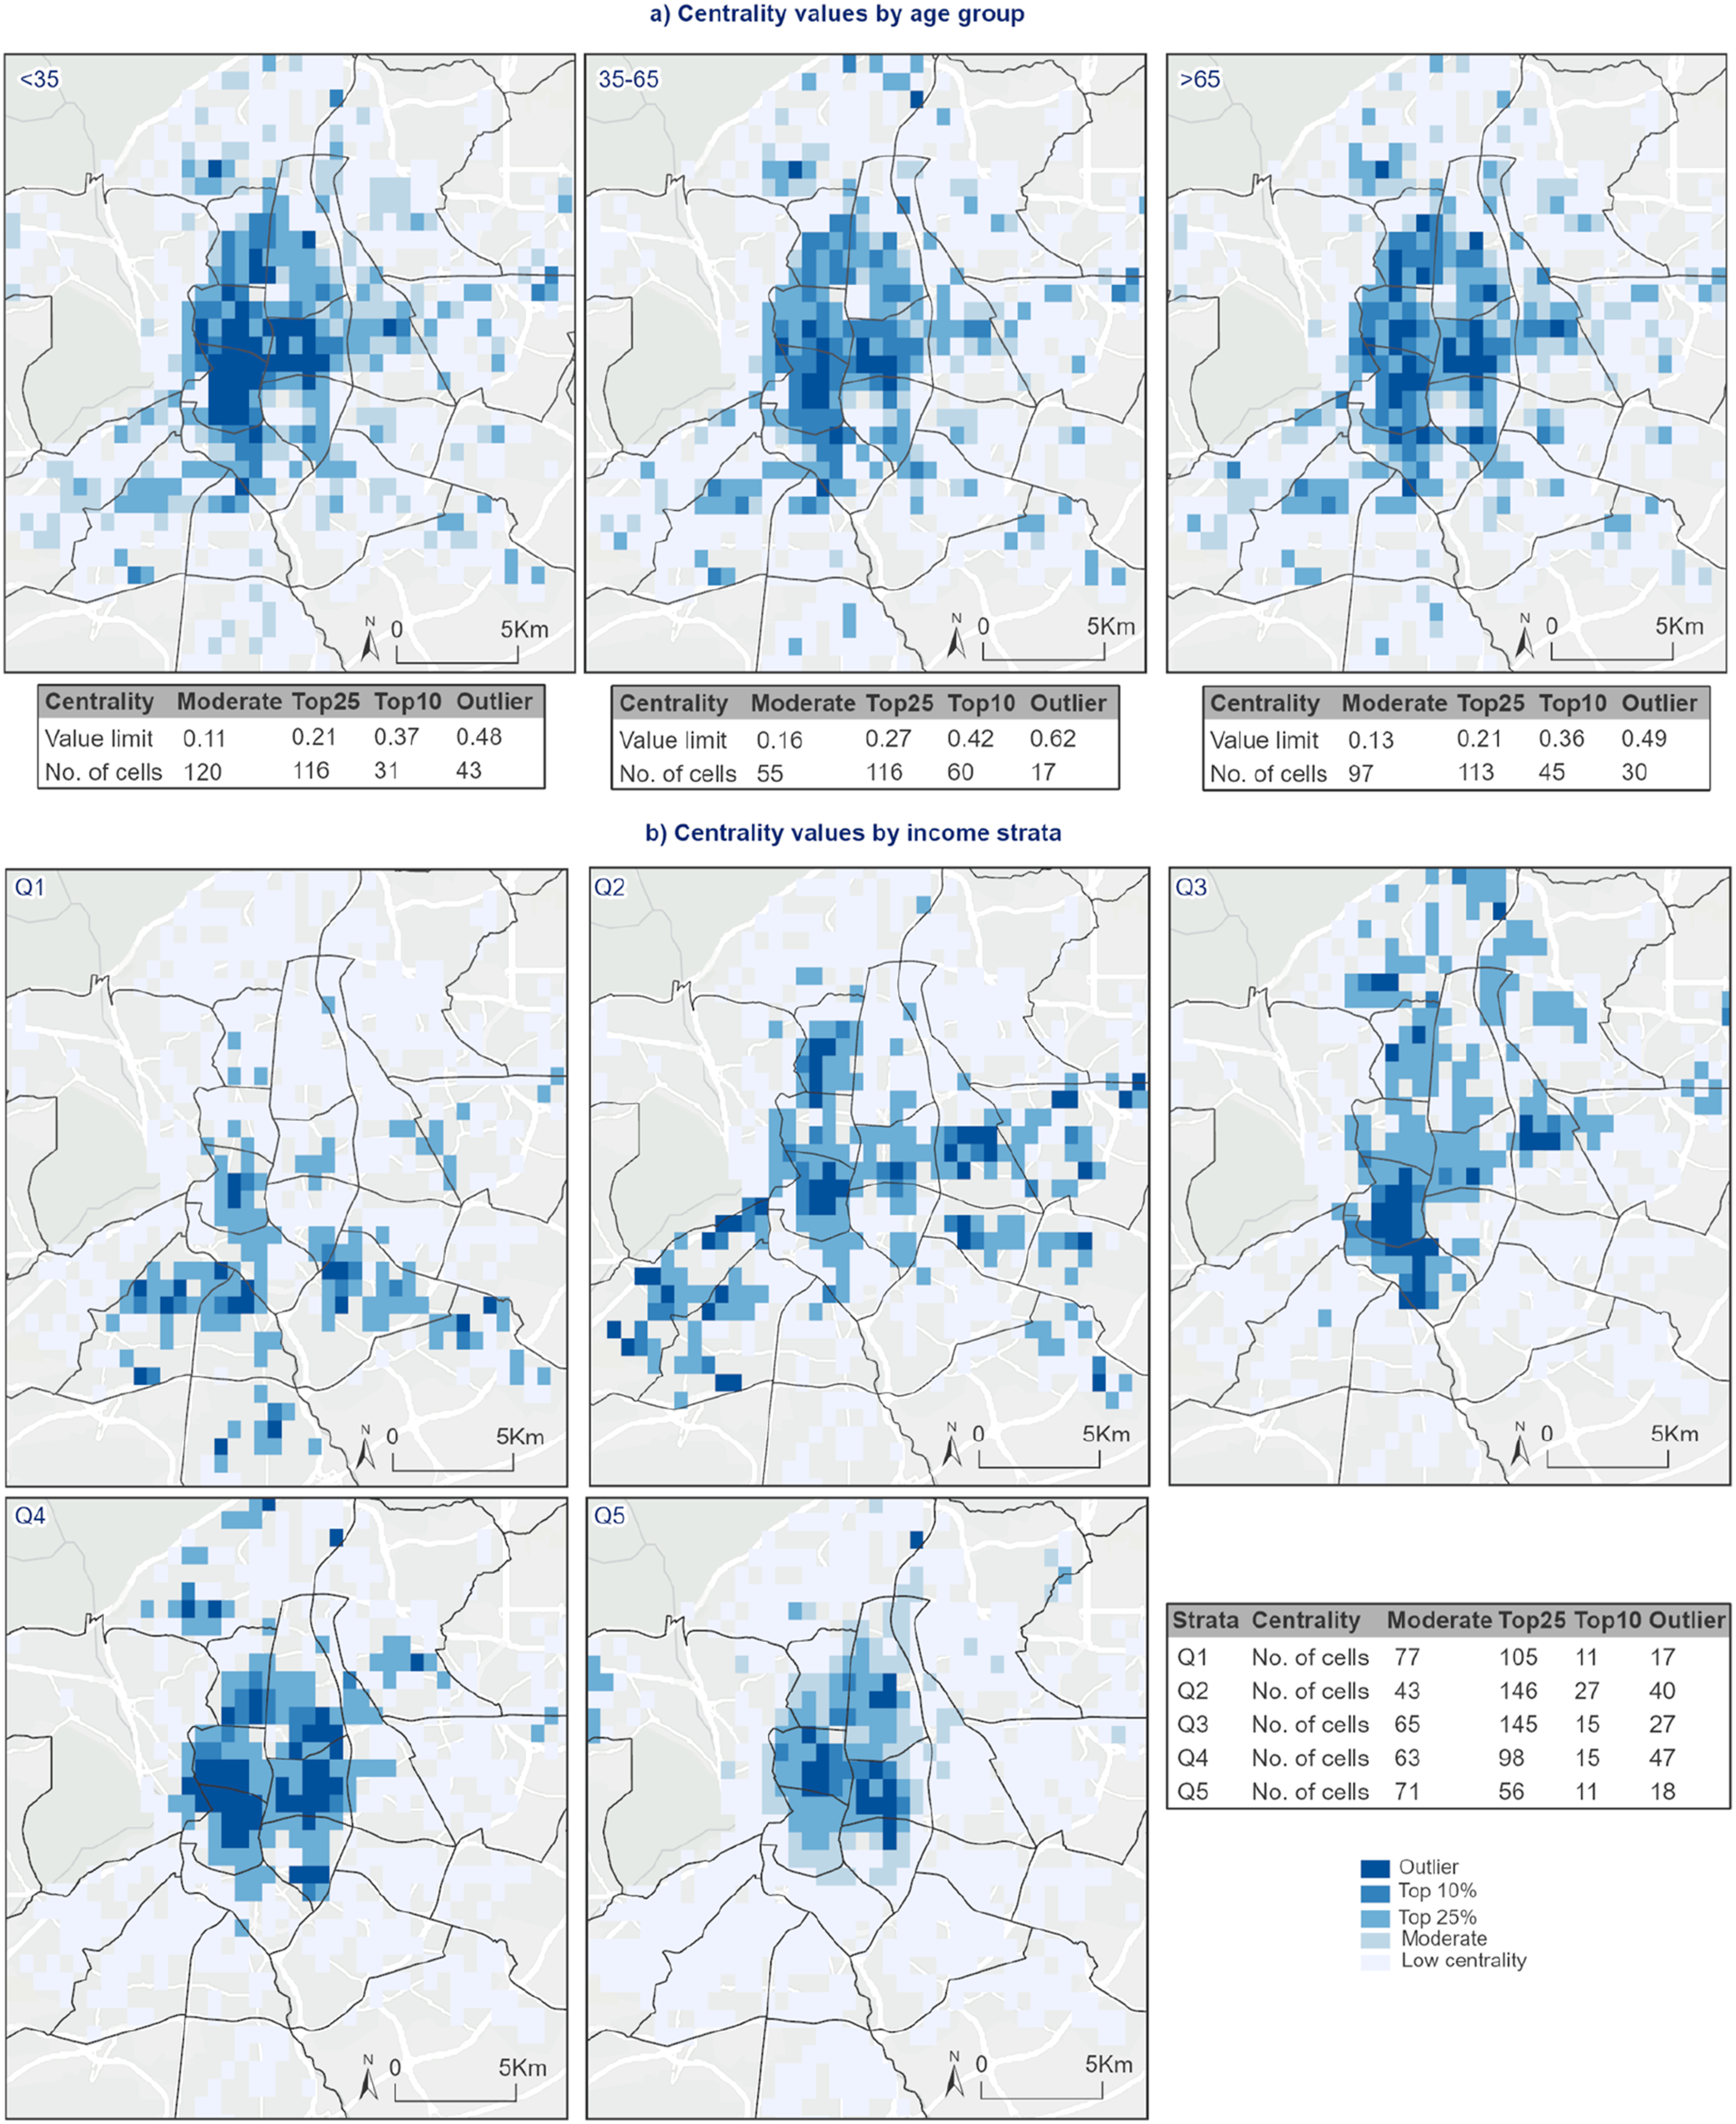
Income-based patterns also reveal differences (Figure 4). Both the highest- and lowest-income groups concentrate activity in primary centralities (2.8% and 2.7% of cells), while Q4 shows a more balanced distribution. Additionally, the geographic location of centralities differs between groups: high-income groups focus on affluent areas like Salamanca and Chamberí, while lower-income groups are more active in Centro and peripheral zones. The centrality values for the low and lower-middle income strata (Q1 and Q2) are those that show the lowest correlations with the presence of bars, restaurants, and shops, since their highest centrality values are distributed around the periphery of the city (Figure S3).
Detection of functional areas
The functional area analysis identifies 10 communities within Madrid, where internal connections are stronger than external ones. These areas show distinct behaviors based on centrality, social mix, and travel distance (Figure 5). Commercial functional areas.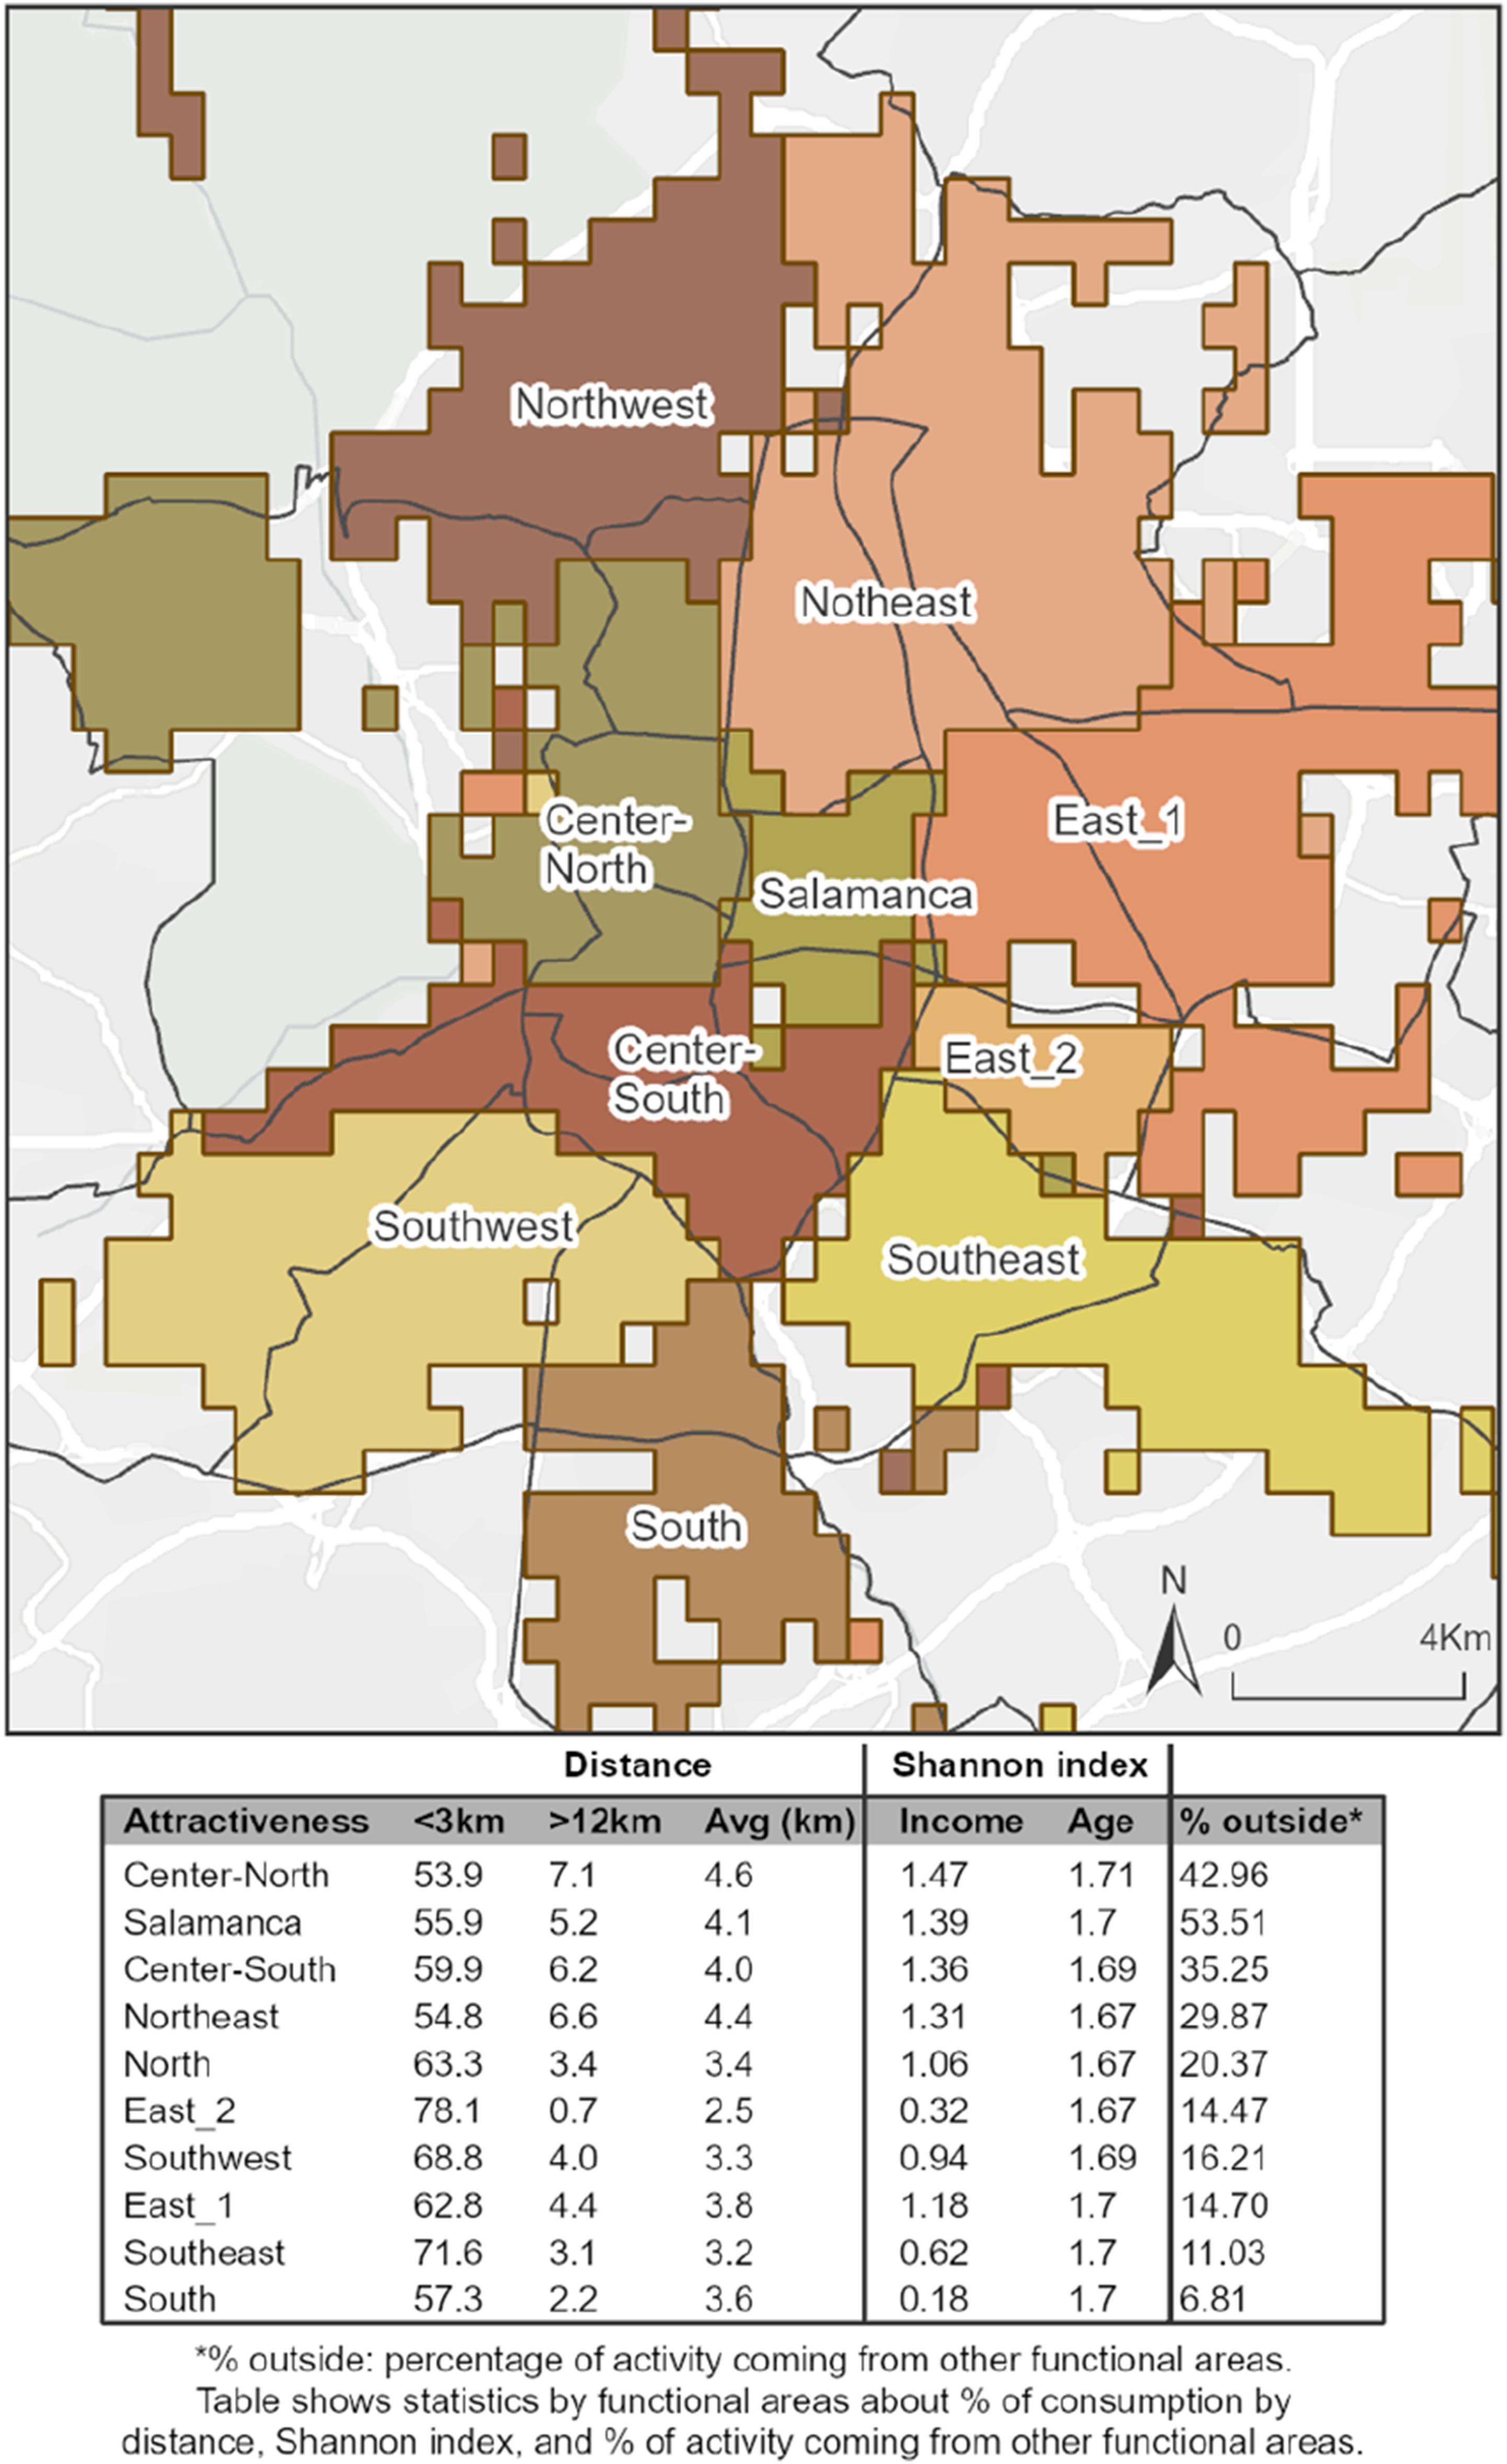
Functional areas with high centrality values like Center-North and Salamanca have a higher proportion of transactions conducted by consumers from other areas (42.96% and 53.51% of the transactions) and have longer average travel distances (∼1 km longer) than areas like East_2 (14.47%) or South (6.81%). They also show higher-income diversity (Shannon index 1.47 and 1.39 vs 0.32 and 0.18), while age diversity varies little across areas (Figure 5).
Age-related differences emerge in the delineation of functional areas, reflecting the distinct spatial behaviors (Figure 6). Particularly noteworthy is the variation in the number of functional areas detected for each age group: 6 functional areas for younger individuals, 8 for those aged 35 to 65, and up to 11 for individuals over 65. These results confirm that older adults have stronger local ties, while younger groups, with weaker local ties and broader connections, form larger and expansive zones. Functional areas by population group. (a) By age group; (b) By income strata.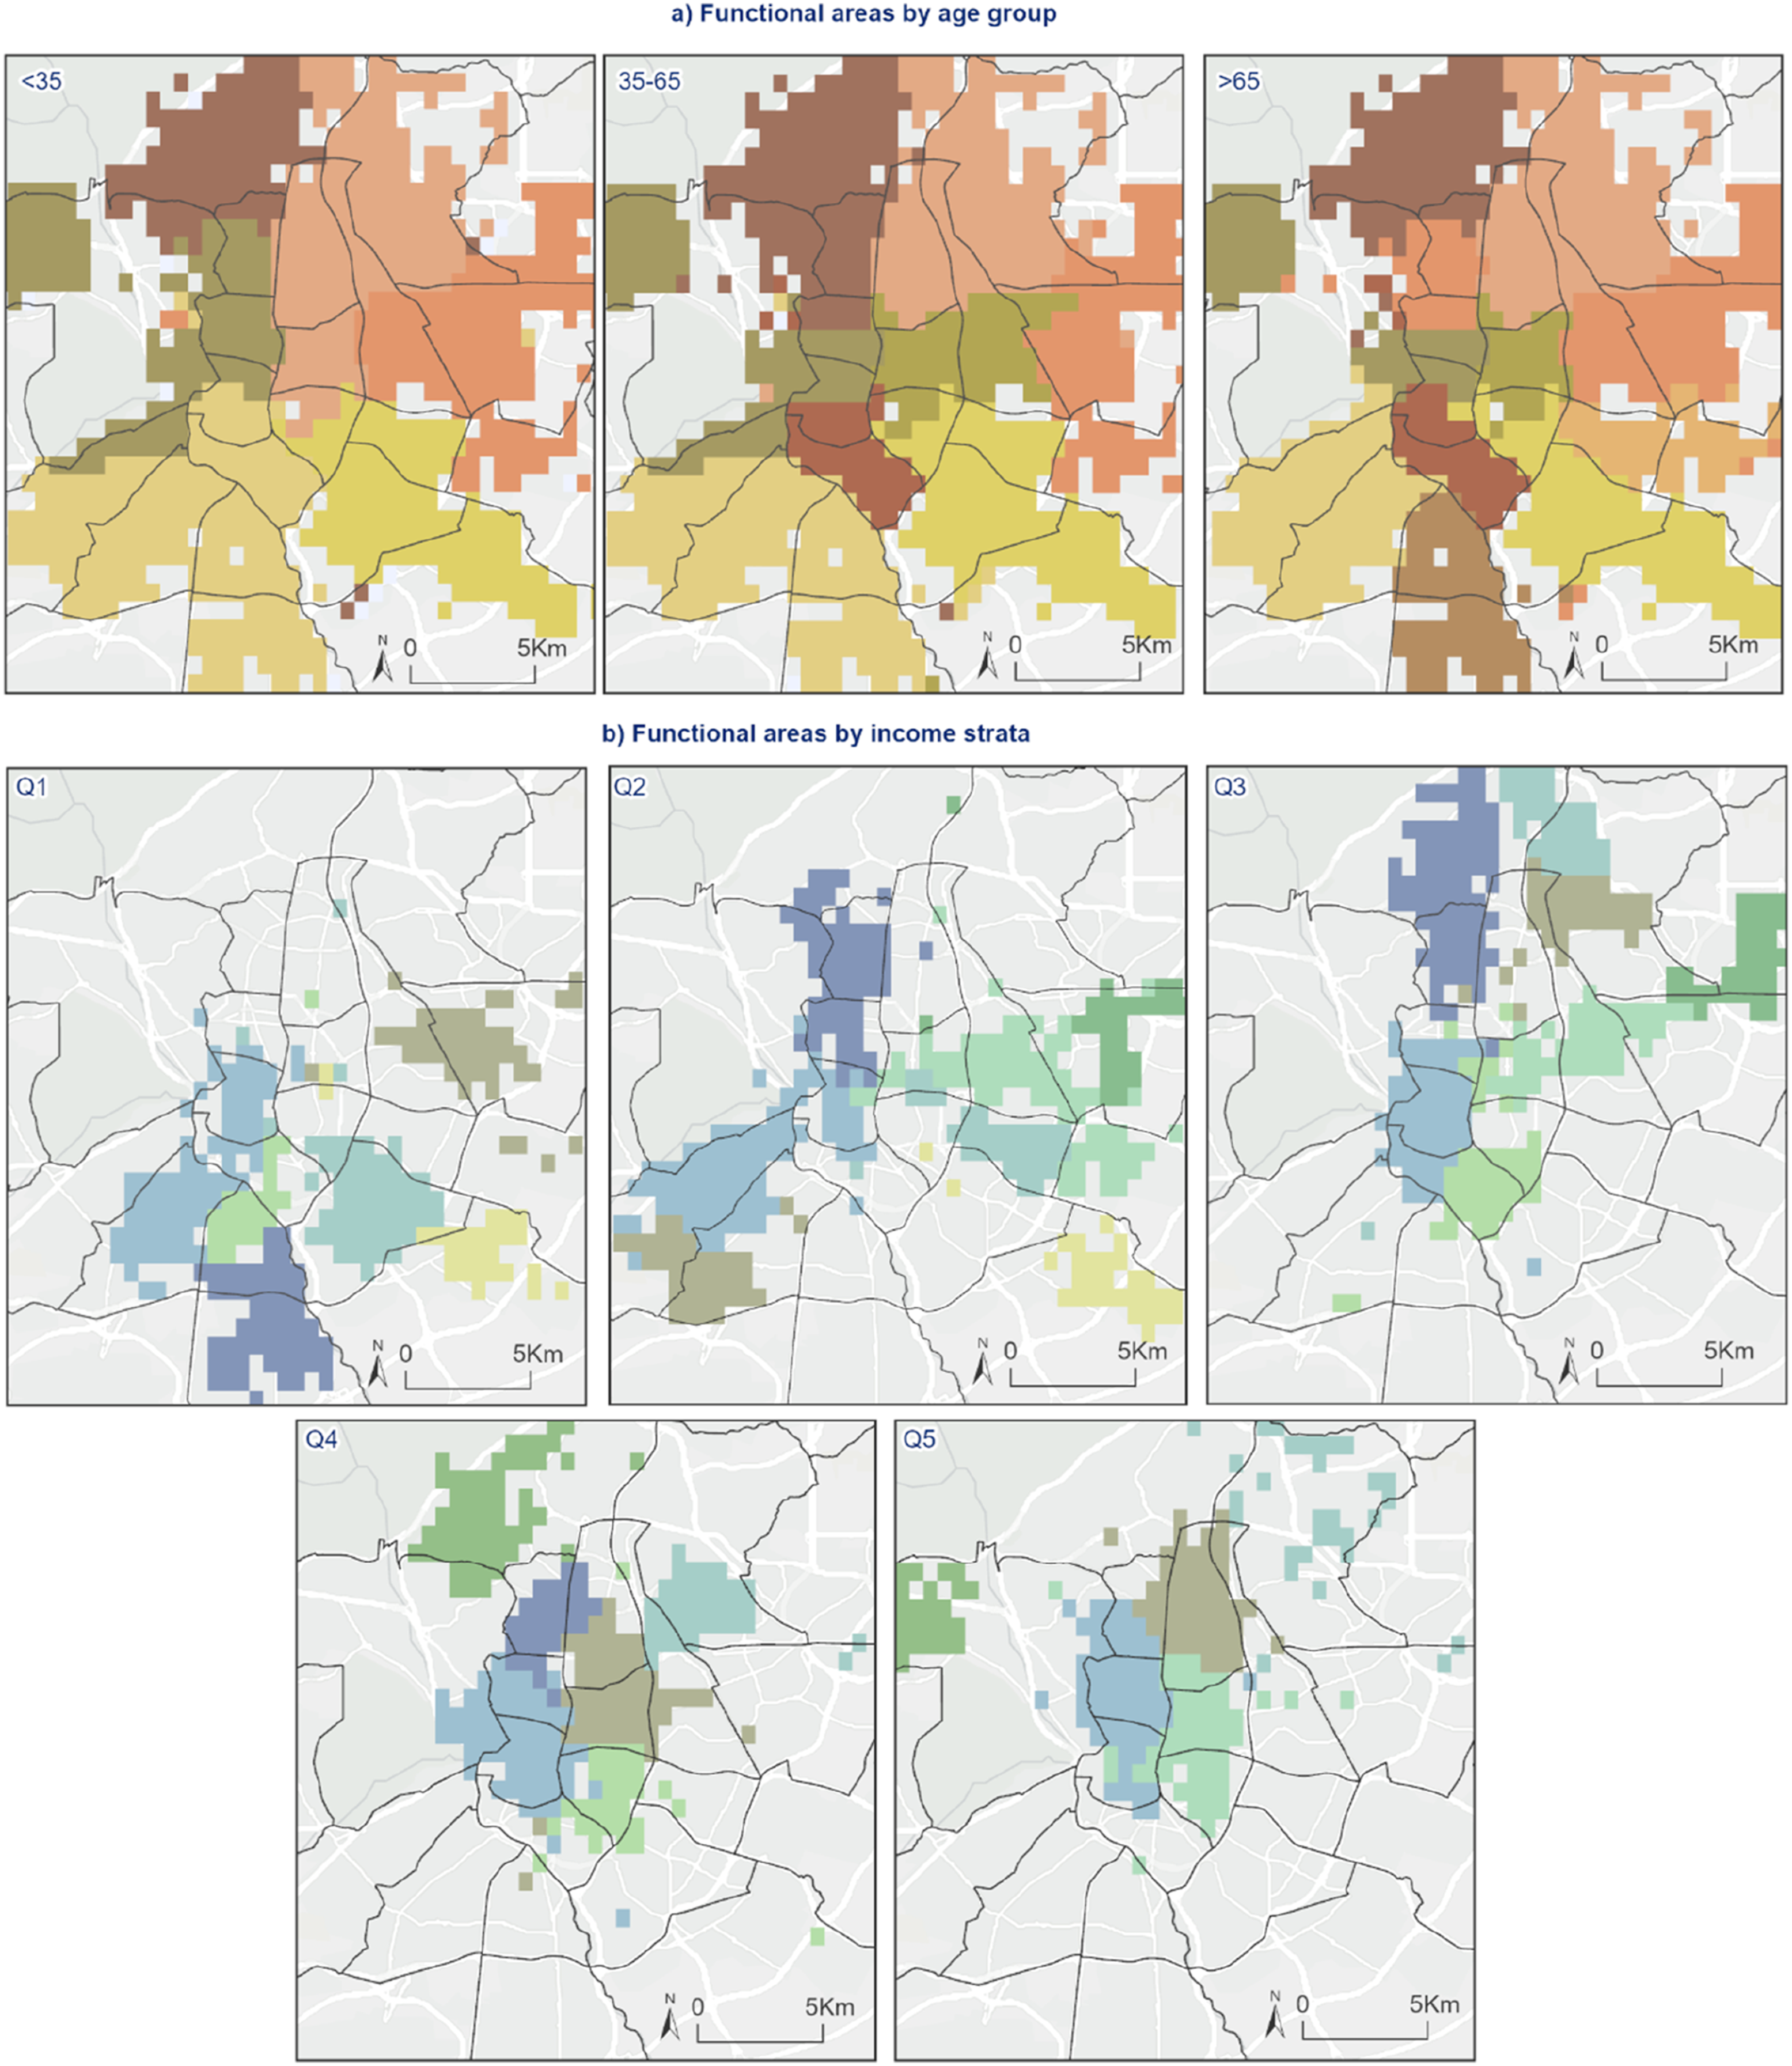
Income-based patterns do not appear uniformly across the city (Figure 6), largely conditioned by the residential distribution of income groups. High-income functional areas are concentrated in the central-northern sectors, low-income groups are mainly in the south while middle-income groups, with greater mobility, form functional areas spanning much of the city.
Discussion and conclusion
Traditionally, the study of consumption-related mobility has faced inherent difficulties due to the data sources used. Mobility surveys do not include a consumption category to classify trips by purpose, so it is necessary to use related categories such as shopping or leisure as proxies, which do not necessarily correspond to consumption. In recent years, mobility studies based on mobile phone data have proliferated, but it is well known that they have not been able to identify consumption-related mobility.
These limitations have been overcome with the use of data from bank card transaction records. This article, using a dataset that combines residential locations and consumption destinations (grid cells), enriched with socioeconomic information, examines mobility patterns associated with consumption across age and income groups. In addition, centrality areas were identified through both the number and strength of connections, and functional areas were delineated for each group.
Findings reveal the intensity of connections across the city, as well as the mobility and consumption radius for each group. Sociodemographic influences on travel distance have been well documented in relation to shopping (Bandara et al., 2022; Theodoridis and Priporas, 2009) and mobility in general (Luo et al., 2016; Xie et al., 2016). Nevertheless, further investigation was required to understand how these factors affect the evolving intra-urban commercial landscape.
Our results align with studies on general mobility using other data sources showing that travel distance decreases with age (Boschmann and Brady, 2013), likely due to fewer work-trips and reduced car usage (Newbold et al., 2005), favoring greater reliance on walking or public transportation. This latter pattern is also observed in Madrid, where older age groups tend to travel more frequently on walking (50% vs 25% among the 30–60 age group) and by public transport (25% vs 20%), indicating shorter travel distances (CRTM, 2019). A key insight is that this reduction in travel distance does not necessarily imply lower consumption activity, but rather a greater sensitivity to distance (Newbold et al., 2005). Indeed, do not usually use bank cards for small expenses, so their average ticket is higher, and have more intense interactions within their immediate surroundings (Figure 2, Table S1).
In contrast, existing findings on mobility differences by income are often contradictory (Xu et al., 2018). Xie et al. (2016) and Moya-Gómez et al. (2021) observed that higher-income groups tend to concentrate their movements in smaller areas, whereas Barbosa et al. (2021) found the opposite in Brazilian cities. Our analysis provides a more nuanced perspective, showing that urban context and spatial structure play a crucial role. Specifically, the lower urban sprawl typical of Mediterranean cities, combined with a dense public transport network, reduces car dependence and the effect of transport costs, unlike other contexts (Yang et al., 2023). This, along with longer work trips and greater distance from main urban centers for lower-to middle-income groups, explains why they travel farther on average than higher-income individuals, who tend to concentrate activities near their homes due to more selective habits (Macedo et al., 2022).
The study deepens understanding of the urban structure and area interconnections. The proposed centrality methodology (Opsahl et al., 2010) offers a broader view of centrality and consumer attraction. The findings align with previous research on Madrid’s urban dynamics (Carpio-Pinedo and Gutiérrez, 2020), and with other analyses of spending in Madrid, such as those by Carpio-Pinedo et al. (2022), De las Obras et al. (2025), or Aparicio et al. (2022), which show a high concentration of spending in the city center of Madrid. Moreover, recalling Christaller’s (1966) notion of spatial reach to distinguish different types of centrality. They also highlight the growing role of shopping malls as new centrality areas, especially for middle-aged groups, while reaffirming the importance of neighborhood-based commerce.
A key contribution is the analysis of centrality across population groups, showing distinct spatial behaviors and perceptions. Among younger groups, the concentration and intensity of central areas suggest a preference for commercially dense spaces with socio-symbolic value (Figure 4), reinforcing the role of space in consumption decision-making (Carpio-Pinedo and Gutiérrez, 2020). By contrast, the dispersed pattern observed among those aged 65 and older reflects convenience, potential mobility constraints, and stronger neighborhood ties.
Income groups analysis also reveals differences. First, there are centralities clearly tied to residential locations. Second, certain districts—such as Chamberí or Salamanca—are primarily frequented by affluent groups, whereas the Centro district functions as a shared space across income levels, underscoring its stronger attraction capacity and role as a hub for social interaction (Figure 4).
This latter aspect is especially relevant for urban planning. Segregation is increasingly measured not only in residential terms, but also through the spaces where daily activities take place (Loo et al., 2024), so promoting interaction in these areas can enhance diversity and social mixing. Understanding mobility patterns and the centrality distribution allows for more efficient transport planning and helps reinforce services in key areas or strengthen less central spaces, contributing to a more balanced urban development.
The study also has limitations, mainly related to the dataset. Our dataset does not cover all payments, as some are made in cash, not by card. This introduces a certain bias, since small expenses are frequently made in cash and may therefore be underrepresented. Credit card data present certain biases—such as an overrepresentation of the economically active population (Yoshimura et al., 2018)—so it is possible that some dynamics may not have been captured. Origin units are estimates based on population weights within each postal code. The lack of a temporal component prevents analysis across seasons, weeks, or days, limiting the study of temporal variability and of social mixing over time, not just space. More precise analysis would require information on trip purpose, its temporal sequence, and transport mode.
Future research could explore drivers of consumption-related mobility behaviors, which is key for policy design. Analyzing the temporal dimension of these patterns and their relation to urban actors like tourism would also be valuable. Given the growing demographic and economic weight of older adults, further disaggregation of this group could provide important insights. Additional promising avenues include deeper study of activity-based segregation and its urban implications. Finally, replicating the study in cities of different sizes and contexts, including the wider metropolitan area, would offer useful comparative evidence, especially regarding socioeconomic differences.
Supplemental material
Supplemental material - Intra-urban consumption flows and sociospatial disparities: An analysis based on bank card transaction data
Supplemental material for Intra-urban consumption flows and sociospatial disparities: An analysis based on bank card transaction data by Julia de las Obras-Loscertales, Juan Carlos García-Palomares, Diego Ramiro-Fariñas, María Soledad Hernández Martín-Caro, Javier Gutiérrez in Environment and Planning B: Urban Analytics and City Science.
Footnotes
Acknowledgments
This article has been developed as part of a research contract between Madrid City Council and the Complutense University of Madrid, entitled “Support service for the statistical exploitation and analysis of spending in the city of Madrid,” with number 511/2023/10901. This article was supported by Grant TourMobility (PID2021-127499OB-I00) and Grant DynCity (PID2023-148339OB-I00) funded by MICIU/AEI/10.13039/501100011033/and by “European Union FEDER and FSE+.” We are also grateful to the FPU Program (University Teacher Training) of the Spanish Ministry of Universities (FPU21/04291).
Author contribution
Julia de las Obras-Loscertales: Writing—original draft, visualization, software, methodology, formal analysis, and conceptualization. Juan Carlos García-Palomares: Writing—original draft, supervision, methodology, funding acquisition, formal analysis, and conceptualization. Diego Ramiro-Fariñas: Writing—original draft, supervision, methodology, and conceptualization. María Soledad Hernández Martín-Caro: Resources, methodology, and funding acquisition. Javier Gutiérrez: Writing—original draft, supervision, methodology, funding acquisition, formal analysis, and conceptualization.
Funding
The authors disclosed receipt of the following financial support for the research, authorship, and/or publication of this article: as part of a research contract between Madrid City Council and the Complutense University of Madrid, entitled “Support service for the statistical exploitation and analysis of spending in the city of Madrid,” with number 511/2023/10901, and by FPU Program (University Teacher Training) of the Spanish Ministry of Universities (FPU21/04291). Also, was supported by Grant TourMobility (PID2021-127499OB-I00) and Grant DynCity (PID2023-148339OB-I00) funded by MICIU/AEI/10.13039/501100011033/ and by “European Union FEDER and FSE+”
Declaration of conflicting interests
The authors declared no potential conflicts of interest with respect to the research, authorship, and/or publication of this article.
Data Availability Statement
The data used in this study cannot be made openly available because the use of the data is restricted due to privacy concerns.
Supplemental material
Supplemental material for this article is available online.
Note
Author biographies
References
Supplementary Material
Please find the following supplemental material available below.
For Open Access articles published under a Creative Commons License, all supplemental material carries the same license as the article it is associated with.
For non-Open Access articles published, all supplemental material carries a non-exclusive license, and permission requests for re-use of supplemental material or any part of supplemental material shall be sent directly to the copyright owner as specified in the copyright notice associated with the article.