
Abstract
Internally displaced people (IDPs) who fled conflict zones in Donetsk and Luhansk beginning in 2013 relocated to other cities in Ukraine. Their Russian-language preference can be quantitatively and qualitatively observed and measured in the urban textual environment, or linguistic landscape (LL) of Kyiv, the bilingual Ukrainian capital. This study examines the LL at a city-wide scale, leveraging Google Street View imagery with deep learning text detection, recognition, and script identification, alongside geospatial tools for large-scale analysis. The approach enables systematic, reproducible mapping of machine-detectable public-facing signage along road networks, supporting analysis of spatial and temporal associations between population relocation and LL change. Analyses at the administrative and road network levels reveal differing language preferences between primary and residential roads. Results indicate clustering of the Russian keyword ‘аренда’ (rent) near IDP relocation sites during the relocation period and an observable increase in Ukrainian-language preference after the implementation of the 2019 language policy.
Introduction
Beginning in November of 2013, the first wave of internally displaced people (hereafter IDPs) left Donetsk and Luhansk for other regions of Ukraine. By May 27, 2015, 93,760 IDPs were residing in Kyiv (UNHCR & Ministry of Social Policy of Ukraine, 2015). By 2018, there were 160,287 registered in Kyiv, though the actual figure was likely much higher due to the large number of unregistered individuals and families (Kabanets, 2019). While government efforts to assist IDPs included hotlines and limited financial support, the vast majority of these Russian-speaking IDPs paid for their own rentals in the Left Bank districts of Kyiv, areas dominated by Soviet-era housing blocks. These neighbourhoods offered rents 20%–40% lower than in other parts of the city (Deutsche Welle, 2016). Further, transport accessibility and municipal placement policies also played a key role in shaping the residential geography of IDPs in Kyiv. This shift raises important questions about how the arrival of large numbers of IDPs affected the linguistic and population composition of Kyiv’s urban landscape, particularly in relation to evolving language policies.
This influx introduces complex dynamics into national identity, language rights, and social cohesion (Bilaniuk, 2005), which were further intensified by the February 2014 post-Maidan political and cultural events, including reforms aimed at promoting the Ukrainian language over Russian (Zalizniak et al., 2020). As a result, the Kyiv linguistic landscape (hereafter LL) has become a reflection of contested identities and institutional restructuring. This movement of IDPs has often resulted in significant demographic, socio-economic, and spatial transformations, reshaping the linguistic, cultural, and infrastructural landscapes of urban areas, particularly when large populations relocate within a short timeframe (Crisp et al., 2012; Zetter and Deikun, 2010).
While existing studies have examined displacement at national or regional levels (Böcker and Hunter, 2025; Okon, 2018; Oucho, 2005), far less attention has been paid to the spatial and linguistic implications of IDP inflows at the intra-urban scale in post-Soviet urban contexts. In particular, the settlement of Russian-speaking IDPs in lower-income, peripheral areas of Kyiv have introduced new patterns of spatial and linguistic differentiation, which are often overlooked in research relying primarily on survey data alone. Although surveys have played a foundational role in LL research, they are difficult to scale up to large geographic areas and often cannot be repeated at high temporal frequency or during times of conflict. Consequently, they offer limited capacity to monitor fine-grained, city-wide, and temporally dynamic urban transformations driven by mass displacement.
Understanding how such population movements influence the public visibility of language (i.e., the LL) in cities may offer valuable insights into broader questions of identity, policy, and integration. The presence or absence of specific languages in advertising, signage, public service announcements, public communication, and institutional discourse can reflect shifting cultural hierarchies and community affiliations (Landry & Bourhis, 1997). Examining the LL within post-displacement urban contexts therefore provides a means of observing how language visibility responses to sudden and large-scale population changes. Informed of recent technological advances, this study examines the LL of Kyiv at a city-wide scale, building on calls for data-driven approaches to understanding cultural identity, social dynamics, and policy implications (Kim, 2025). By combining scalable computer vision techniques with geospatial analysis, the study provides spatially explicit evidence of how displacement and policy reforms have reshaped the LL of Kyiv evidenced by temporal changes occurring between 2011 and 2021, linking shifts in language visibility to the settlement of internally displaced persons during the implementation of evolving language policies. Using scene text data from street view imagery (SVI) as a scalable, low-cost approach, it demonstrates how settlement patterns interact with language policy at the urban scale. The overarching aim is to assess how internal displacement has transformed Kyiv’s LL with a particular focus on the spatial visibility of Ukrainian and Russian. To address this goal, the study pursues three interrelated objectives: (1) To analyse how population changes at IDP relocation sites correspond with shifts in the LL across Kyiv between 2011 and 2021. (2) To quantify and visualize these changes using computer vision and geospatial techniques. (3) To evaluate how temporal and spatial trends are associated with IDP settlement patterns, road network type, administrative unit, and the implementation of language policy.
Related work
This section reviews the relevant literature, moving from socio-political to methodological and spatial contexts. It begins with language policy in Ukraine, which shapes the visibility and distribution of languages in public space. LL research is then reviewed, highlighting limitations of current sampling approaches. Street view imagery (SVI) is introduced as a scalable data source, followed by methods for text detection, recognition, and script identification to extract and classify LL features. Finally, network space is discussed to situate LL observations within urban hierarchies that influence language visibility and power. Since its 1991 independence, Ukraine’s language policy has legislated to consolidate the use of Ukrainian as the only state language. The 1989 Law of Languages in the SSR (VR No. 8313-11) established Ukrainian as the state language while giving Russian a special status as Soviet lingua franca (§35, §38). The 1996 constitution affirmed this status for Russian (Arel, 1995), and the European Charter on Regional of Minority Languages (VR No. 802-iv/2003) protected minority languages (Russian not included). After the Orange Revolution, cracks widened where pro-Russian elements from eastern regions threatened separation (Kulyk, 2009). In 2012, a new language law (VR 5029-vi/2012) gave regional rights where speaker populations exceeded 10%, but the Kravchuk amendment raised it to 30% (Csernicskó and Fedinec, 2016). After the 2014 Revolution of Dignity and repeal of LL2012, the Decommunization Laws (VR No. 314-317-VIII/2015), Education Law (VR No. 38-9, §380/2017) and Media Quotas laws (VR No. 5313/2016-7) renamed streets, razed monuments, changed K-12 language of instruction, and rolled out quotas for Ukrainian-language usage. However, it was the 2019 State Language Law (VR No. §20-38/2019) that mandated Ukrainian in public space, including outdoor advertising, banners, storefronts, signage, and other tokens of LL. Further Ukrainian laws were passed after February 24, 2022.
Understanding conflict is arguably the original telos for studying the LL. Language is inextricably bound to social conflict, according to Shohamy (2006). While language policy may explicitly articulate the provisions of such a conflict, ‘the presence (or absence) of language displays in the public space communicates a message, intentional or not, conscious or not, that affects, manipulates or imposes de facto language policy and practice’ (Shohamy, 2006: 111), especially upon identities of linguistic groups relative to power dynamics (Gorter, 2013). In the Ukraine context, where Ukrainian is the only official state language, the process of de-Russification becomes synonymous with resistance, political healing, cultural identity, and removing itself symbolically from its former imperial master. Such conflicts, though, are vast and complex. In LL studies, limited sizes and spatial resolutions may oversimplify the LL reality (Pavlenko, 2009) For example, L’nyavskiy’s (2022) diachronic study of Kyiv and other cities relied on aggregated LL data, while Shakh’s (2010) study of Kyiv aggregated two locations per city: the centre and periphery. Scaling up LL data collection could potentially introduce levels of temporal, relational, and spatial granularity the remain largely inaccessible in city-level LL studies based on aggregated location data.
A promising direction in urban studies is the use of SVI in combination with computer vision and machine learning to extract information from large volumes of visual data and transform imagery into structured information (Crooks and See, 2022: 774). LL researchers have used SVI as a data source, but paired with advances in computer vision, it can support automated detection and classification of linguistic features at unprecedented scales, opening new possibilities for understanding spatial and temporal dynamics in the LL (Gilles and Zeigler, 2019; He et al., 2023; Hong, 2020, 2023; Kim, 2025; Voss, 2024). In this vision-based approach, text detection constitutes the foundational step in constructing the quantitative LL dataset. When a text detection algorithm identifies a line of text within a street view image, it generates a bounding box, referred to here as a region candidate box, with multiple such boxes often detected within a single image. Each bounding box represents a discrete instance of visible text and serves as the elemental unit of analysis, defined as a block in the Google Vision framework. This definition aligns with Backhaus (2006) characterization of an LL unit as ‘any piece of written text within a spatially definable frame’, and Pavlenko (2009) survey.
Previous studies have adopted this unit of analysis to examine spatial distributions of keywords (Gilles and Zeigler, 2019), refine detection outputs into word counts and native-language ratios (He et al., 2024), and explore relationships between linguistic patterns and population segregation through advanced spatial methods (Hong, 2023; Kim, 2025). While sign prominence can be approximated using pixel-based size metrics (He et al., 2023), reliable automated classification of sign types, such as shop signage, banners, advertisements, or public notices, remains an open methodological challenge and is therefore beyond the scope of this study.
While remarkably faster than human detection, vision-based LL methods still face technical challenges. Document OCR is a largely solved problem (Ye and Doermann, 2015), but scene text detection and recognition still remain active areas of research, with detection accuracy rates 60%–80% (Hong, 2020). Multilingual scene text presents additional challenges, including scene complexity, uneven lighting, blurring, degradation, aspect ratio distortion, font variation, and multilingual environments (Naosekpam and Sahu, 2022; Ye and Doermann, 2015). Some scripts introduce further complexity due to their higher average number of nodes and strokes (Hong, 2020). To date, the highest benchmark detection accuracies reported on datasets from the International Conference on Document Analysis and Recognition (ICDAR) have been achieved for Latin- and Cyrillic-based scripts (Gunna et al., 2021). While some script identification models report accuracies as high as 98.30% (Ghosh et al., 2022), distinguishing between closely related languages remains problematic in practice. Russian and Ukrainian both use the 33-letter Cyrillic alphabet, differing by only four characters unique to Ukrainian (ґ, є, і, ї) and four unique to Russian (ё, ъ, ы, э), with a lexical overlap of 62%. As a result, automated script or language identification alone is insufficient for robust language attribution, necessitating targeted human validation procedures, and highlighting that detected linguistic tokens are inherently shaped by the spatial contexts in which they are encountered.
LLs are shaped by the networks on which they are observed: roads, pedestrian paths, squares, and other linear features (Baddeley et al., 2021). Geographically and topologically speaking, the LL is a process occurring in non-Euclidean space, that is, network space. When comparing distances, Euclidean distance can be much shorter than the actual distance in network space (Gelb, 2021). This difference is dictated by physical and legal constraints, including property laws, public–private access distinctions, and the social hierarchies embedded in urban design.
Urban road hierarchies categorize networks according to function and capacity, typically distinguishing between primary, secondary, tertiary, and residential roads. While originally designed to accommodate vehicular movement, these hierarchies also encode social distinctions: high- versus low-traffic volumes, fast versus slow movement, commercial versus residential use, and public versus private space. Linguistic conflict often emerges along this hierarchy, as high-capacity and commercially prominent spaces tend to display dominant or global languages, reflecting disparities between top-down language policies and bottom-up linguistic practices, while residential and side streets retain local or regional varieties for longer periods (Shohamy and Gorter, 2009). Both Hong (2023) and He (2024) included residential and non-residential classifications in their LL indicators. The power and agency of each language depends on not only its functional role but also its spatio-relational positioning within a city’s road network.
Methodology
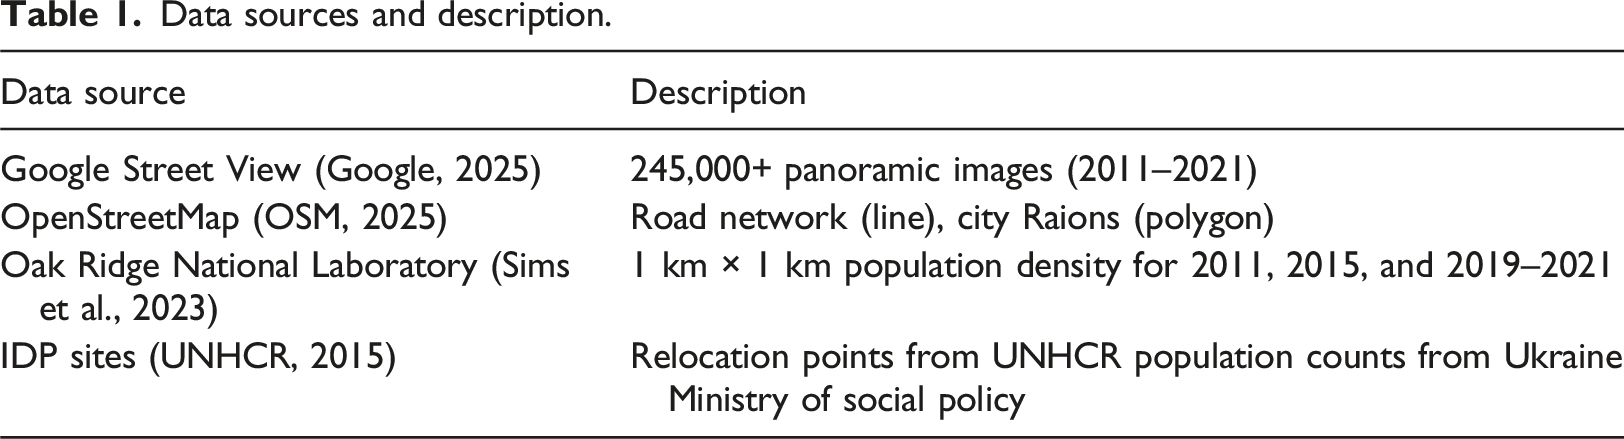
Figure 1 presents an overview of the four-stage methodological workflow adopted in this study, while Table 1 summarizes the data sources used and their key characteristics. The methodology follows a four-stage framework consisting of (1) imagery acquisition, (2) text detection and extraction, (3) spatial pre-processing and data integration, and (4) spatio-temporal analysis and validation. Overview of methodology. Data sources and description.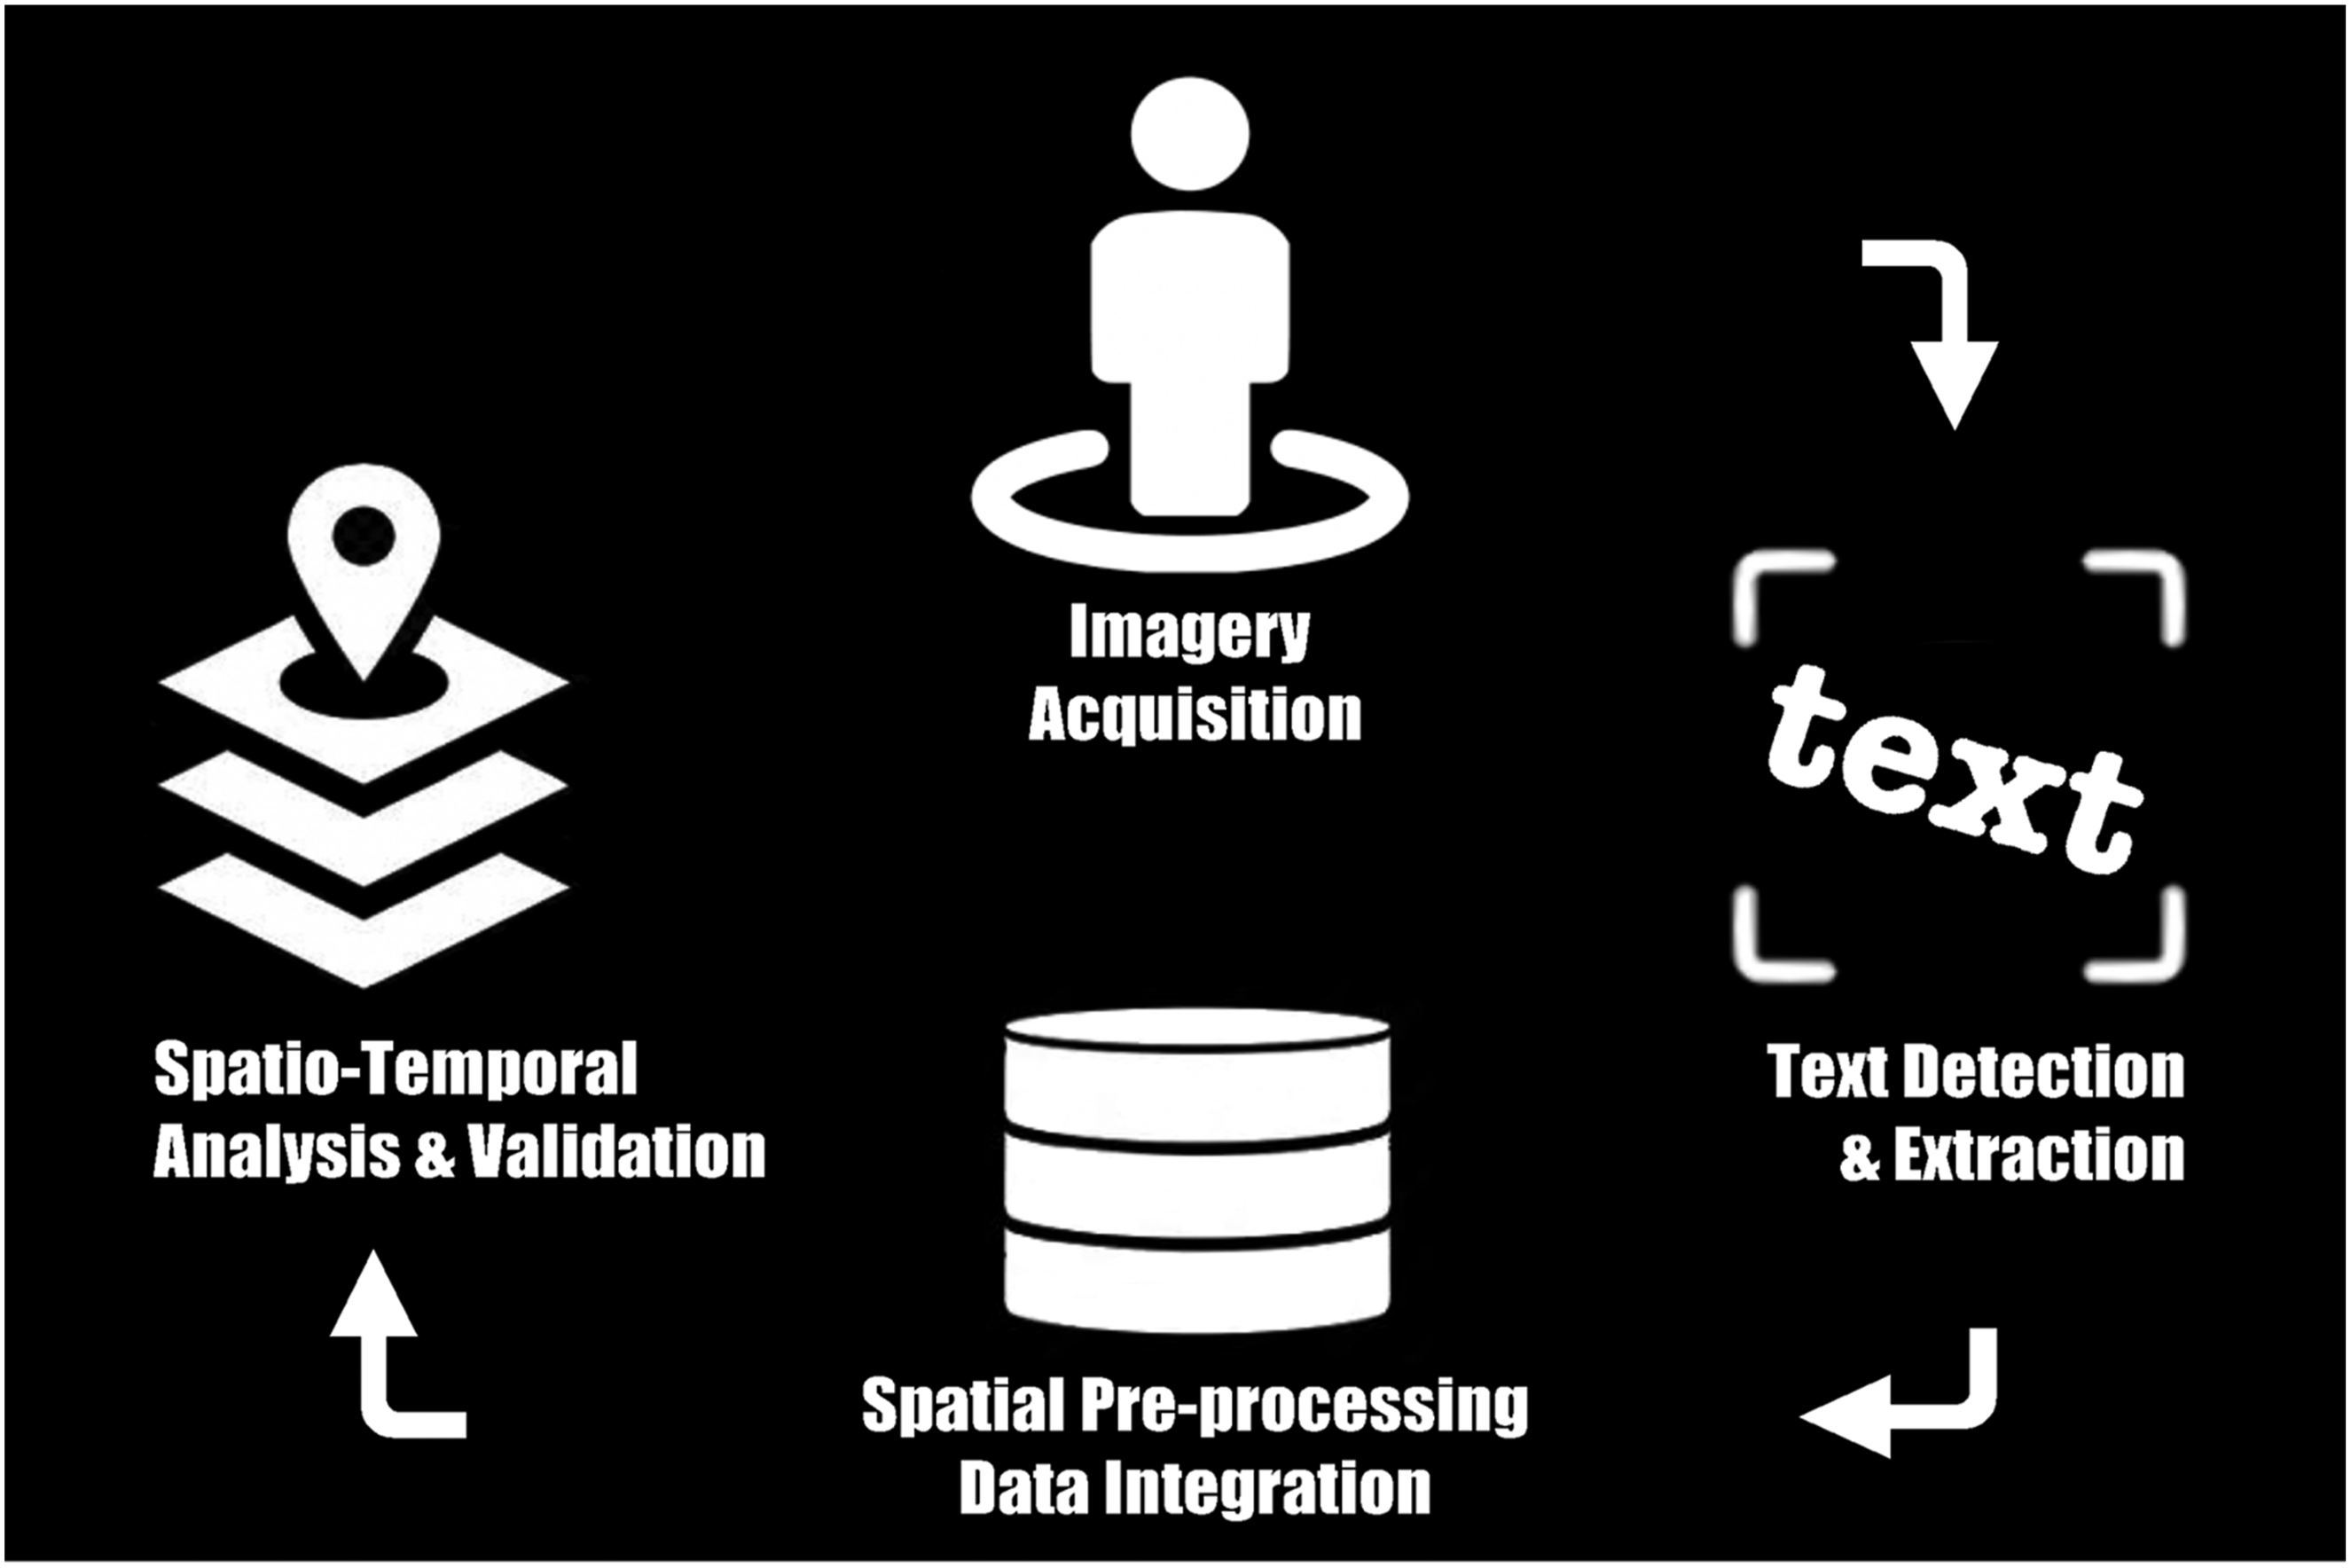
Imagery acquisition begins by connecting a Google Cloud project to a billing account and enabling the Google Street View API, Google Cloud Storage Buckets, and the Google Cloud Vision API. Following this, the Street View Download 360 tool (Orlita, 2025) is used to programmatically download SVI imagery, providing control over area-of-interest (AOI) polygons, spatial location, acquisition date, imagery resolution, step distance, image flattening, and filename concatenation. Each panoramic image is flattened into a single 6656 × 3328 pixel image to remain below the 20 MB maximum size limit for a single Cloud Vision API request. The step distance is set to 31 m, balancing spatial coverage and redundancy. Concatenated EXIF metadata (location, heading, date, and panorama ID) are embedded in image filenames and parsed as comma-separated values directly into database fields. Imagery downloaded via the Street View API is stored in a Google Cloud Storage bucket, with optional local storage for redundancy.
Text detection and extraction are performed using the Google Cloud Vision API for optical character recognition (OCR), including text detection, recognition, and script identification, using the default configuration to ensure reproducibility across space and time. This configuration provides a general-purpose OCR baseline suitable for heterogeneous urban environments, while avoiding task-specific tuning that could introduce spatial or temporal bias. SVI filenames, containing concatenated EXIF metadata, are parsed into a PostgreSQL database using a custom Node.js application (the Linguistic Landscape Data Collection tool
1
), which acts as a driver to ingest and structure the Google Vision API JSON responses. Each detected text block represents a spatially bounded instance of visible public text and constitutes the unit of analysis used throughout the study. Figure 2 shows an example of multiple text blocks detected in an image along with their English translation. Although a languageHint flag can be supplied in the Vision API request, it is not used in this study to avoid biasing detection toward expected languages. UTF-8 encoding errors may occur during recognition or script classification, resulting in false negatives where text cannot be confidently assigned to either Ukrainian or Russian. SQL queries standardize recognized text to a common lowercase Unicode form (NFC). As Google Street View imagery is legally watermarked, these watermarks are handled through database-level filtering rather than image modification. Raw Vision API outputs are filtered to remove special characters, numbers, short tokens (length <3), and text not classified as Ukrainian or Russian. Example showing multiple text blocks detected in an image along with their English translation.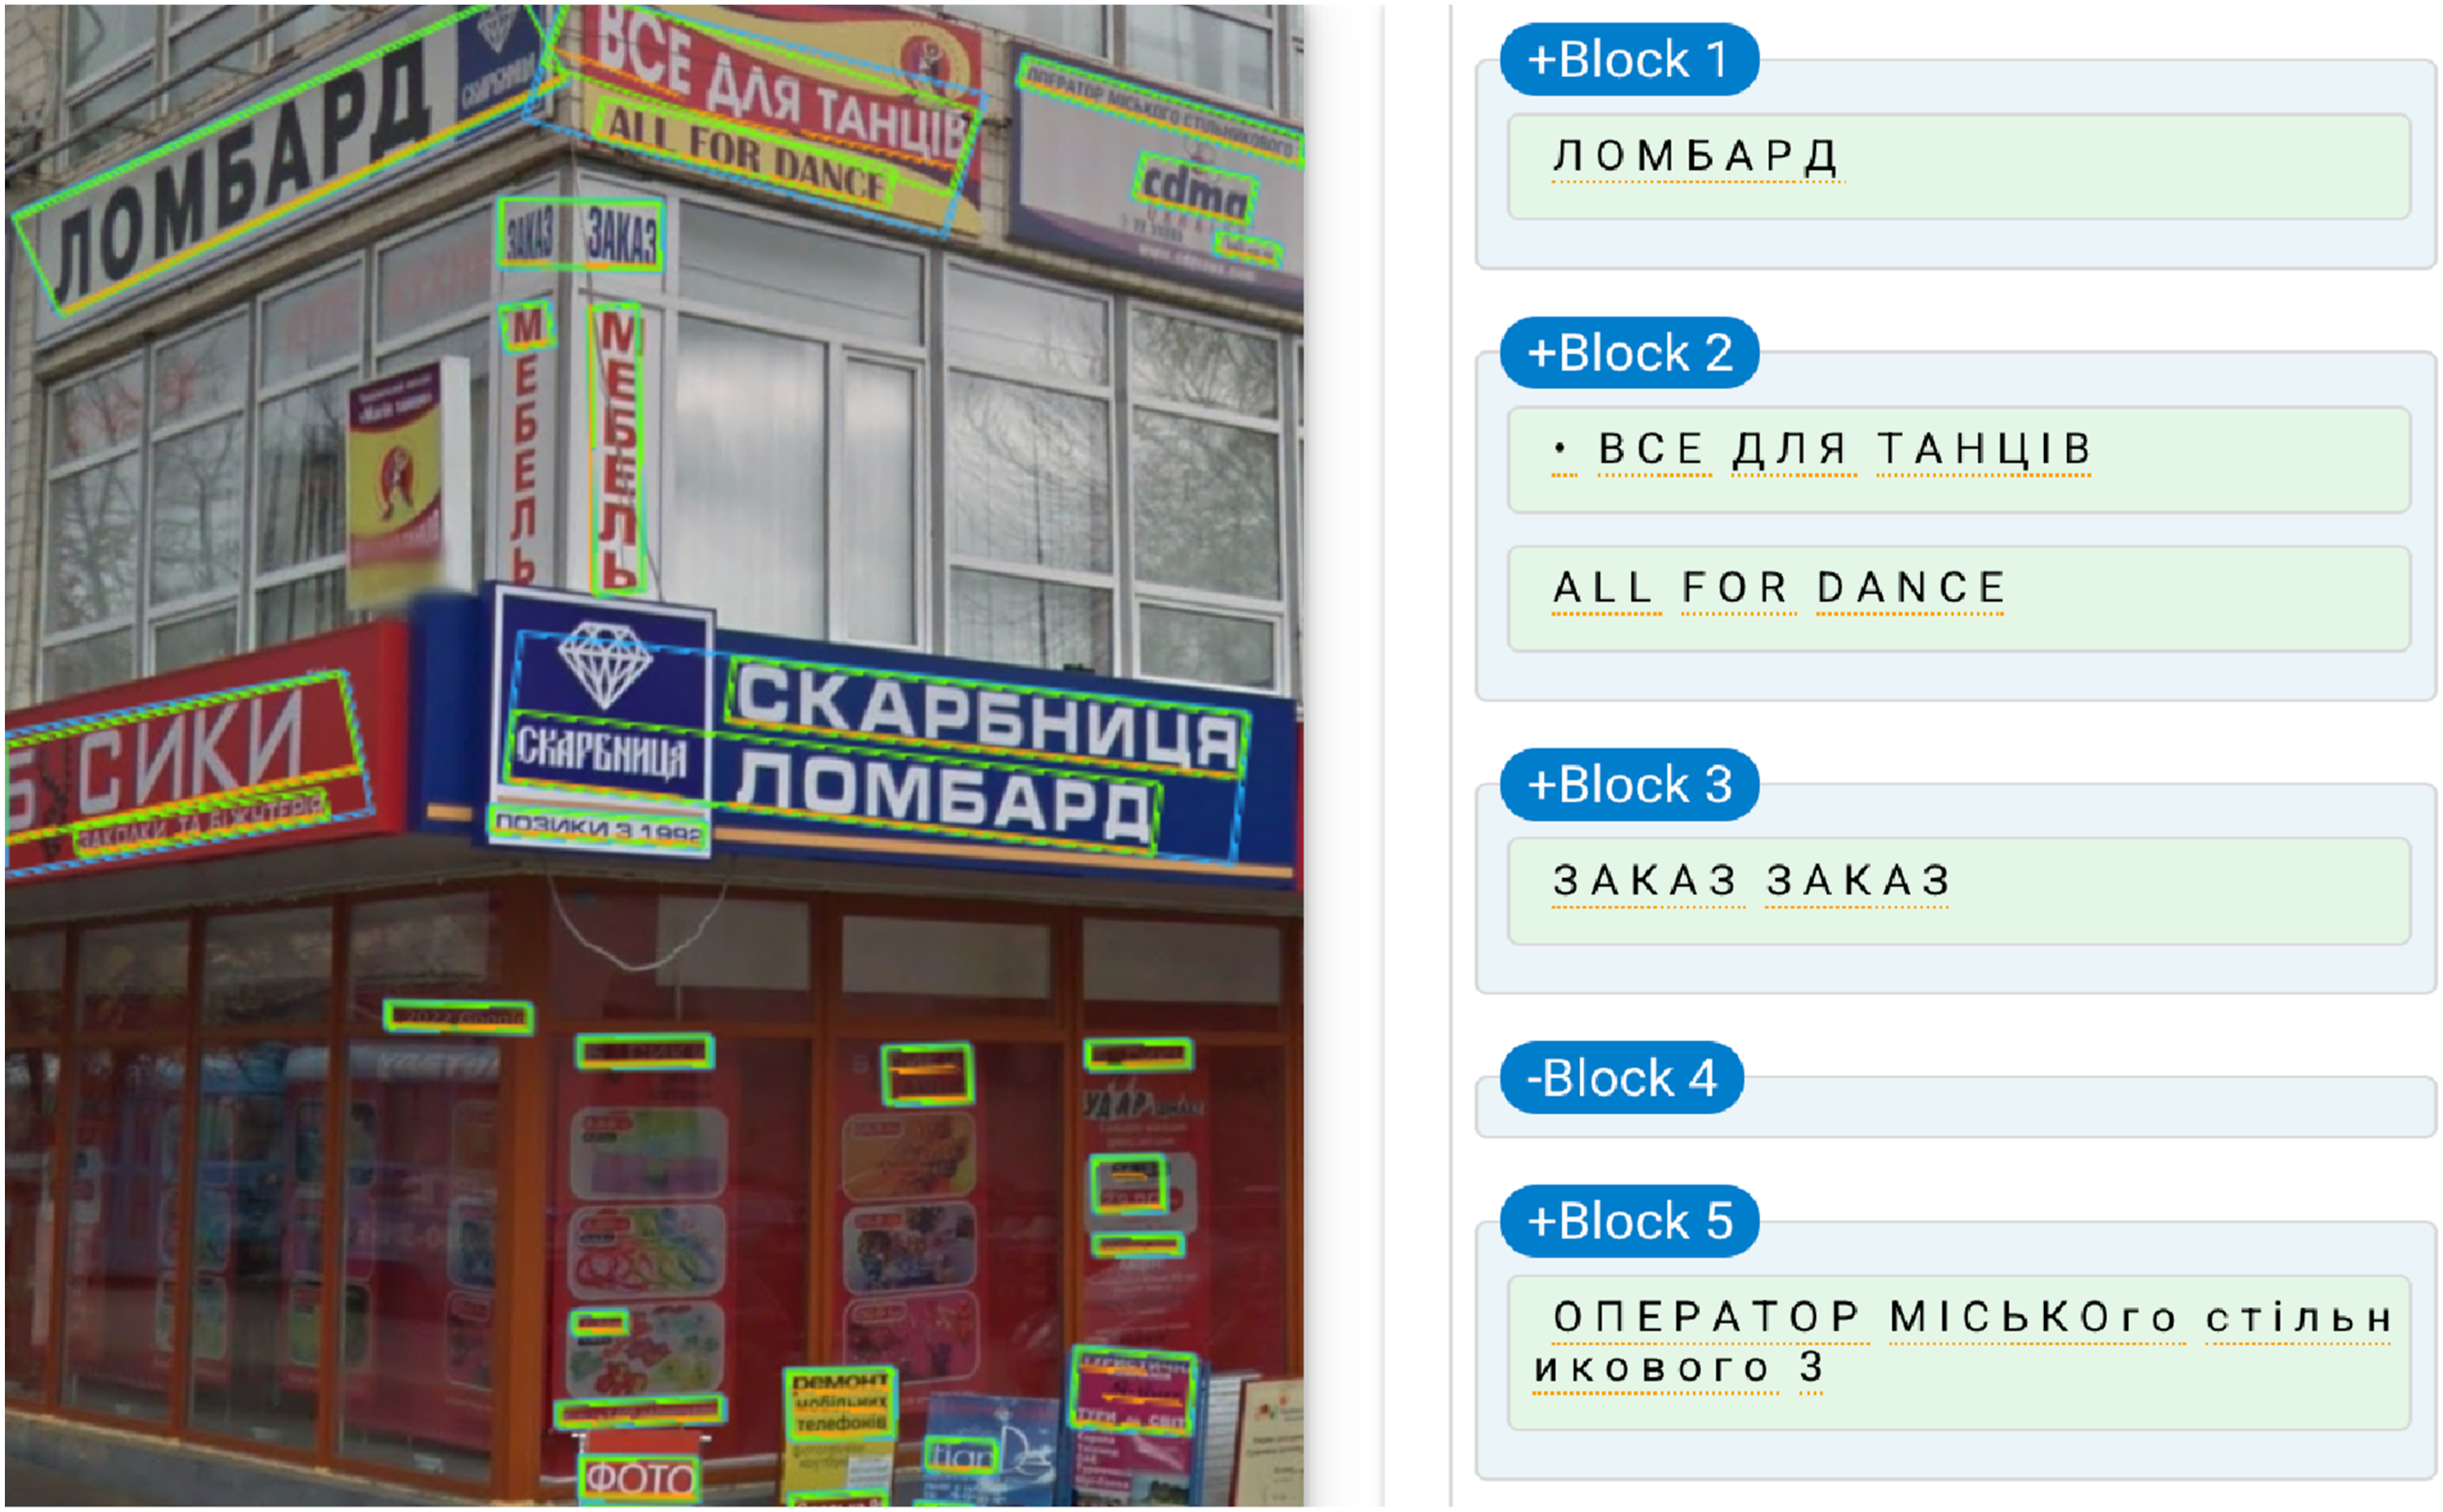
Spatial pre-processing and data integration are carried out using ArcGIS Pro and QGIS for SQL and GIS operations. OpenStreetMap (OSM) road network and administrative boundary data are validated for fitness-for-purpose by checking completeness, basic topology, and attribute consistency, with visual verification against Google Street View imagery to identify gross positional errors. All spatial layers are projected in WGS84 (EPSG:4326). Linguistic detection point data are clipped to the study-area boundary, snapped to the road network, and spatially joined to OSM road segments and administrative polygons. Redundancy arising from repeated detections across overlapping street view images is reduced by buffering language points using intersecting radii greater than twice the step distance (31 m), followed by dissolving features based on detected text descriptors and timestamps. Duplicate primary keys are removed while retaining disjoint observations. The ISO language field is encoded as binomial integer data (+1 for Ukrainian, −1 for Russian), and linguistic landscape rasters are derived by aggregating point data to a grid matched to the population raster in cell size, extent, and coordinate reference system, ensuring continuity of spatial resolution across datasets (Hong, 2023). Aggregation produces a normalized difference index for each cell calculated as (A − B)/(A + B), where A represents Ukrainian detections and B represents Russian detections This follows a conceptually similar approach to the Native Language Count Ratio proposed by He (2023), without implying equivalence to speaker populations, language proficiency, or language use beyond visible public text.
Spatio-temporal analysis and validation are conducted using three complementary techniques. First, Space-Time Cube analysis is applied to examine changes across space (x, y) and time (z) by aggregating linguistic landscape data into temporal bins and spatial units, including road types and administrative subdistricts. Based on the Mann–Kendall statistic, this method requires a minimum of 10 time slices per spatial bin to identify statistically significant trends. Second, Hot Spot Analysis (Getis–Ord Gi)* is used to detect spatial clustering in the linguistic landscape, enabling identification of localized pockets of spatial association that may not be evident using global statistics (Getis and Ord, 1995). This approach explicitly accounts for spatial inhomogeneity and missing values. Third, Cross-K analysis, a bivariate extension of Ripley’s K implemented in R using the spatstat package, is applied to examine distance-based relationships between linguistic features and IDP relocation sites, focusing on the spatial clustering of the term rent in Russian (аренда) and Ukrainian (оренда) across multiple spatial bandwidths. Finally, classification reliability is assessed through stratified manual validation of sub-samples of detected text blocks, with uncertainty quantified using Clopper–Pearson confidence intervals. Standard OCR accuracy metrics are not reported, as the workflow does not attempt one-to-one matching with ground-truth signage and does not account for false negatives; instead, validation focuses on confidence-bounded proportions and the consistency of spatial patterns across analytical scales.
Results
Linguistic landscape IoU and population change
Figure 3 provides spatial context for the analyses that follow by showing the road network of Kyiv classified by functional hierarchy, together with the locations of IDP relocation sites. By situating IDP sites within the city’s transport structure, the figure establishes the spatial framework used to examine how population change, and linguistic landscape (LL) indicators vary across neighbourhoods and road types. Population changes and LL IoU dynamics at IDP relocation sites are summarized in Table 2; between 2011 and 2015, most IDP sites recorded population density increases, with particularly pronounced increases in Troyeshchyna (from 10,418 to 14,508 people per square km), Lisovyi Masyv (4688 to 6529), Akademmistechko (8103 to 9199), and Borshchahivka (10,013 to 11,367). In contrast, Vynohradar, Syrets, and Pushcha-Vodytsia recorded declines during this period. Trends between 2015 and 2021 were more mixed, with some sites undergoing substantial increases and others experiencing sharp decreases. Pozniaky grew from 1714 to 7,913, Osokorky from 1958 to 4,392, and Kharkivskyi Masyv from 1741 to 6,247, while Troyeshchyna fell from 14,508 to 8,536, Borshchahivka from 11,367 to 5,428, Vynohradar from 6922 to 3,239, and Syrets from 13,714 to 3108. These patterns illustrate the uneven demographic impacts of displacement and resettlement across Kyiv and provide the demographic backdrop for interpreting LL change at IDP sites. Road network of Kyiv with IDP locations. Population and LL IoU changes at IDP relocation sites from 2011 to 2021. Note. A value of ‘—’ indicates that data was not available.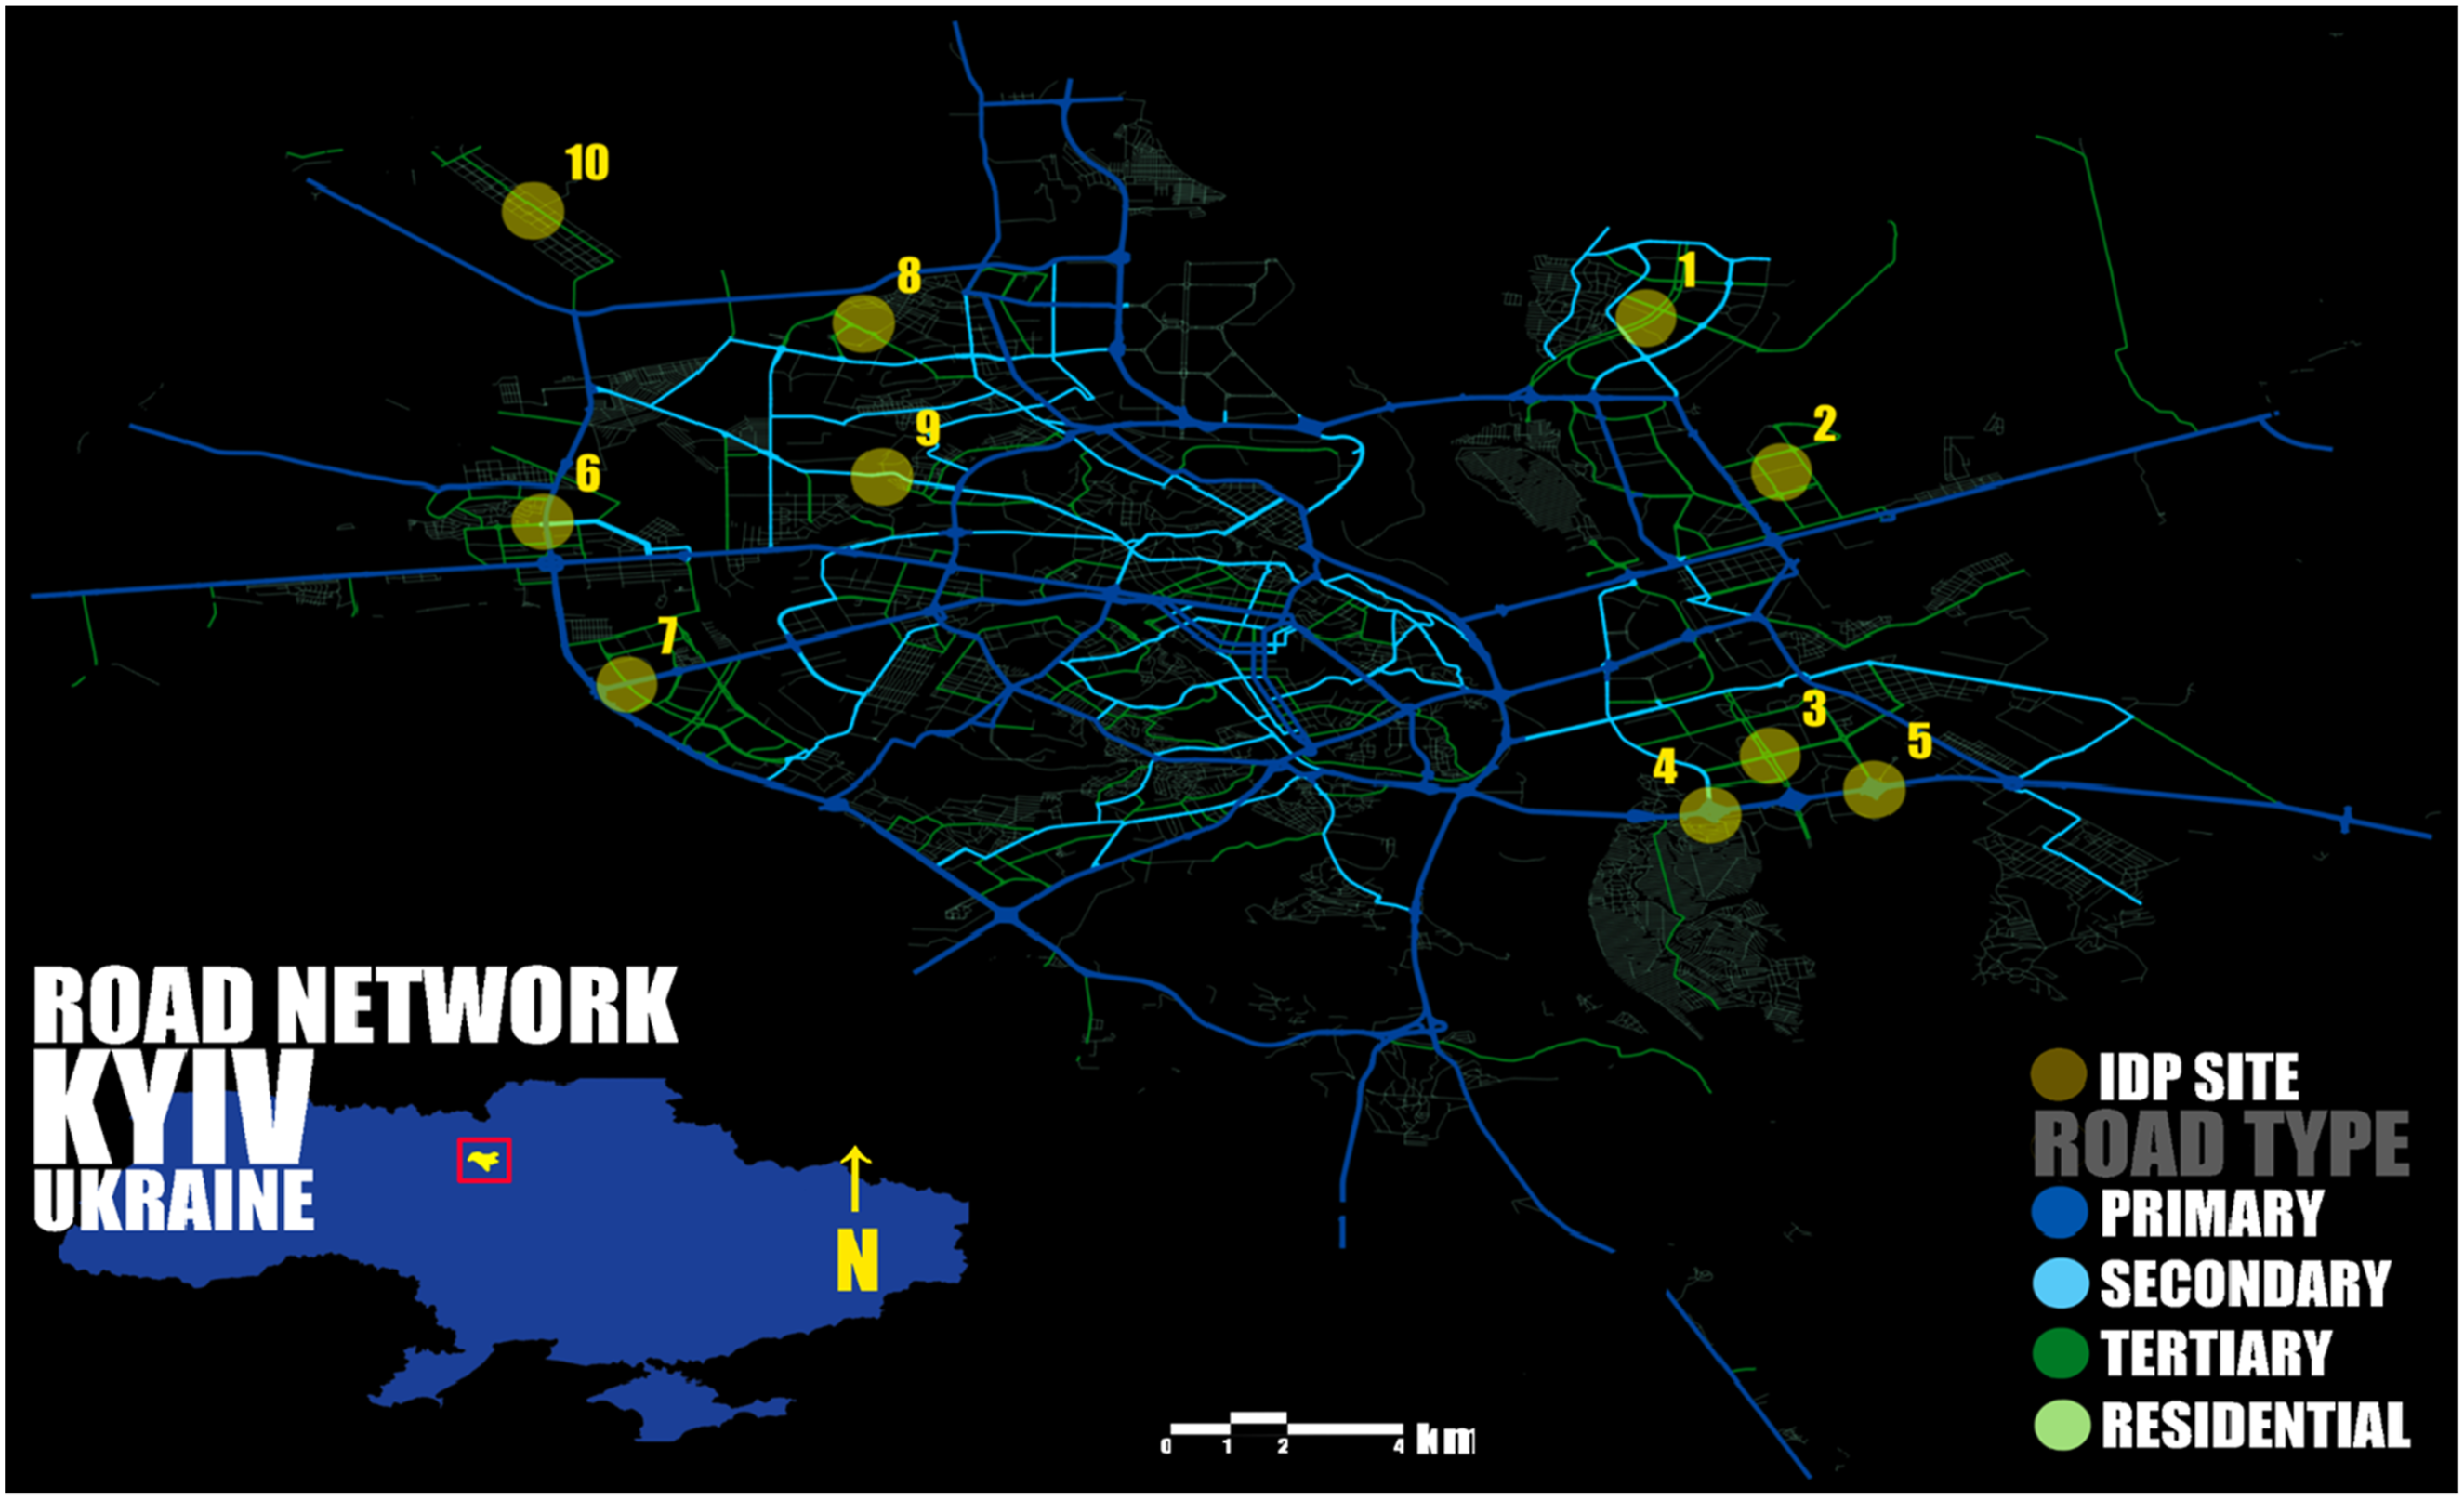
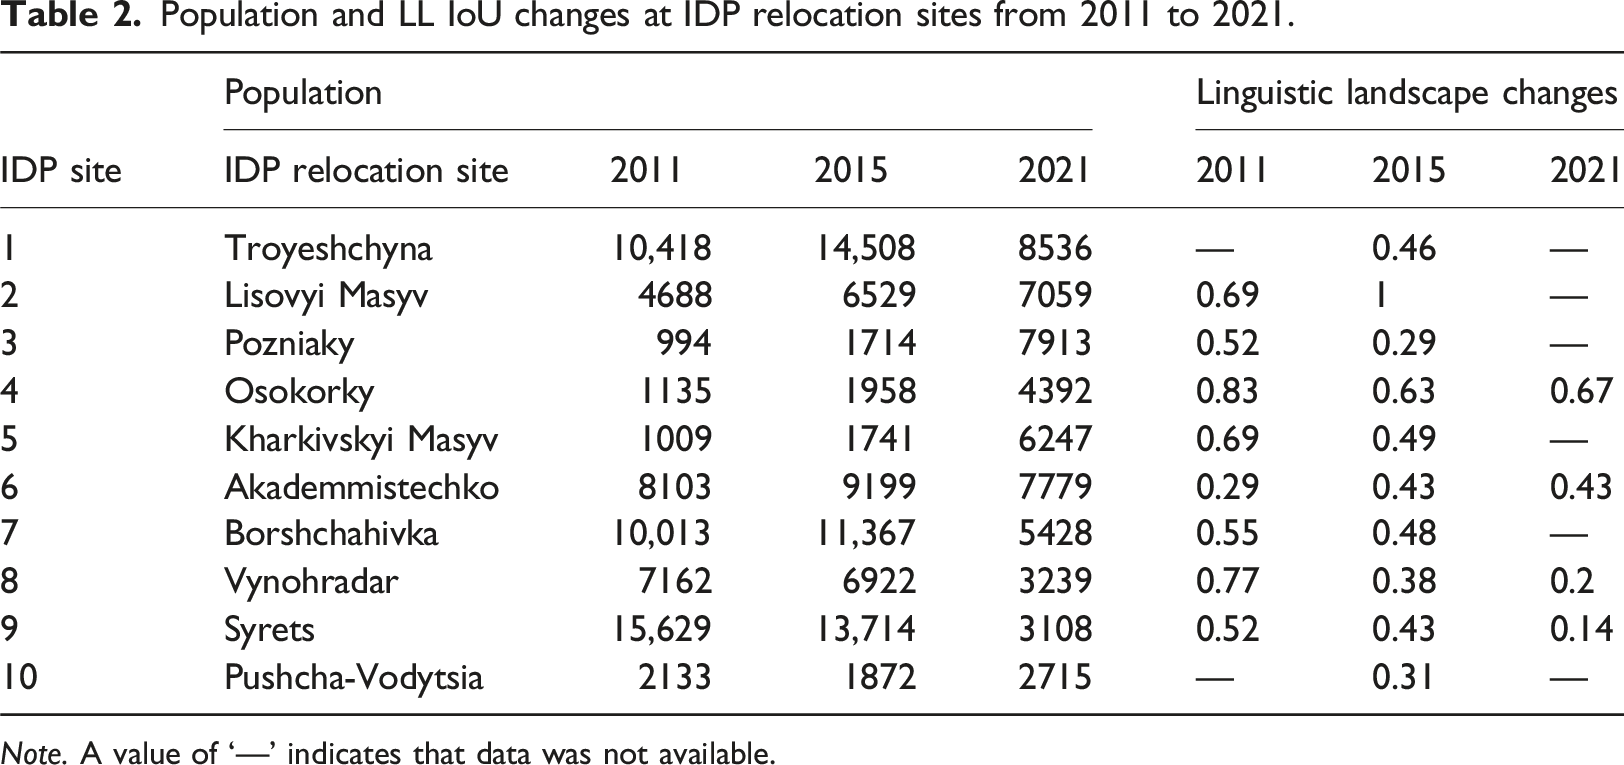
LL changes were also uneven across sites. The aggregate LL IoU declined from 0.62 in 2011 to 0.54 in 2015, before increasing slightly to 0.59 in 2021. Some neighbourhoods showed a stronger shift towards Ukrainian-language presence. Lisovyi Masyv and Akademmistechko showed an increase in Ukrainian preference, with increases from 0.69 to 1 IoU, and 0.29 to 0.43, respectively; Borshchahivka LL IoU went from 0.55 to 0.48, showing a slight Russian preference; Troyeshchyna remained undetermined due to data limitations. Where data were available for 2021, Osokorky showed a slight increase in Ukrainian preference, moving from 0.63 to 0.67; Akademmistechko was unchanged; Vynohradar and Syrets both showed Russian preference, with LL IoU values decreasing from 0.38 to 0.2, and from 0.43 to 0.14, respectively. Taken together, these results demonstrate that LL patterns differ across IDP relocation sites despite broadly similar population trajectories.
IoU by raion and road type
The paired sample t-test and Wilcox signed-rank test comparing raion-level IoU values between 2011 and 2015 found a significant decrease (a mean difference of −0.125 IoU, p < 0.01 for both significance tests), showing a trend toward greater Russian-language presence in the LL at the raion scale during these two periods. Figure 4 shows a clear functional hierarchy in Kyiv’s LL: Ukrainian language was more prevalent along high-volume, commercial, public, global network (roads), with some primary roads showing 0.63 IoU in Darnytskyi in 2011. In contrast, Russian language predominated along low volume, residential, private, and local roads such as Desnianskyi, with a recorded IoU of 0.16. Across all raions in 2011 and 2015, the IoU was higher for primary roads and lower for residential roads, highlighting the influence of road function on visible language use. Data for 2021 were not included in this analysis because insufficient granularity prevented aggregation by road type and raion. Linguistic landscape IoU by raion and road type in 2011 and 2015.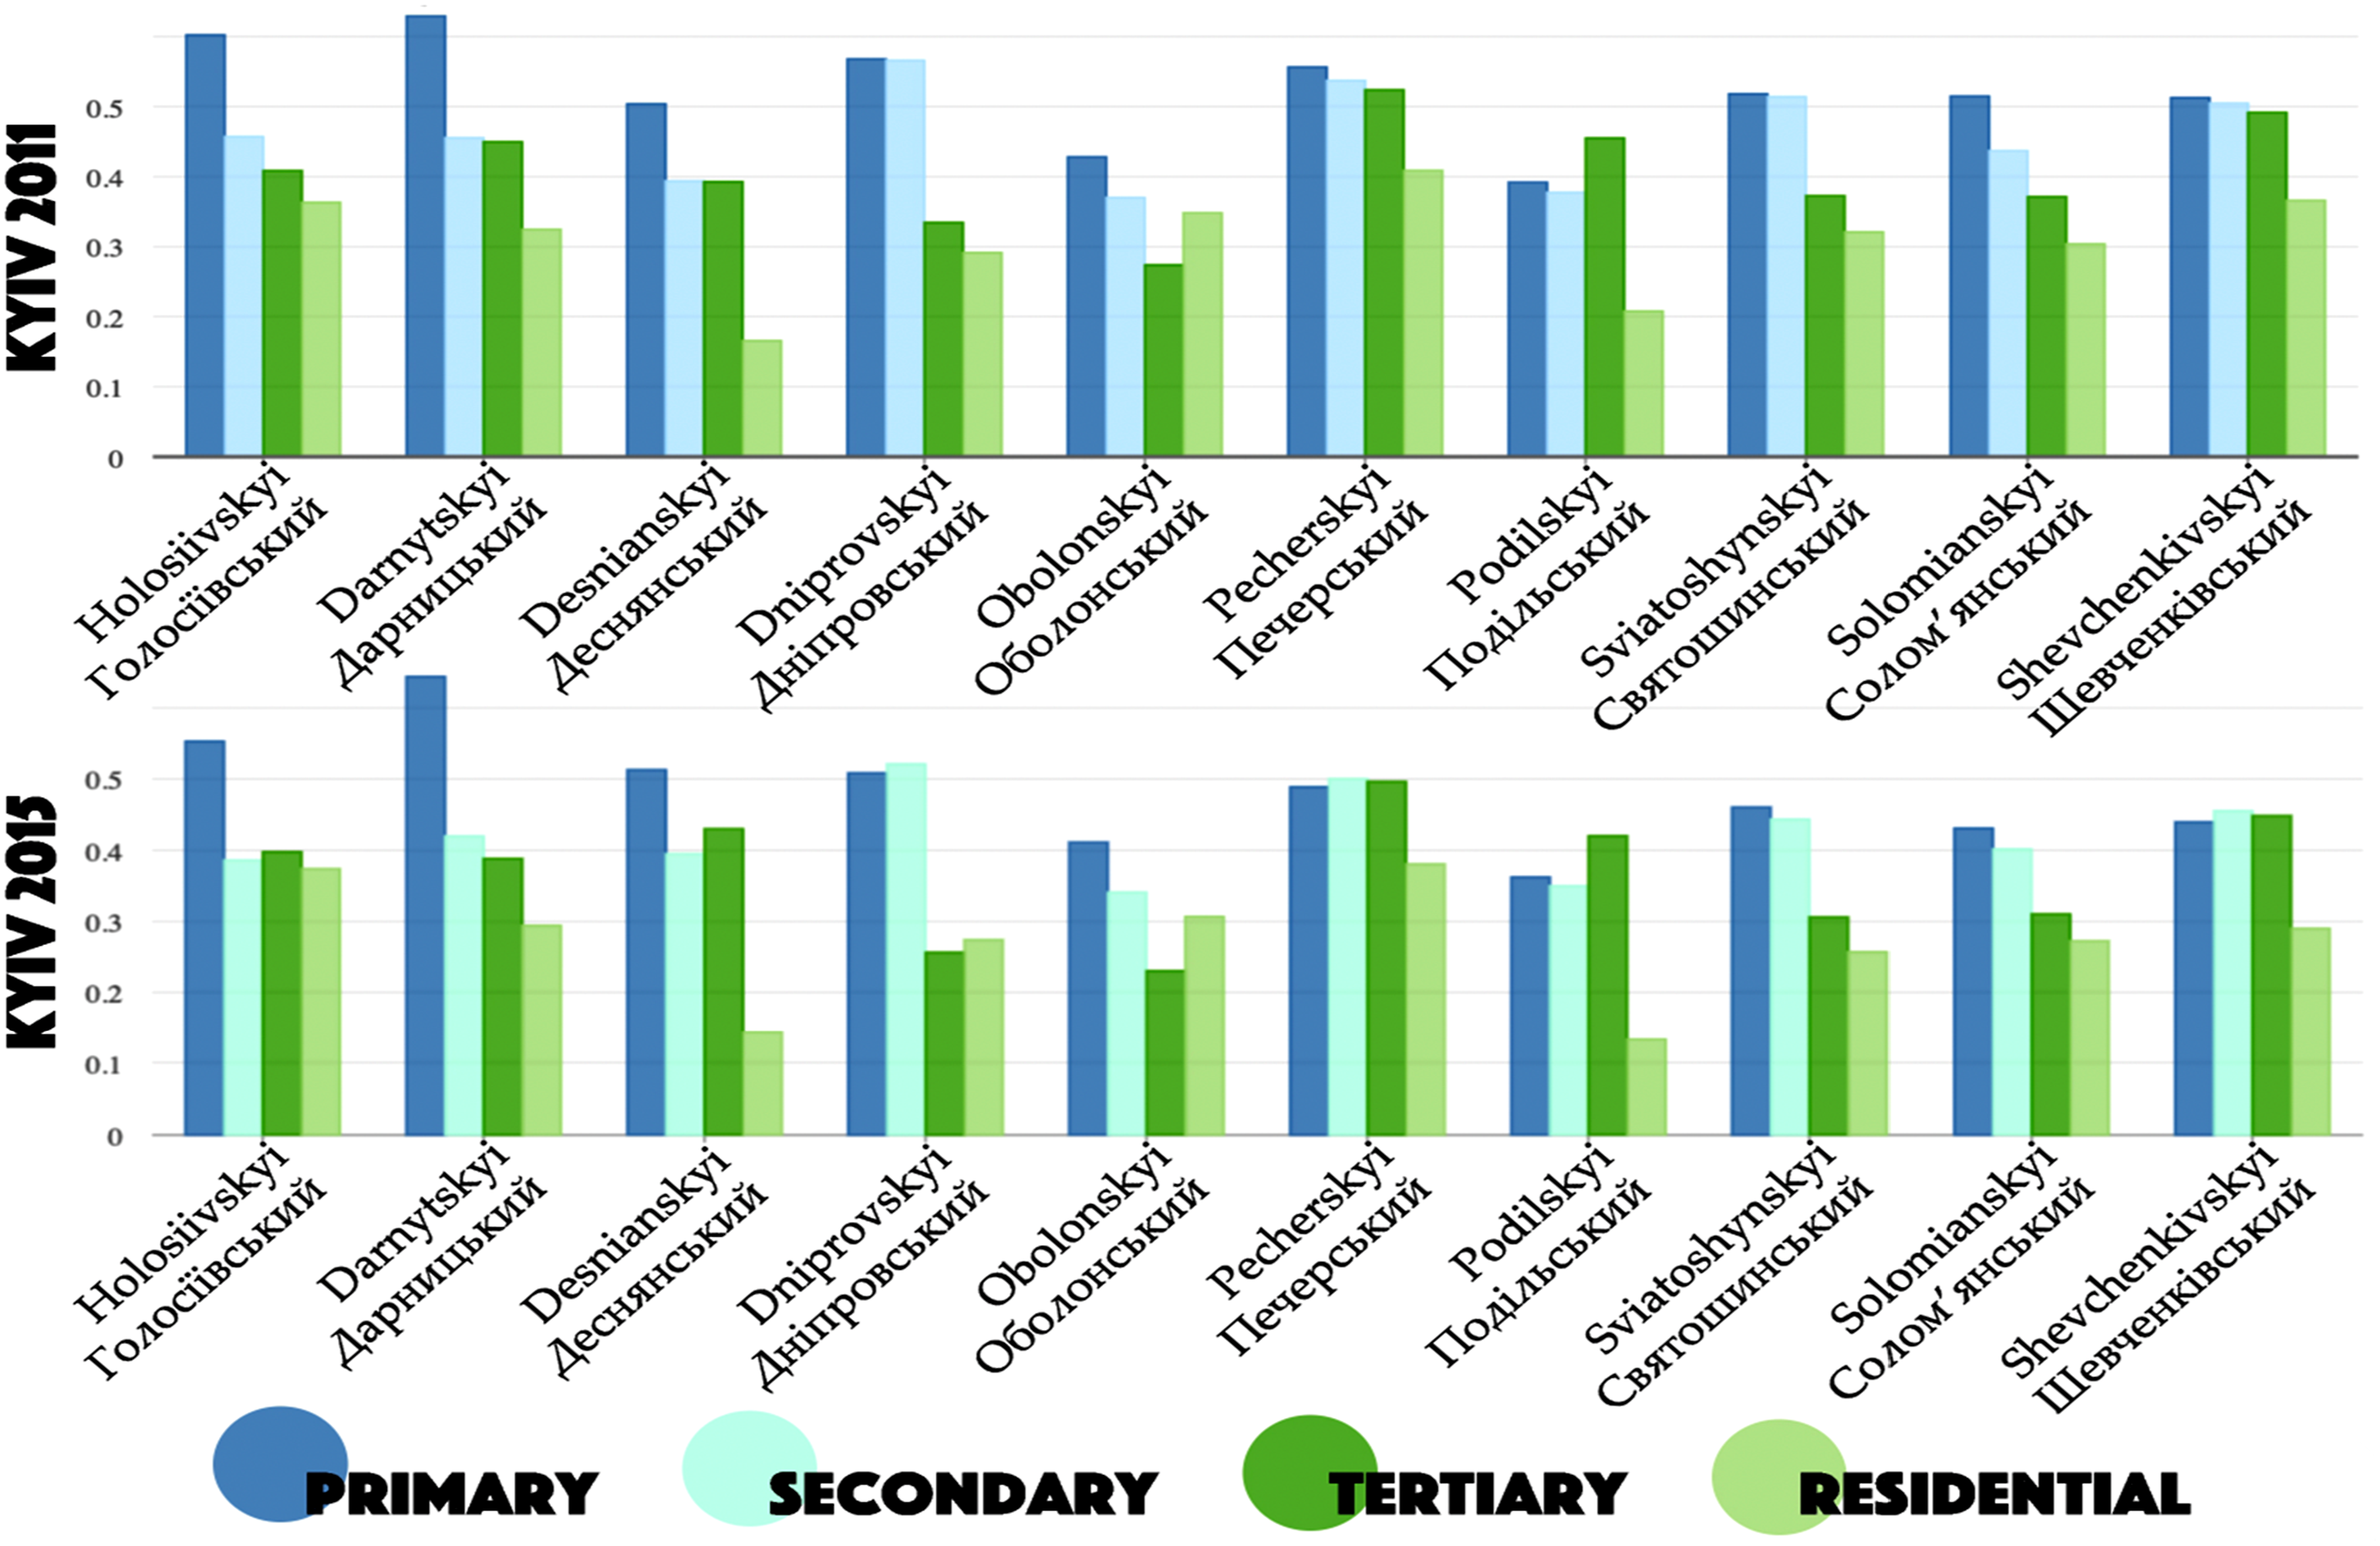
Density of scene text at IDP relocation site.
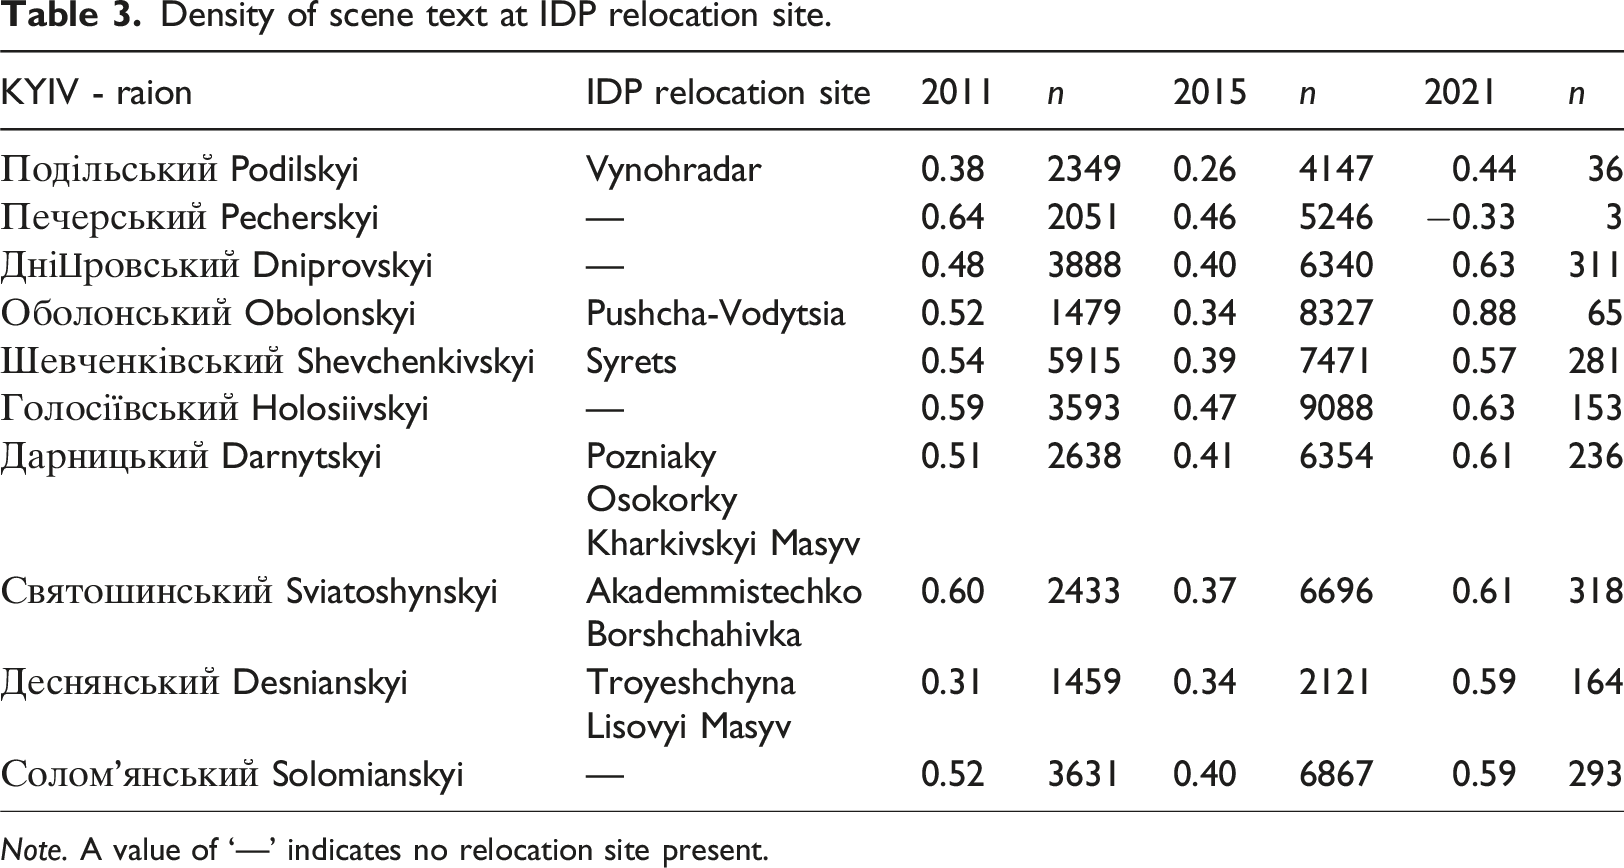
Note. A value of ‘—’ indicates no relocation site present.
Space-time cube
Several 1000 m neighbourhood trend bins showed statistically significant downtrends (greater than 95% confidence) clustered around the southern administrative border with Pecherksyi raion, as well as Shevchenkivskyi and Holosiivskyi raions for the 2011 to 2018 period. These trends were identified using 6-month temporal bins within a 1000 m grid. However, limitations in temporal data coverage resulted in insufficient observations for many spatial bins, and consequently most bins did not meet the minimum sample size required to detect statistically significant trends.
Hot spot analysis
The results of the Hot Spot analysis (Figure 5) identified several overlapping neighbourhood-level hotspots across Kyiv that persisted between 2011 and 2015, with a few notable differences. Pecherskyi raion, for example, showed no statistically significant clustering of Russian-language presence in 2011 and only limited presence in 2015, while consistently emerging as a hotspot for Ukrainian language in both years. In contrast, Borshchahivka and Lisovyi Masyv showed hotspots for Russian language and an absence of Ukrainian, whereas many Ukrainian hotspots showed little or no Russian-language presence. Interpretation of these patterns is complicated by the inhomogeneous spatial distribution of language. In some cases, the apparent absence of a language may reflect limitations in SVI coverage rather than an actual absence of LL elements within the analysed area. Kyiv hot spots of Russian and Ukrainian in 2011 & 2015 at 500 m.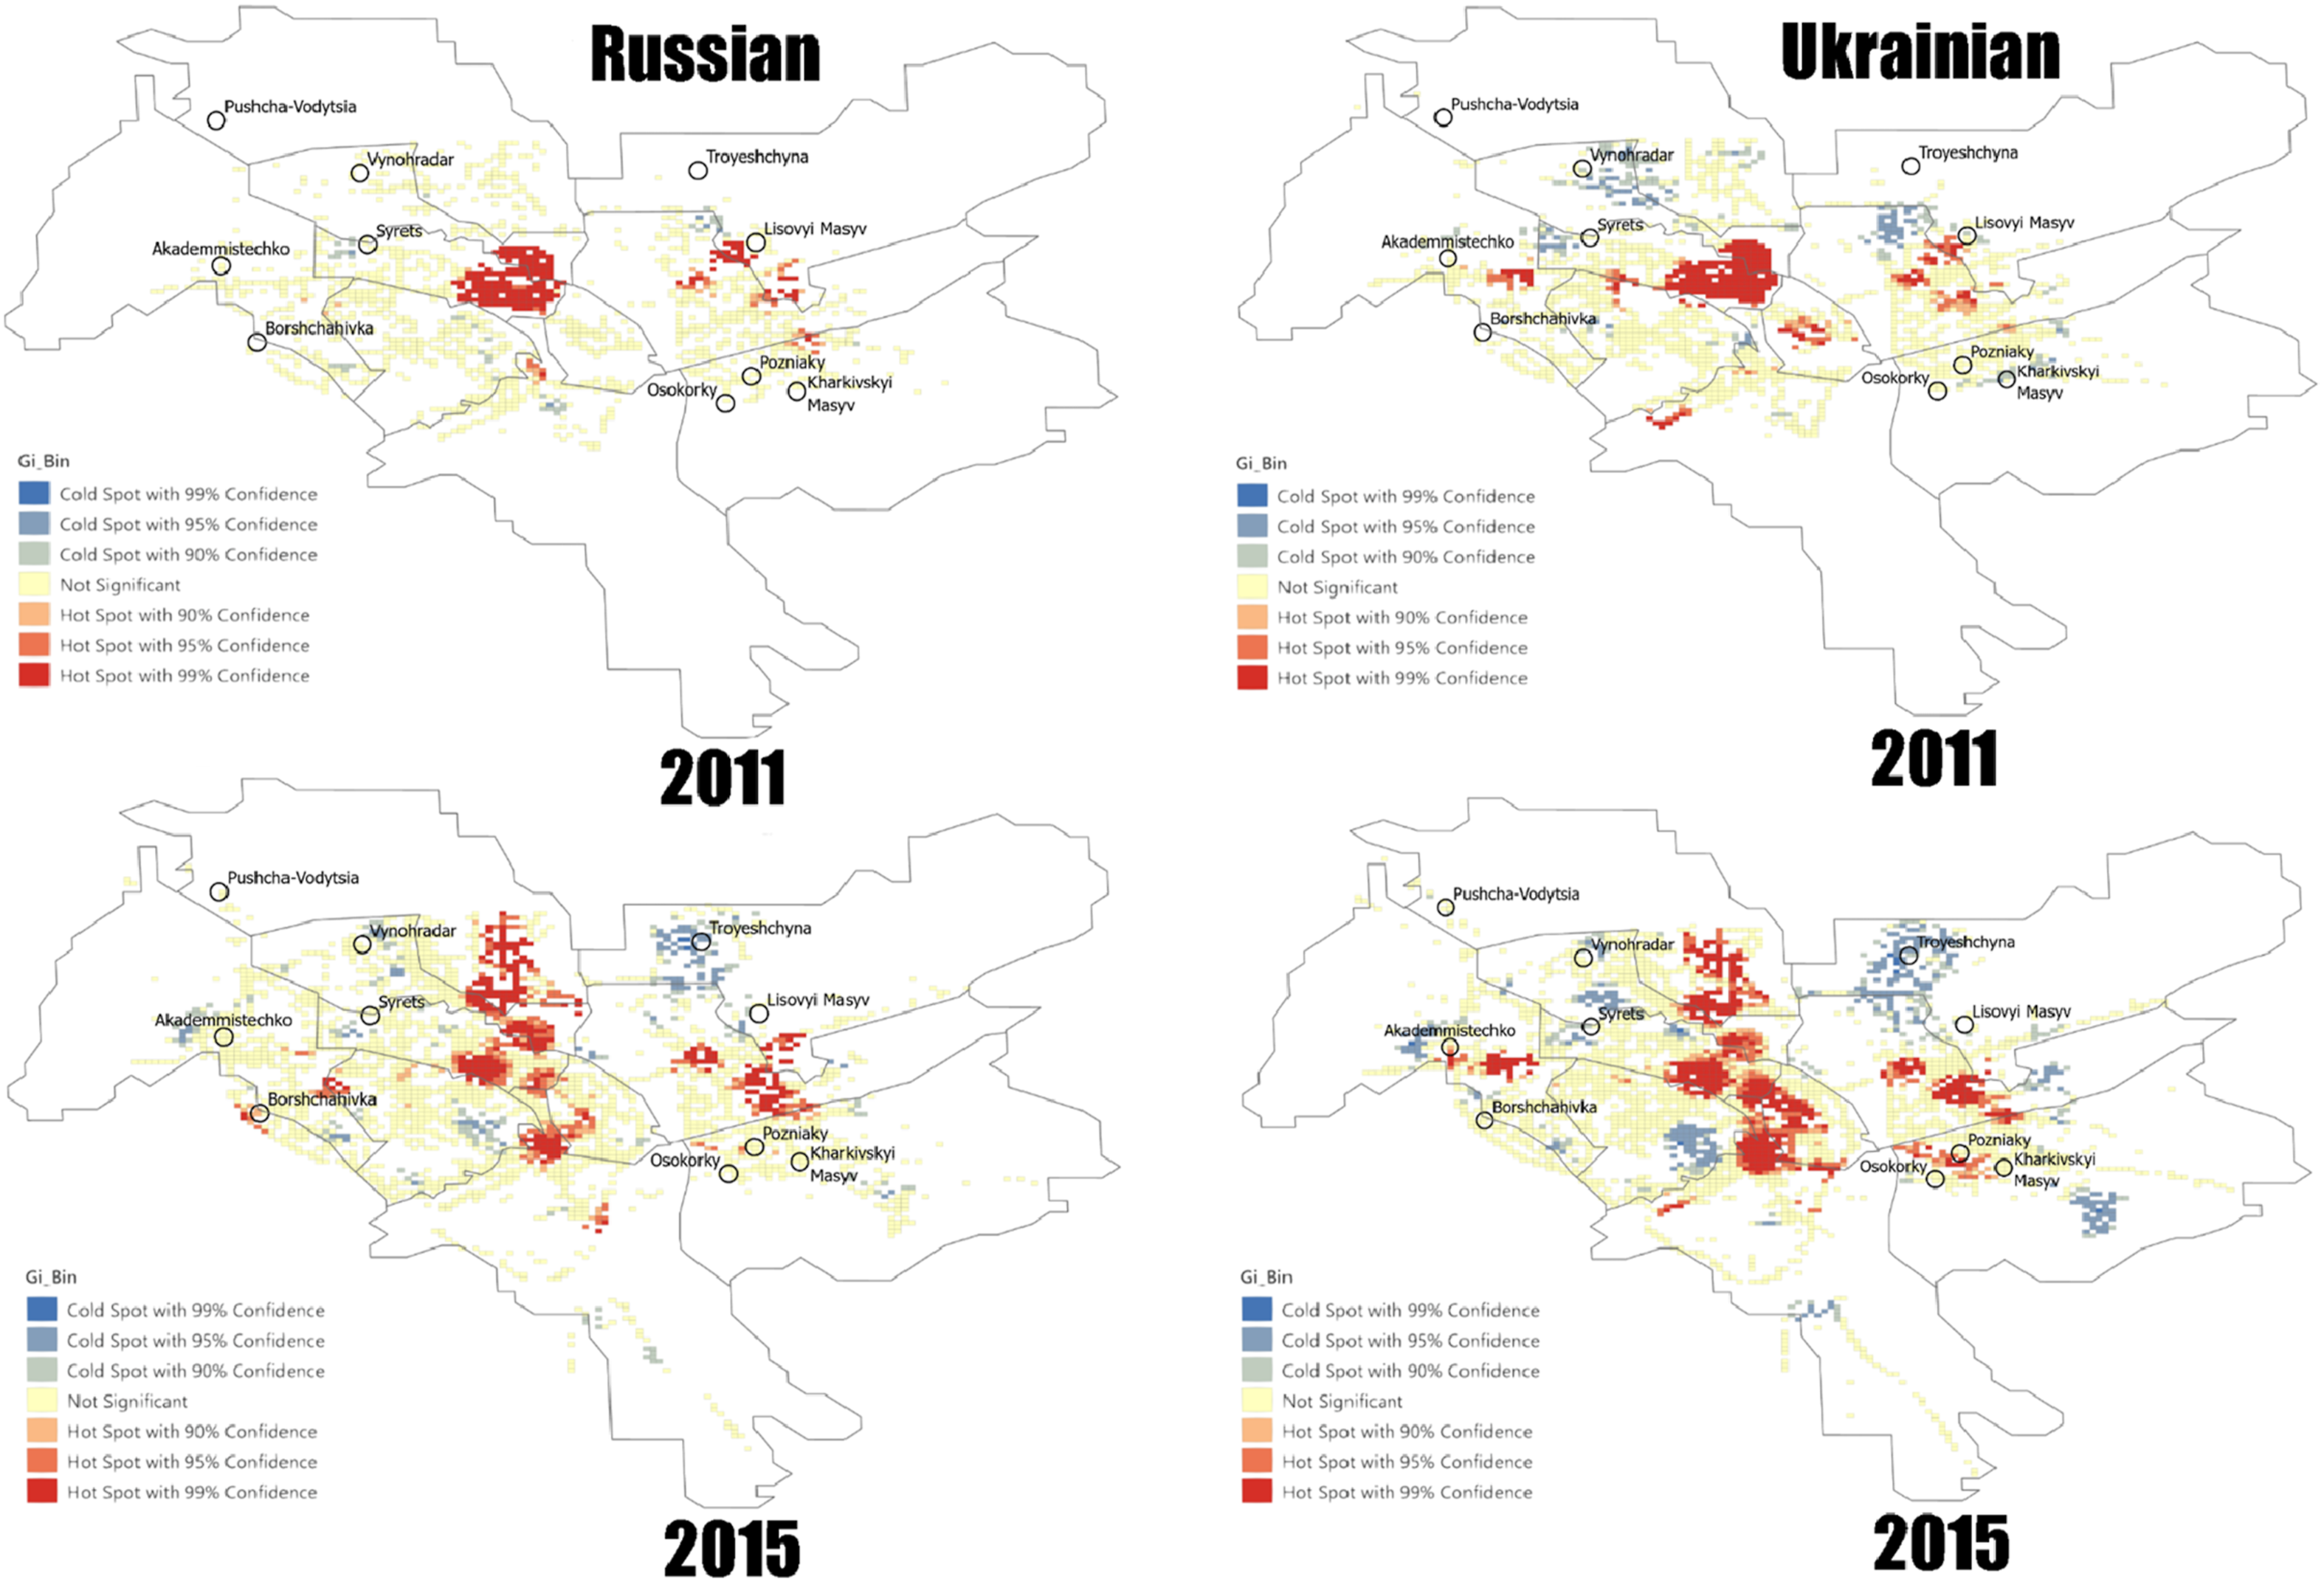
Cross-K
Cross-K analysis was performed for the word ‘rent’ in both Russian (аренда: 1277) and Ukrainian (оренда: 2384) to assess the spatial interaction between language use and IDP settlement locations. The 2015 results (Figure 6) revealed a significant uptick in Russian-language usage at the neighbourhood level during the period of IDP influx, detectable at spatial scales of less than 0.02 decimal degrees (approximately 2200 m). In contrast, Ukrainian-language use in these same areas appeared spatially random. For 2011, both Russian and Ukrainian showed a more dispersed pattern across the same neighbourhoods, indicating that the spatial clustering of Russian-language terms was associated with post-2011 demographic changes. These findings complement the Hot Spot analysis results by confirming that Russian-language visibility increased in areas affected by IDP settlement, while Ukrainian-language patterns remained diffuse or stable. The Cross-K results therefore highlight the fine-scale spatial interaction between demographic shifts and LL change. Cross-K: IDP site versus ‘rent’ in Russian and Ukrainian, in 2011 and 2015.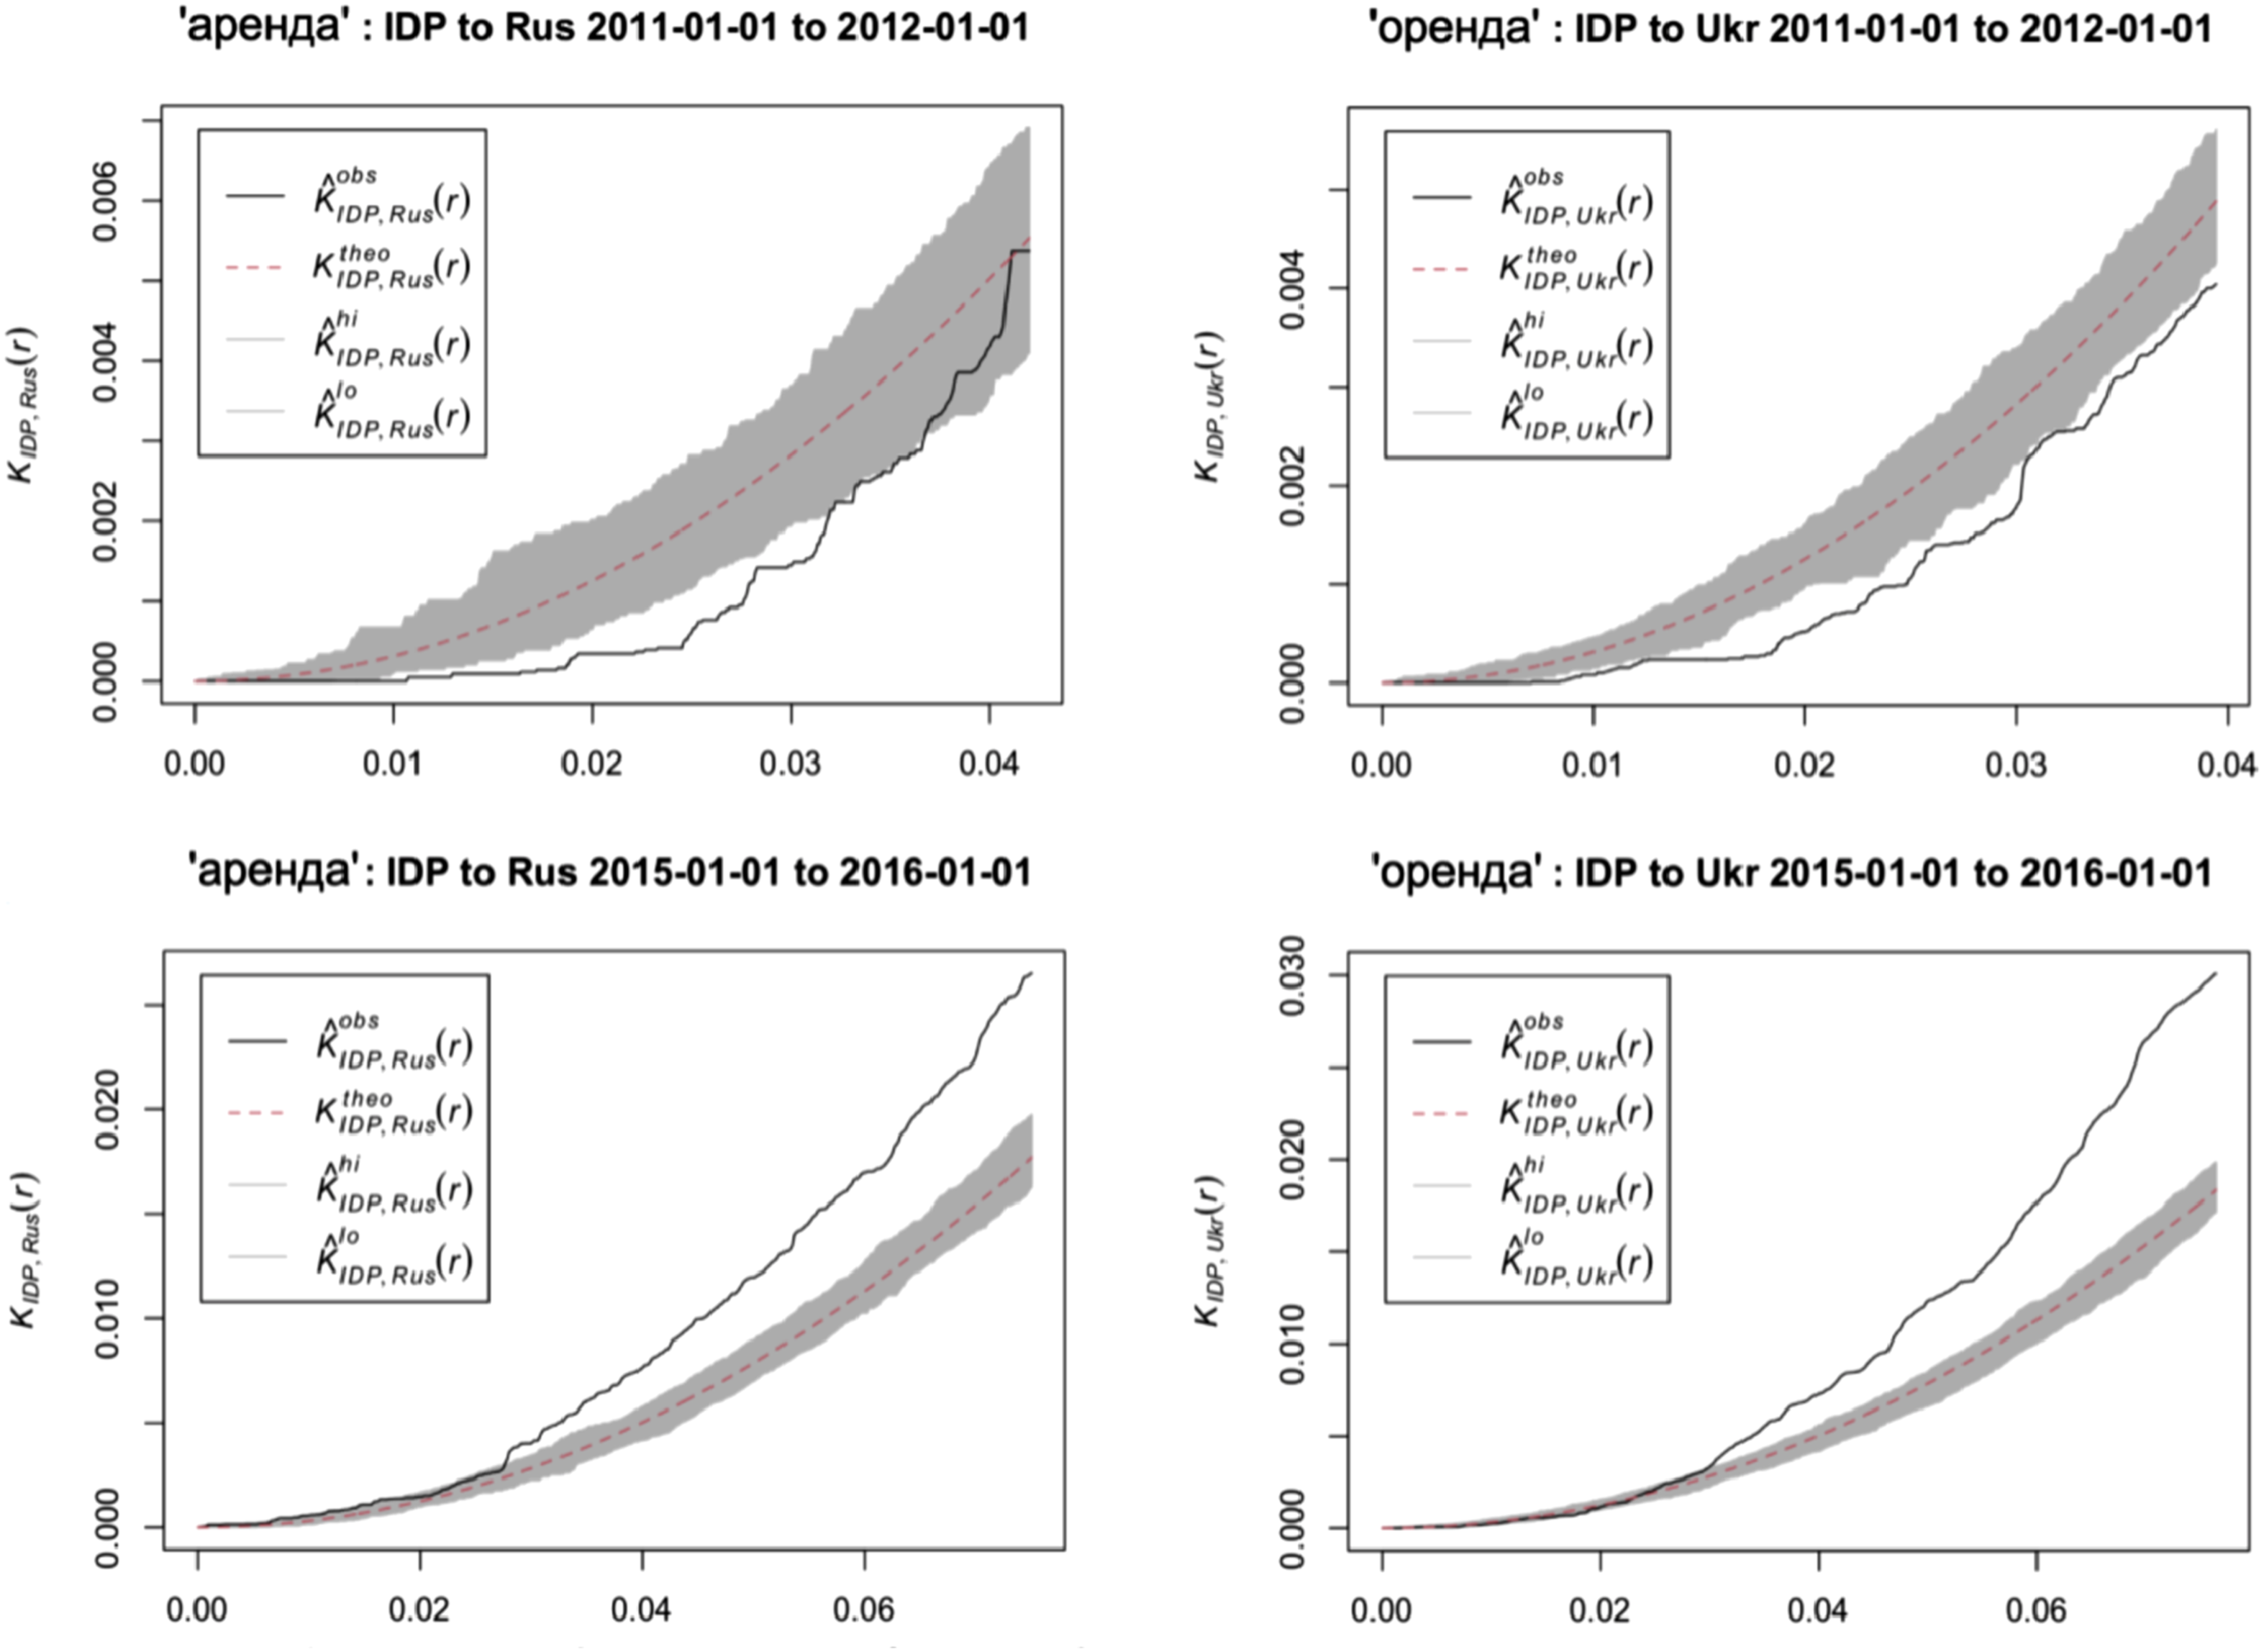
Clopper-Pearson
For a 95% confidence interval (n = 94,202), 415 out of 1999 items (20.8%) were validated as Russian, with the true proportion expected to fall between 19.0% and 22.6%. Similarly, 1114 out of 1999 items (55.7%) were validated as Ukrainian, with a true proportion between 53.5% and 57.9%. A further 355 items (17.8%) were classified as ambivalent, with a 95% confidence range of 16.1% to 19.5%, and 115 items (5.6%) were identified as false positives, with the true proportion likely between 4.8% and 6.9%. The false detection accuracy is not reported using standard ICDAR metrics because overlapping locations, repeated records, and different viewing angles make direct comparison between detections and ground-truth difficult, and the method does not account for false negatives, yielding accuracy rates >95% accounting for false positive-inclusive datasets.
Discussion
The LL of Kyiv, during the period 2011 to 2021, was shaped by multiple, sometimes conflicting, forces related to population shifts and urban change. Following Euromaidan and subsequent conflict in Donbas and Lugansk in 2014, the first wave of IDPs, mainly from Russian-speaking regions, were resettled into housing and shelter arrangements. The arrival of these IDPs was associated with increased Russian-language visibility into the LL, especially within the informational space (Sokolova, 2022). Some infrastructure projects, such as the Kyiv Urban Mobility Project (World Bank, 2020), aimed at improving transport links, especially to Troyeshchyna, likely contributed to population increases alongside IDP resettlement. Nevertheless, aggregate LL IoU results indicate an overall decrease in LL from 0.51 to 0.39 in Kyiv, and from −0.09 to −0.15, suggesting the LL was impacted by the demographic changes from 2014 onward. Conversely, the 2015 Decommunization law (Verkhovna Rada, 2015) reinforced monolingual Ukrainian signage, changing or removing Communist-era names from streets, metro stations, squares, parks, and public buildings. Over 500 streets in Kyiv have been renamed since 2014, with 110 being renamed alone in 2015. A further significant shift towards Ukrainian in the LL occurred following the 2019 ‘Law on Protecting the Functioning of Ukrainian as the State Language’ (Verkhovna Rada, 2019), with aggregate LL IoU rising from 0.39 in 2015 to 0.58 in 2021.
These findings demonstrate that the LL of Kyiv reflects the complex interplay of demographic shifts, legal frameworks, and social pressures. The influx of Russian-speaking IDPs initially increased Russian-language visibility, particularly in residential and low-traffic areas, while high-volume commercial and public roads maintained stronger Ukrainian presence. Over time, legal interventions reinforced the dominance of Ukrainian in public texts, gradually reshaping the LL in line with territorial norms. The observed LL changes also highlight the role of urban morphology and infrastructure in mediating language visibility. Areas experiencing rapid population density growth, such as Troyeshchyna, Lisovyi Masyv, and Pozniaky, showed mixed patterns of language preference, reflecting both demographic pressures and the functional hierarchy of roads and neighbourhoods. Space-time and hot spot analyses further indicate that Russian-language presence was concentrated around IDP settlements in 2015, whereas Ukrainian-language visibility became more consistent by 2021, particularly along primary roads and commercial corridors. Cross-K analyses confirmed that Russian-language terms were significantly clustered near IDP relocation sites, while Ukrainian-language terms remained more dispersed, underscoring the influence of post-2014 migration patterns on language use.
These patterns are interpreted as changes in the public visibility of language shaped by shifting audiences, regulatory contexts, and urban spatial structure, rather than as direct evidence of the language preferences or identities of individual sign authors. Taken together, these results suggest that shifts in the LL cannot be attributed solely to demographic change; policy interventions, urban infrastructure, and the spatial organization all interact to shape the language visibility in public space. Understanding these dynamics is essential for stakeholders seeking to monitor linguistic trends, implement language policy, or assess the social impacts of population movements in rapidly changing urban contexts. Beyond academic analysis, this methodology has broad potential applications: it can inform language policy, investigate the effects of demographic change, support market research, and identify optimal locations for outdoor advertising campaigns. In an era of extraordinary demographic shifts driven by mass migration, such approaches are particularly valuable for understanding how population movements, especially when undocumented or unregistered – affect the urban landscape.
Limitations
Data completeness issues stem largely from the availability of SVI. While more complete Google SVI collections were conducted in 2011 and 2015, much of the remaining imagery was contributed by Google Trusted Photographers for other years, resulting in uneven spatial and temporal coverage in the study period. To obtain statistically significant results, aggregation across locations and periods was necessary, which may have obscured some fine-scale temporal and neighbourhood-level LL dynamics. Because the analysis relies on machine-detectable text extracted from street-view imagery, it is less sensitive to smaller or less prominent signage and does not constitute a complete census of all linguistic landscape elements. As such, this approach complements, rather than replaces, field-based linguistic landscape surveys.
Future research
Future research could explore finer temporal and spatial analyses of LL changes, including comparative studies across cities affected by migration, and integrate diverse data sources such as social media, administrative records, and mobile phone data to better understand the interaction between population movements, urban infrastructure, and language visibility. Advanced computational methods, including machine learning, computer vision, natural language processing, and remote sensing, could automate LL extraction, detect emerging language patterns, and forecast changes, supporting predictive modelling, identification of areas at risk of linguistic marginalization, and evaluation of policy effectiveness. Future work could also investigate methods for distinguishing between different sign types (e.g., commercial, official, informational, or personal signage), potentially through hybrid approaches combining computer vision, semantic context, and targeted manual validation, to better capture the socio-economic and institutional dimensions of linguistic landscapes. This methodology could also examine the socio-economic, cultural, and commercial implications of LL change, informing infrastructure development, cultural preservation, and community engagement. Finally, scaling up the monitoring and analysis of linguistic and social dynamics is essential for responding to rapid population changes, supporting inclusive urban policy, and fostering resilient, multilingual cityscapes.
Footnotes
Acknowledgements
The author would like to acknowledge the guidance and support provided by the Department of Geography, Chiang Mai University. This research was supported by the Chiang Mai University Presidential Scholarship and by project funding from the Google Cloud Researcher Grant.
Ethical considerations
This study did not involve human participants, human data, or human tissue, and therefore did not require ethics approval.
Consent to participate
The study did not involve any participants requiring informed consent.
Consent for publication
No data from individual persons, images, or videos were included in this study.
Funding
The authors disclosed receipt of the following financial support for the research, authorship, and/or publication of this article: This research was made possible by the Chiang Mai University Presidential Scholarship, as well as project funding by the Google Cloud Researcher Grant.
Declaration of conflicting interests
The authors declared no potential conflicts of interest with respect to the research, authorship, and/or publication of this article.
Data Availability Statement
The data for this research is available at https://github.com/rinvictusheththevereth/street-reader by ![]() .
.