
Abstract
This paper aims to provide a more comprehensive understanding of the geography of night working in London (United Kingdom). Around a quarter of London’s workforce is employed in the evening and night-time economy, working between the hours of 6 pm and 6 am. Compared to daytime workers, there is limited public information on where these workers are located, how they travel, and what amenities they rely on during work hours. To address this gap, we combine official employment statistics with mobile phone footfall data to develop the London Night-Worker Classification. This new small-area geodemographic classification captures key characteristics of night-working patterns, offering a spatial perspective on night-time employment to support more informed decisions in transport, planning, and worker wellbeing.
Introduction
Night-time work plays an important role in the social and cultural life of urban areas, contributing to the vibrancy and diversity of cities outside standard business hours. It is also essential for supporting key economic sectors such as hospitality, transport, healthcare and security and can account for a substantial share of the local economy. In London, around 1.32 million people, which is about a quarter of the workforce, regularly work between 6 pm and 6 am. Meanwhile, the number of business sites operating within the city’s night-time industries grew by 11.3% between 2017 and 2023, reaching 135,700 (GLA Economics, 2024). The growing importance of London’s night-time economy is reflected in its increasing policy focus, as illustrated by the Greater London Authority’s 24-h Vision, introduced in 2017 (GLA, 2017), evidence base reports from 2018 to 2024 (GLA Economics, 2018, 2024), along with a recently established Nightlife Taskforce (Mayor of London, 2025). Despite this policy attention, relatively little is known about the spatial distribution of night-workers across the city. Existing research has highlighted how night-time work often falls outside conventional frameworks of employment, with workers displaying less predictable activity patterns and more distinct mobility patterns (see, for instance, Kolioulis et al., 2021; Acuto et al., 2025). These differences present challenges for data collection and policy design, especially when relying on traditional labour market surveys. To address this gap, new ways of categorising and understanding night-time populations at a more granular spatial level are therefore required, and the approach we take here is the creation of a geodemographic classification.
Geodemographics is traditionally defined as the ‘analysis of people by where they live’ (Harris et al., 2005), typically involving the classification of small geographic areas with similar socio-economic characteristics and is a long-established approach to data classification, which has found common applications in a range of policy contexts (Singleton and Spielman, 2014). Traditional classifications emphasise the grouping of populations based on a broad range of variables, typically drawn from national censuses, to provide a comprehensive representation of a given area. However, in recent years there has been a growing shift towards the development of new geodemographic classifications tailored to specific policy objectives or contextual applications. These purpose-driven classifications employ a more selective set of variables, often informed by policy consultations or survey data. Singleton and Longley (2019, 2025) illustrate this shift by demonstrating how stakeholder consultations influenced the design of both the London Workplace Zone Classification (LWZC) and the London Output Area Classification (LOAC). By incorporating policymakers’ recommendations on variable selection and testing the practical utility of the resulting classification with end users, they ensured its relevance and applicability in practice. Other studies have adapted geodemographic approaches to meet specific policy needs by incorporating additional datasets and tailoring classifications to reflect particular behaviours or relate to planning objectives. For example, the Transport Classification of Londoners project restructured subgroups within LOAC using selected variables from the London Travel Demand Survey and Segmentation Survey (Transport for London, 2017).
It is within this context of purpose-built classifications aimed at addressing specific urban challenges and informing urban policy that we introduce the London Night-Workers Classification (LNC). By blending more traditional employment statistics with novel commercial mobile phone activity data, it offers a statistically robust typology that captures the distinct spatial and employment characteristics associated with night-working across the capital. While mobile phone activity does not directly identify employment status, the mobile phone data used in this study apply established heuristics to infer home and work locations, making them a useful proxy for night-time work. The LNC forms part of a broader interdisciplinary research project titled ‘Data After Dark’ that was funded by the Mayor of London to strengthen the evidence base for the city’s night-time economy. The project comprised three strands: a city-wide survey of night-workers and their employers; a series of long table discussions exploring the experiences of key, and often underrepresented, workers; and the development of an area-based quantitative classification of night-working, which is the focus of this paper.
Whilst the geographic scope of this research is London, the approach has been designed with transferability in mind and could be applied to other cities in the UK and internationally. For that reason, we see this research as a useful basis for a much-needed expansion in the availability of detailed, policy-relevant data for the significant proportion of the population who work during night-time hours.
Literature review
Geographical scholarship on the night-time economy and night-workers has examined a wide range of social, spatial, and economic dynamics across urban contexts. Studies have explored themes such as health (Bushell, 2023), tourism (Zmyślony and Pawlusiński, 2019), racial and ethnic inequalities (Schwanen et al., 2012), queer geographies (Campkin and Marshall, 2018), precarious labour (Kolioulis et al., 2021), culture (Rowe and Bavinton, 2011), governance (Roberts and Eldridge, 2009), and transport equity (McArthur et al., 2019; Smeds et al., 2020). In parallel, policymaking has shifted towards more integrated and inclusive strategies, recognising the night-time economy as a vital component of urban life rather than solely a space of leisure and consumption. Yet, despite the breadth of these contributions, there remains a lack of data and insight into the everyday realities of those working within the night-time economy itself. As Acuto et al. (2022: 109) argue, efforts to understand and govern the night must not focus only on those who consume it, but also on ‘those who are busy producing and sustaining this economy’.
A key challenge in addressing this gap lies in how night-time work is defined and measured. What constitutes ‘night’ or ‘work’ varies across contexts, making consistent and accurate data collection difficult. In the United States, for example, night-time activity is often referred to as the ‘other 9-to-5’ (Dentel-Post et al., 2017), whereas in the UK, a wider timeframe is commonly used. For instance, the Office for National Statistics (ONS) and Greater London Authority (GLA) define the night-time economy as covering all activity between 6 pm and 6 am (Wickham, 2012). Based on this, night-workers are identified as those who typically work during these hours. However, many roles are informal, irregular, or involve mixed schedules, complicating attempts to count workers or map their distribution across cities (see Acuto et al., 2025 for an overview).
Even without the complexities related to informal and complex work patterns, relying on a fixed 6 pm to 6 am window comes with all kinds of measurement challenges. For example, to estimate the number of people working during these hours in the UK, researchers primarily rely on the Labour Force Survey (LFS). The LFS is the UK’s largest quarterly household survey, covering approximately 38,000 households per wave, and is the only national survey by the ONS to collect data on individuals’ working hours. However, questions on usual working patterns are asked only once annually, during the second quarter. Respondents indicate whether they usually work during the day, evening, or night, and may select multiple options. Based on these responses, individuals are classified as night-time workers if they ‘usually’ work in the evening or at night, regardless of whether they also work during the day. Under this definition, approximately 8.4 million people in the UK were estimated to be night-time workers in 2023 (GLA Economics, 2024). A further limitation of the LFS is that it does not specify exact timeframes for ‘day’, ‘evening’, or ‘night’, leaving respondents to interpret these terms subjectively. As a result, individuals with identical working patterns may respond differently.
Spatial granularity of available data is another challenge, especially from a local policy perspective. While the Labour Force Survey (LFS) provides national and large-city level estimates, its sample size limits the reliability of data for smaller geographic areas. To improve these estimates for London, the GLA and ONS developed a more bespoke analysis in 2018, as outlined in London at Night: An Evidence Base for a 24-Hour City (GLA Economics, 2018). Their method first identified ‘night-time industries’ based on the LFS, selecting industries where at least 29% of workers reported night work with a sample size of 30 or more. Using three-digit Standard Industrial Classification (SIC) codes 1 , industries were grouped into four categories: (1) night-time cultural and leisure activities, (2) activities supporting those cultural and leisure sectors, (3) 24-h health and social services, and (4) services supporting wider social and economic functions (ONS, 2023). The total number of employees in these industries, as recorded in the Inter-Departmental Business Register (IDBR) 2 , were then counted to estimate night-time workers locally. While this approach enables estimates of the night-time workforce to be broken down by different parts of the city, it arguably significantly underestimates the number of night-workers. For instance, ONS (2023) estimates that only 60% of night-workers identified in the LFS were employed in these industries. This leaves 40% of night-workers, plus informal workers, unaccounted for at the local level. Conversely, some individuals may be classified as night-workers simply because they are employed in these industries, even if they do not primarily work at night.
In the context of limited publicly available granular data on night-workers, new data sources offer the potential to provide a more nuanced spatial picture of night-workers. One particularly promising source is mobile phone location data, which has been previously flagged as effective for measuring the size and spatio-temporal distribution of the night-time workforce (GLA Economics, 2018). Because most adults carry mobile phones that passively generate Call Detail Records (CDRs), mobile phone operators routinely offer data products that capture both the ambient population of an area and the flows of people to and from it, with high spatial and temporal granularity. Where these data products are limited by the demographic biases of their subscriber base (resulting in the under/over representation of certain population groups) and geographic biases (uneven sampling of locations per individual), they have seen widespread use within research, policy, and commercial contexts (Panczak et al., 2020). A common application, for instance, is the inference of home and work locations based on the frequency and timing of a user’s presence in particular areas (Yang et al., 2021). The analytical methods deployed to do this range from simple frequency counts to more sophisticated heuristics that incorporate time-of-day patterns and activity trends (Verma et al., 2024). The resulting ‘footfall’ data offer significant advantages over traditional surveys by accurately identifying night-work activity hotspots and the specific times of day and week when such activity occurs. These data on ambient populations can be combined with additional data sources and clustered to create a geodemographic classification (see Singleton et al., 2020) that captures key characteristics of night-working patterns.
Data and methods
The London Night-Worker Classification (LNC) draws on two main sources of data: open employment statistics and commercial British Telecom (BT) mobile phone activity data. We argue that linking open and commercial data sources through geodemographic classification provides a valuable balance between accessibility and detail. Employment structure data alone highlights industries where night workers are more prevalent, while BT footfall data, contains granular spatial and temporal insights that, as a commercial product, are unlikely to be published in their raw form. Variable selection was informed by a comprehensive review of potential data sources and guided by two priorities: achieving sufficient spatial and temporal granularity while ensuring availability across London and transferability to other UK cities and beyond. This approach avoids reliance on highly location-specific datasets that could limit replication. Moreover, the process of integrating multiple activity layers, each potentially sensitive on its own, helps mitigate disclosure risks and ethical challenges arising from the mapping of mobile phone location data (see Sieg et al., 2023). To align with the London policy context and definitions used by the GLA and ONS, we explicitly define evening and night-workers, hereinafter collectively referred to as night-time workers, as those who ‘usually’ work between 6 pm and 6 am.
Employment structure data
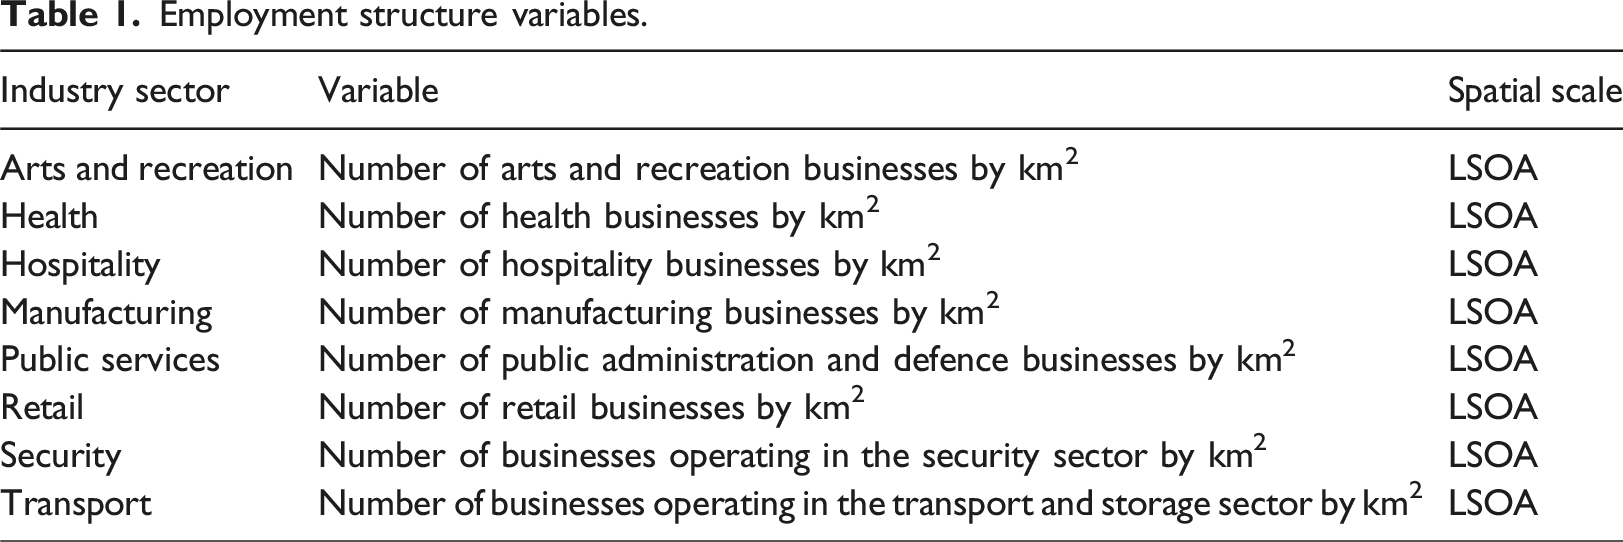
Employment structure relates to the composition of the night-time economy in terms of businesses that operate during night hours. In common with the approach taken by the GLA and ONS (GLA Economics, 2018), we use employment structure as a proxy for the demand for night-workers and to identify potential key night-worker locations. For this, we draw from the Directory of London Businesses, available through the London Datastore. The dataset includes a comprehensive list of businesses with detailed information on business locations and their Standard Industrial Classification (SIC) codes, which allows for aggregation. Alternative data sources such as the Inter-Departmental Business Register (IDBR) published by the Office for National Statistics, and the Business Census available through the Geographic Data Service, were also considered (GeoDS, 2025; ONS, 2025). However, since the IDBR is sold as a commercial product and access to the Business Census is restricted and requires an application, the Directory of London Businesses was selected for its accessibility as a publicly available dataset.
Employment structure variables.
Mobile phone activity data
To capture night-worker activity, we utilise British Telecom (BT) footfall data licensed through the GLA High Streets Data Service. This dataset is derived from mobile phone data gathered from EE – the UK’s largest mobile network (owned by BT) – with a 30% market share as of 2022 (Statista, 2022). The data are collected by continuously tracking all devices on the network, using signal triangulation. For data validation, BT compared its footfall counts to official match-day attendance figures at two London football stadiums – Craven Cottage and Emirates Stadium – finding only a 0.3% and 4.6% difference, respectively. In addition, the data are scaled to the UK’s population using age band and gender from census data to mitigate potential biases arising from variations in BT’s market share across different regions. As a result, the provided counts represent estimates of the true footfall (or ambient population) rather than just BT users.
BT mobile phone activity variables.
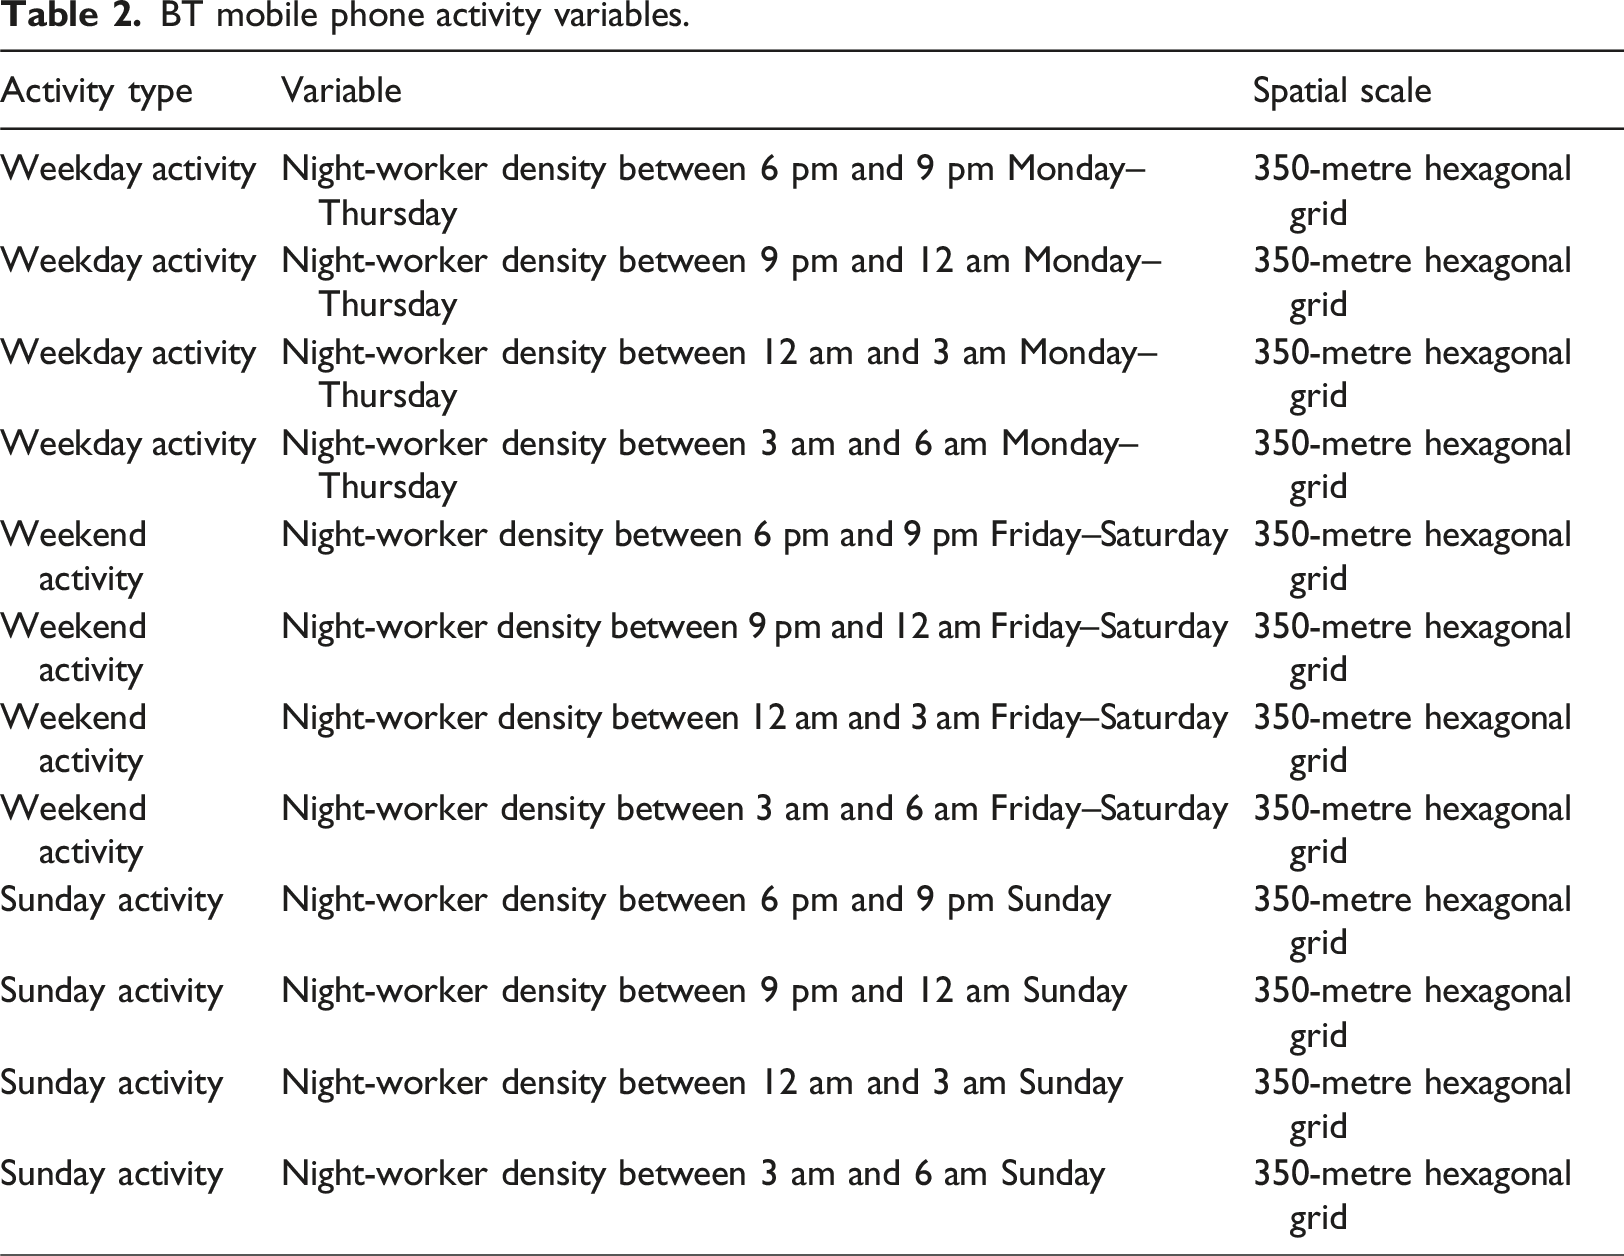
Figure 1 presents the average number of workers within each 350-metre hexagonal grid for January 2024 across all days of the week by time window. Similar spatial patterns are observed across the time windows, although the volume of night-workers declines throughout the night, with the lowest numbers recorded between 3 am and 6 am. Central London emerges as the major hotspot for night-worker activity. However, high levels of activity are also evident in employment clusters located outside of central London. Notably, during the 12 am to 6 am time windows, worker activity is higher in the eastern parts of the city compared to the western parts, suggesting potential regional differences in night-time working patterns. Average number of night-time workers by 350-metre hexagonal grid by 3-h block.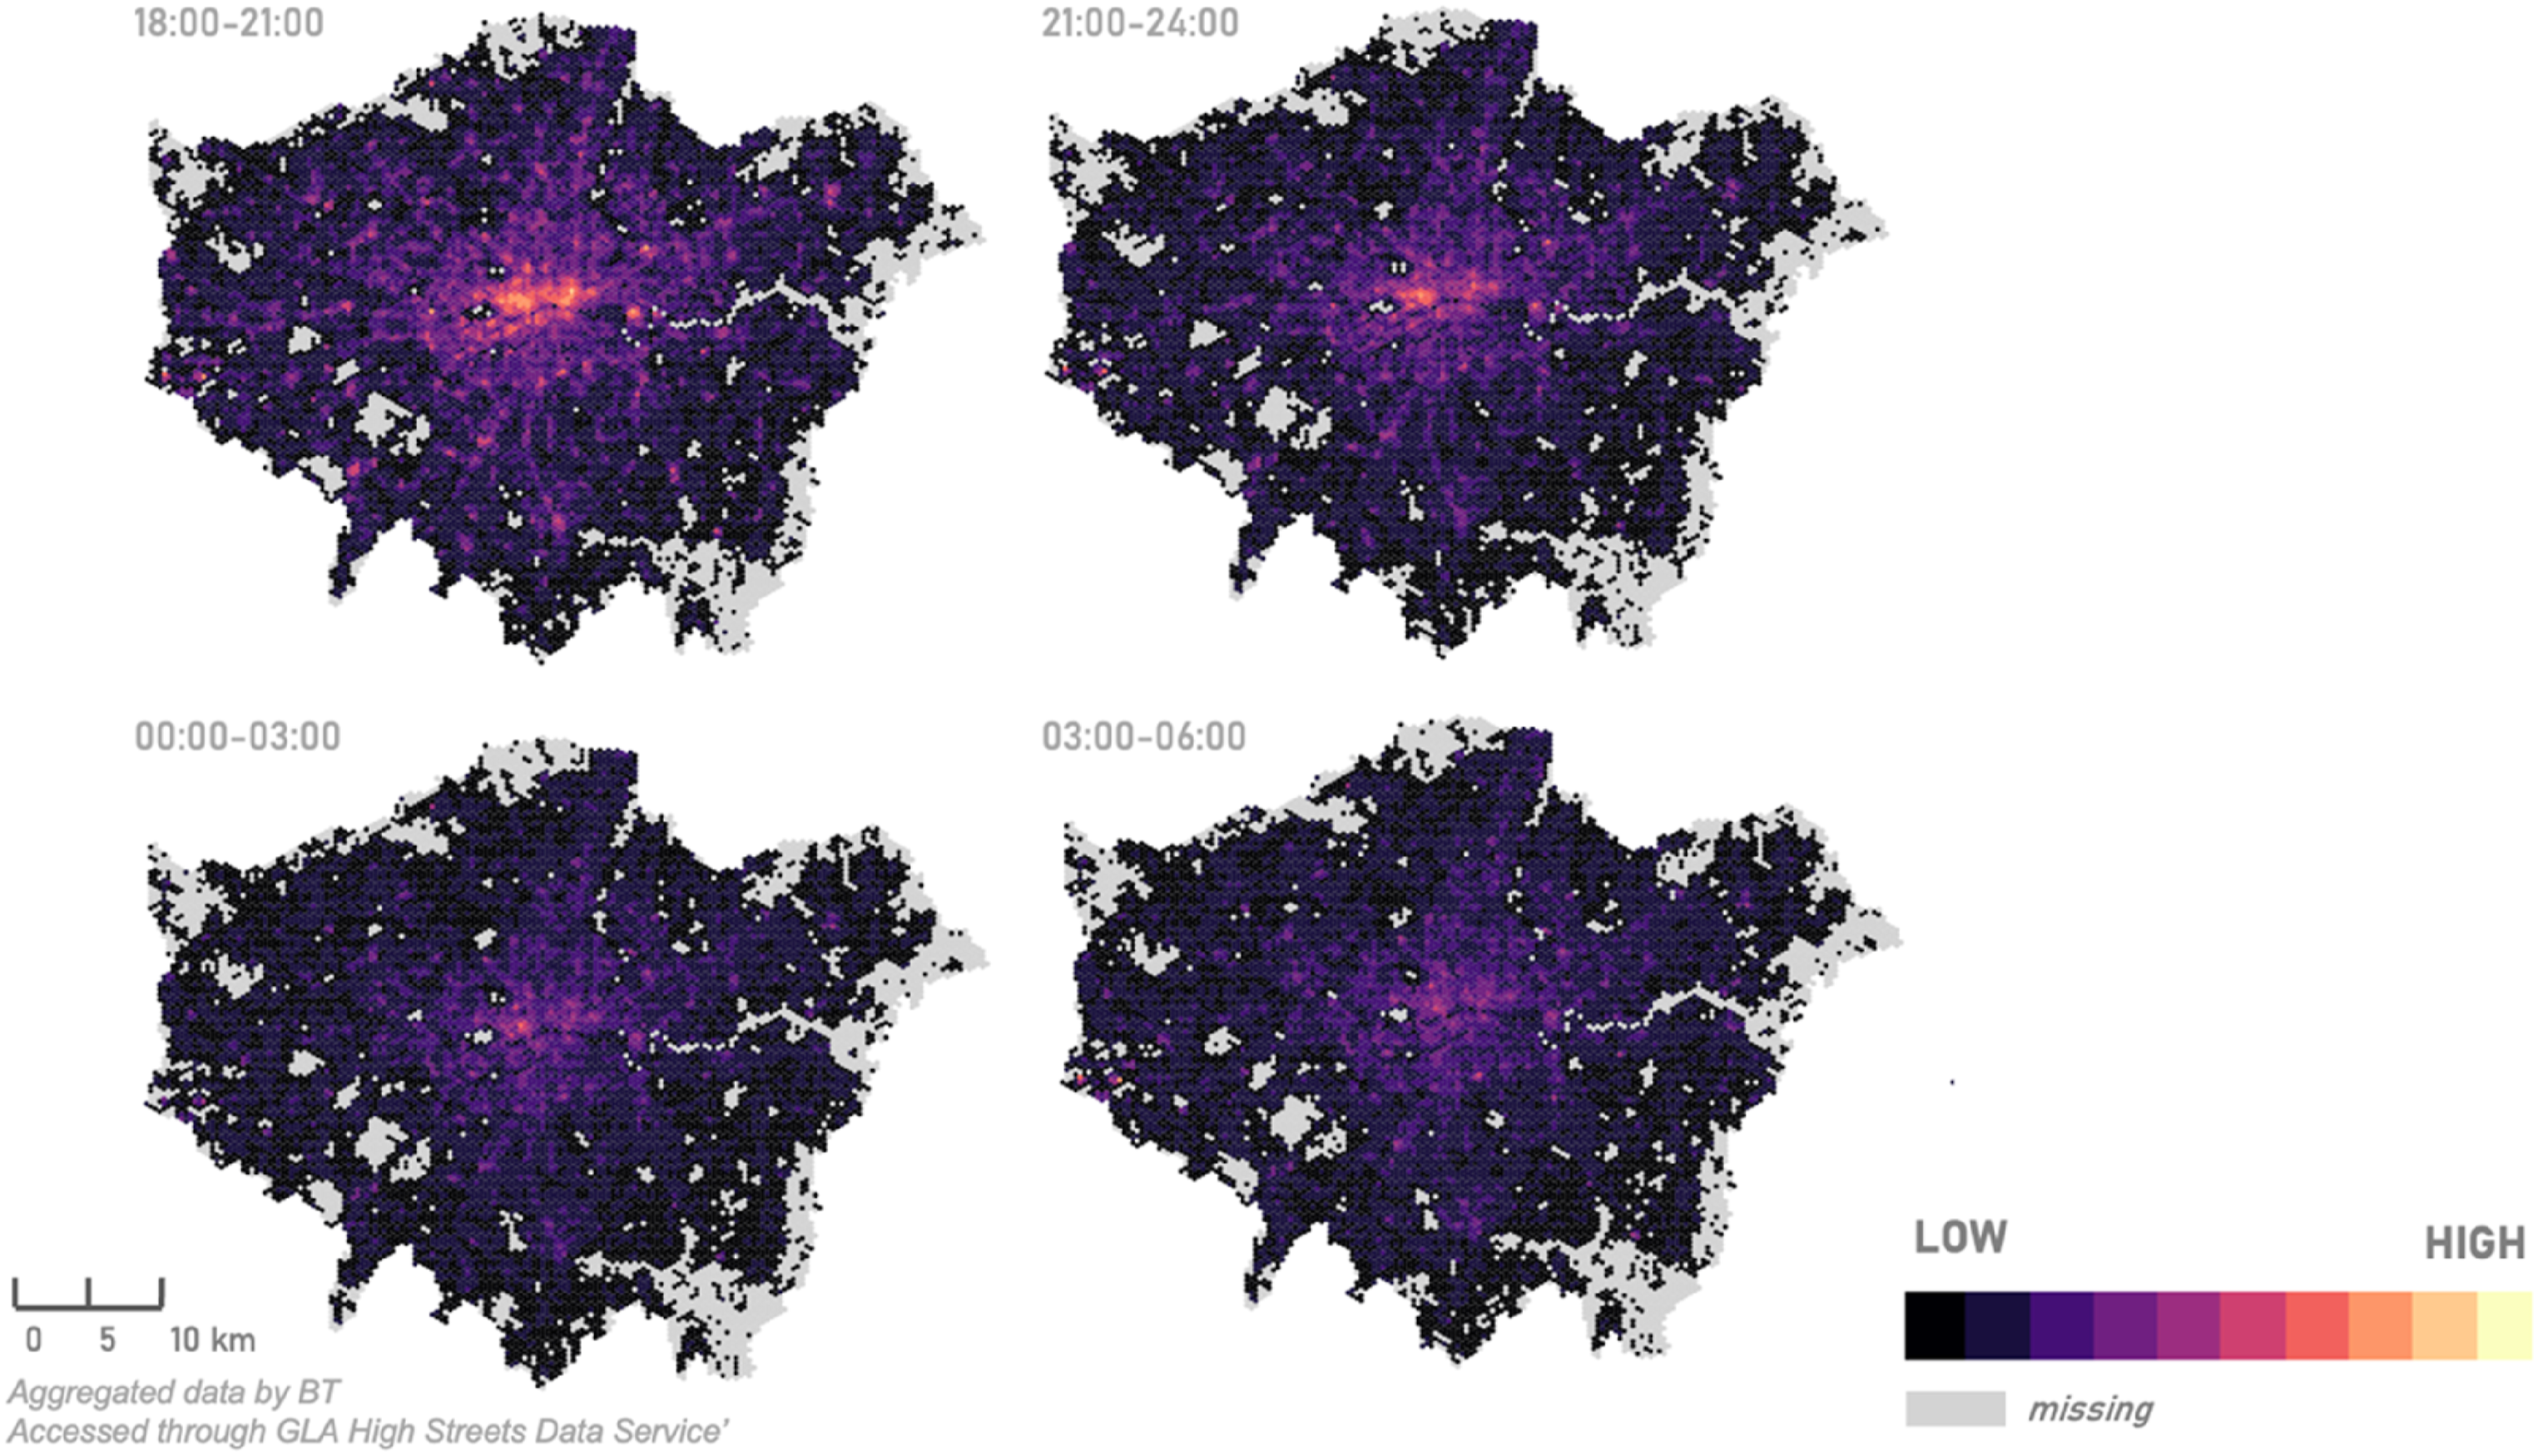
To align the gridded mobile phone activity data with the census and administrative geography of the employment variables, we proportionally assign the hexagons to the LSOAs with which they intersect. Figure 2 illustrates this procedure. For instance, if a total footfall of 100-night-workers is recorded within a hexagon that intersects with three LSOAs, these night-workers are assigned proportionally to these three LSOAs based on the degree of overlap. So, if 35% of a hexagon falls within ‘LSOA 1’, 35-night-workers will be assigned to that LSOA. The total number of people assigned to each LSOA is therefore the sum of all hexagons contributing to that LSOA. Proportional assignment of hexagonal footfall estimates to LSOAs.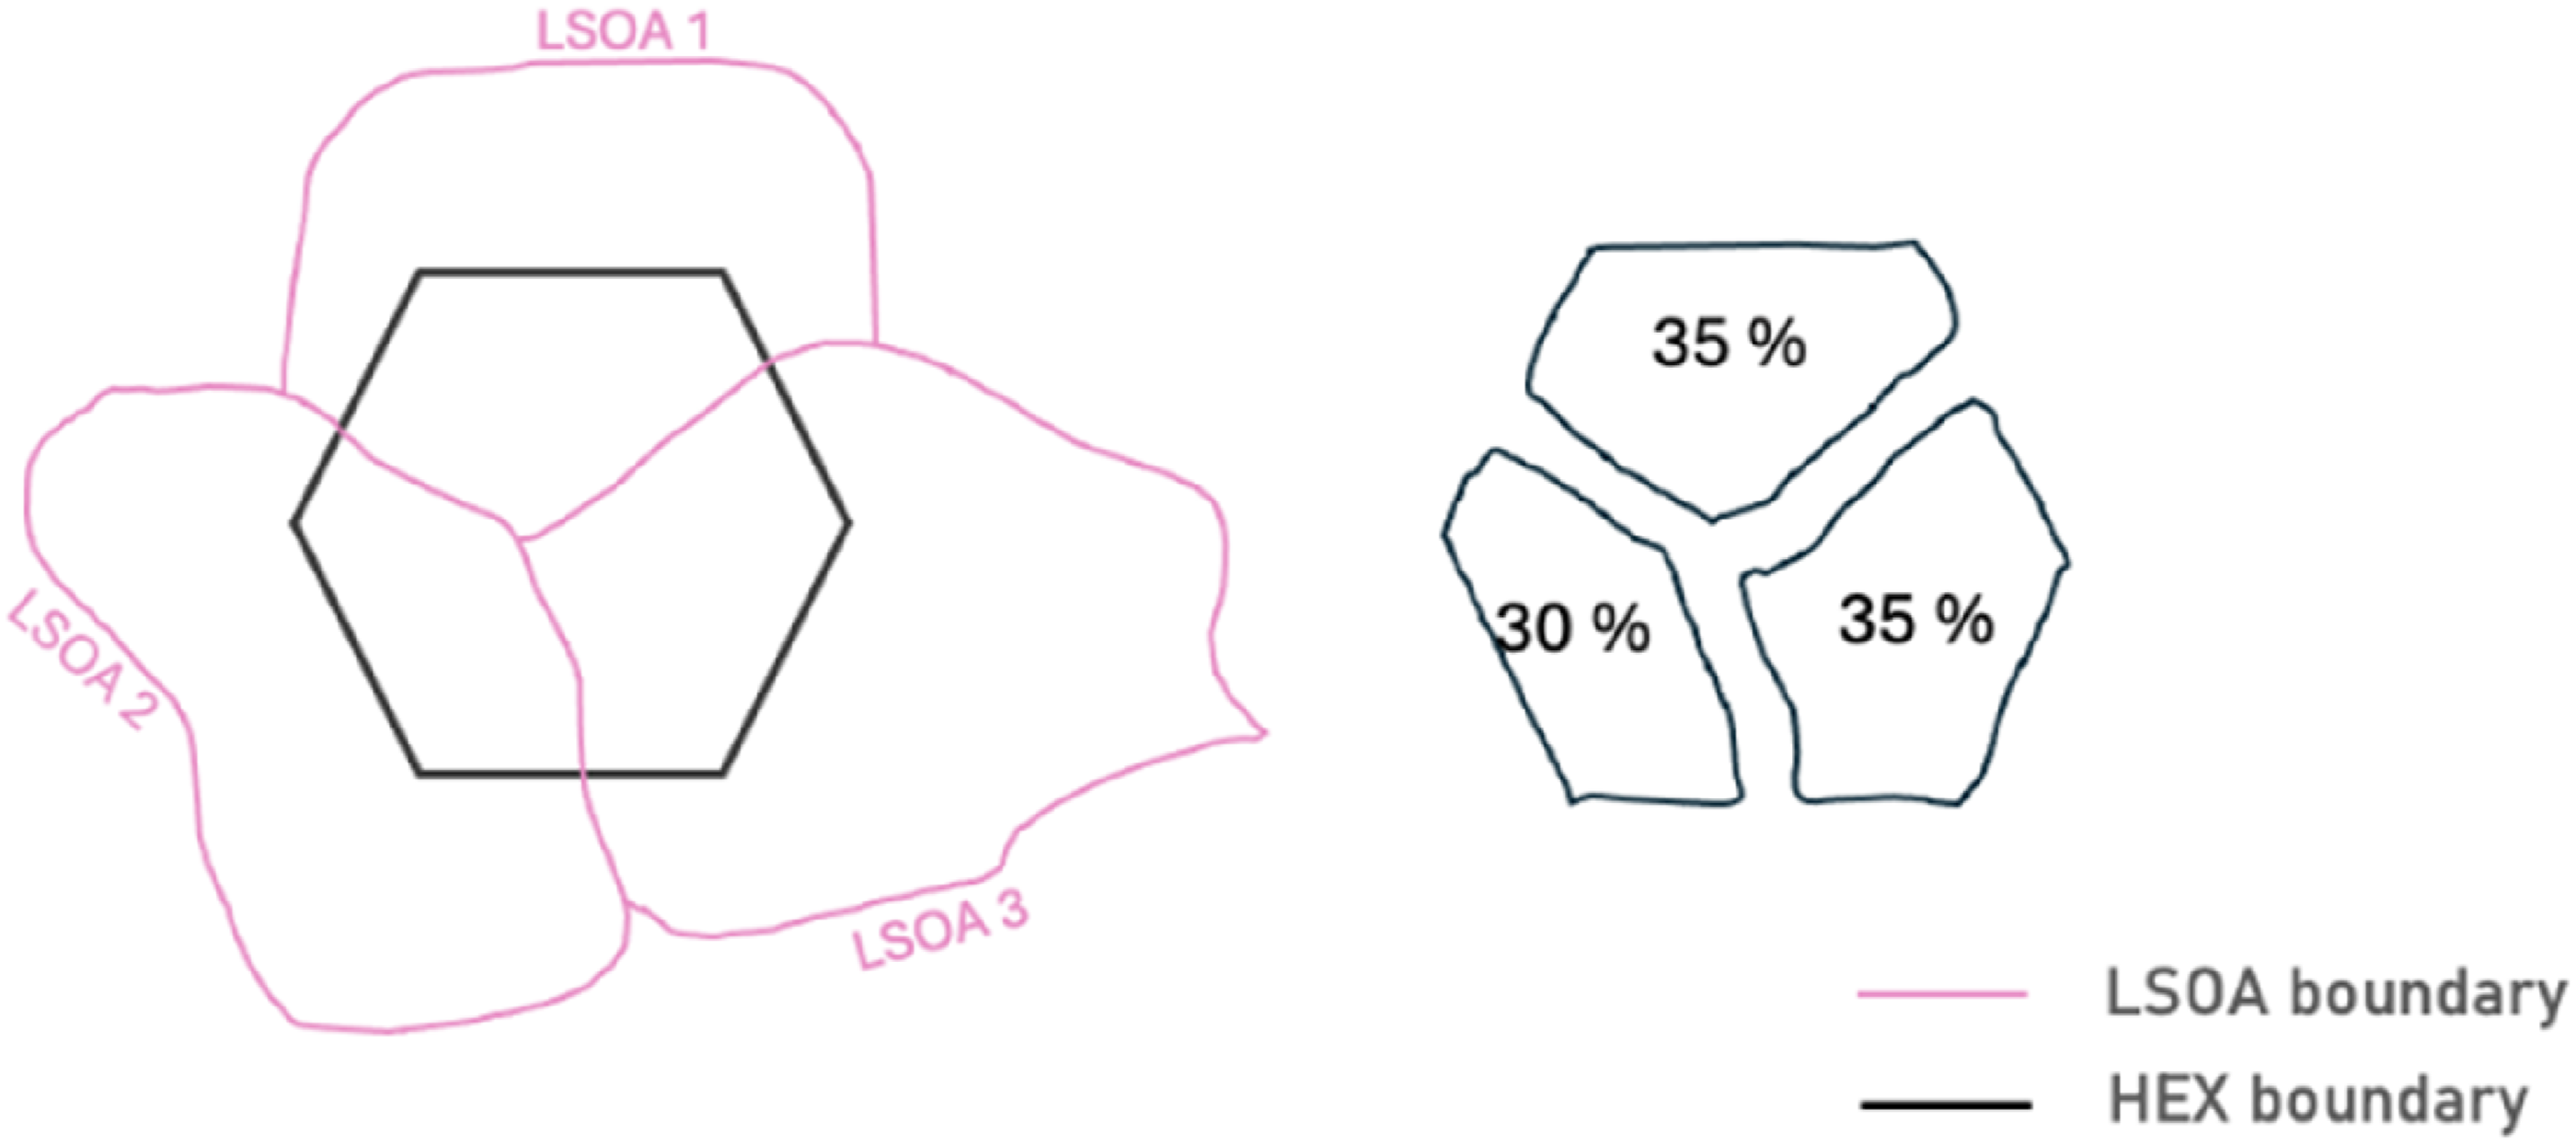
Clustering methodology
Following variable selection, the LNC methodology builds on a range of well-established geodemographic classifications (see Cockings et al., 2020; Gale et al., 2016; Singleton et al., 2020; Vickers and Rees, 2007; Wyszomierski et al., 2024).
Data preparation
In a first step, we prepared the data for clustering by normalising and standardising the variables to ensure comparability. To account for the non-uniformity of the areal units, BT footfall and business counts were converted to counts per square kilometre (km2). Using boxplots, Figure 3 presents the distribution of variables prior to transformation, grouped by domain. All variables exhibited positive skewness, but the BT footfall variables displayed a larger interquartile range (IQR), generally consisted of higher values across LSOAs and had a less pronounced skew than the business variables. The variables with the most extreme outliers were retail businesses per km2, weekday workers between 6 pm and 9 pm, and weekend workers between 6 pm and 9 pm. Variable distribution before transformation for (a) BT footfall and (b) Business variables. Extreme outliers have been removed.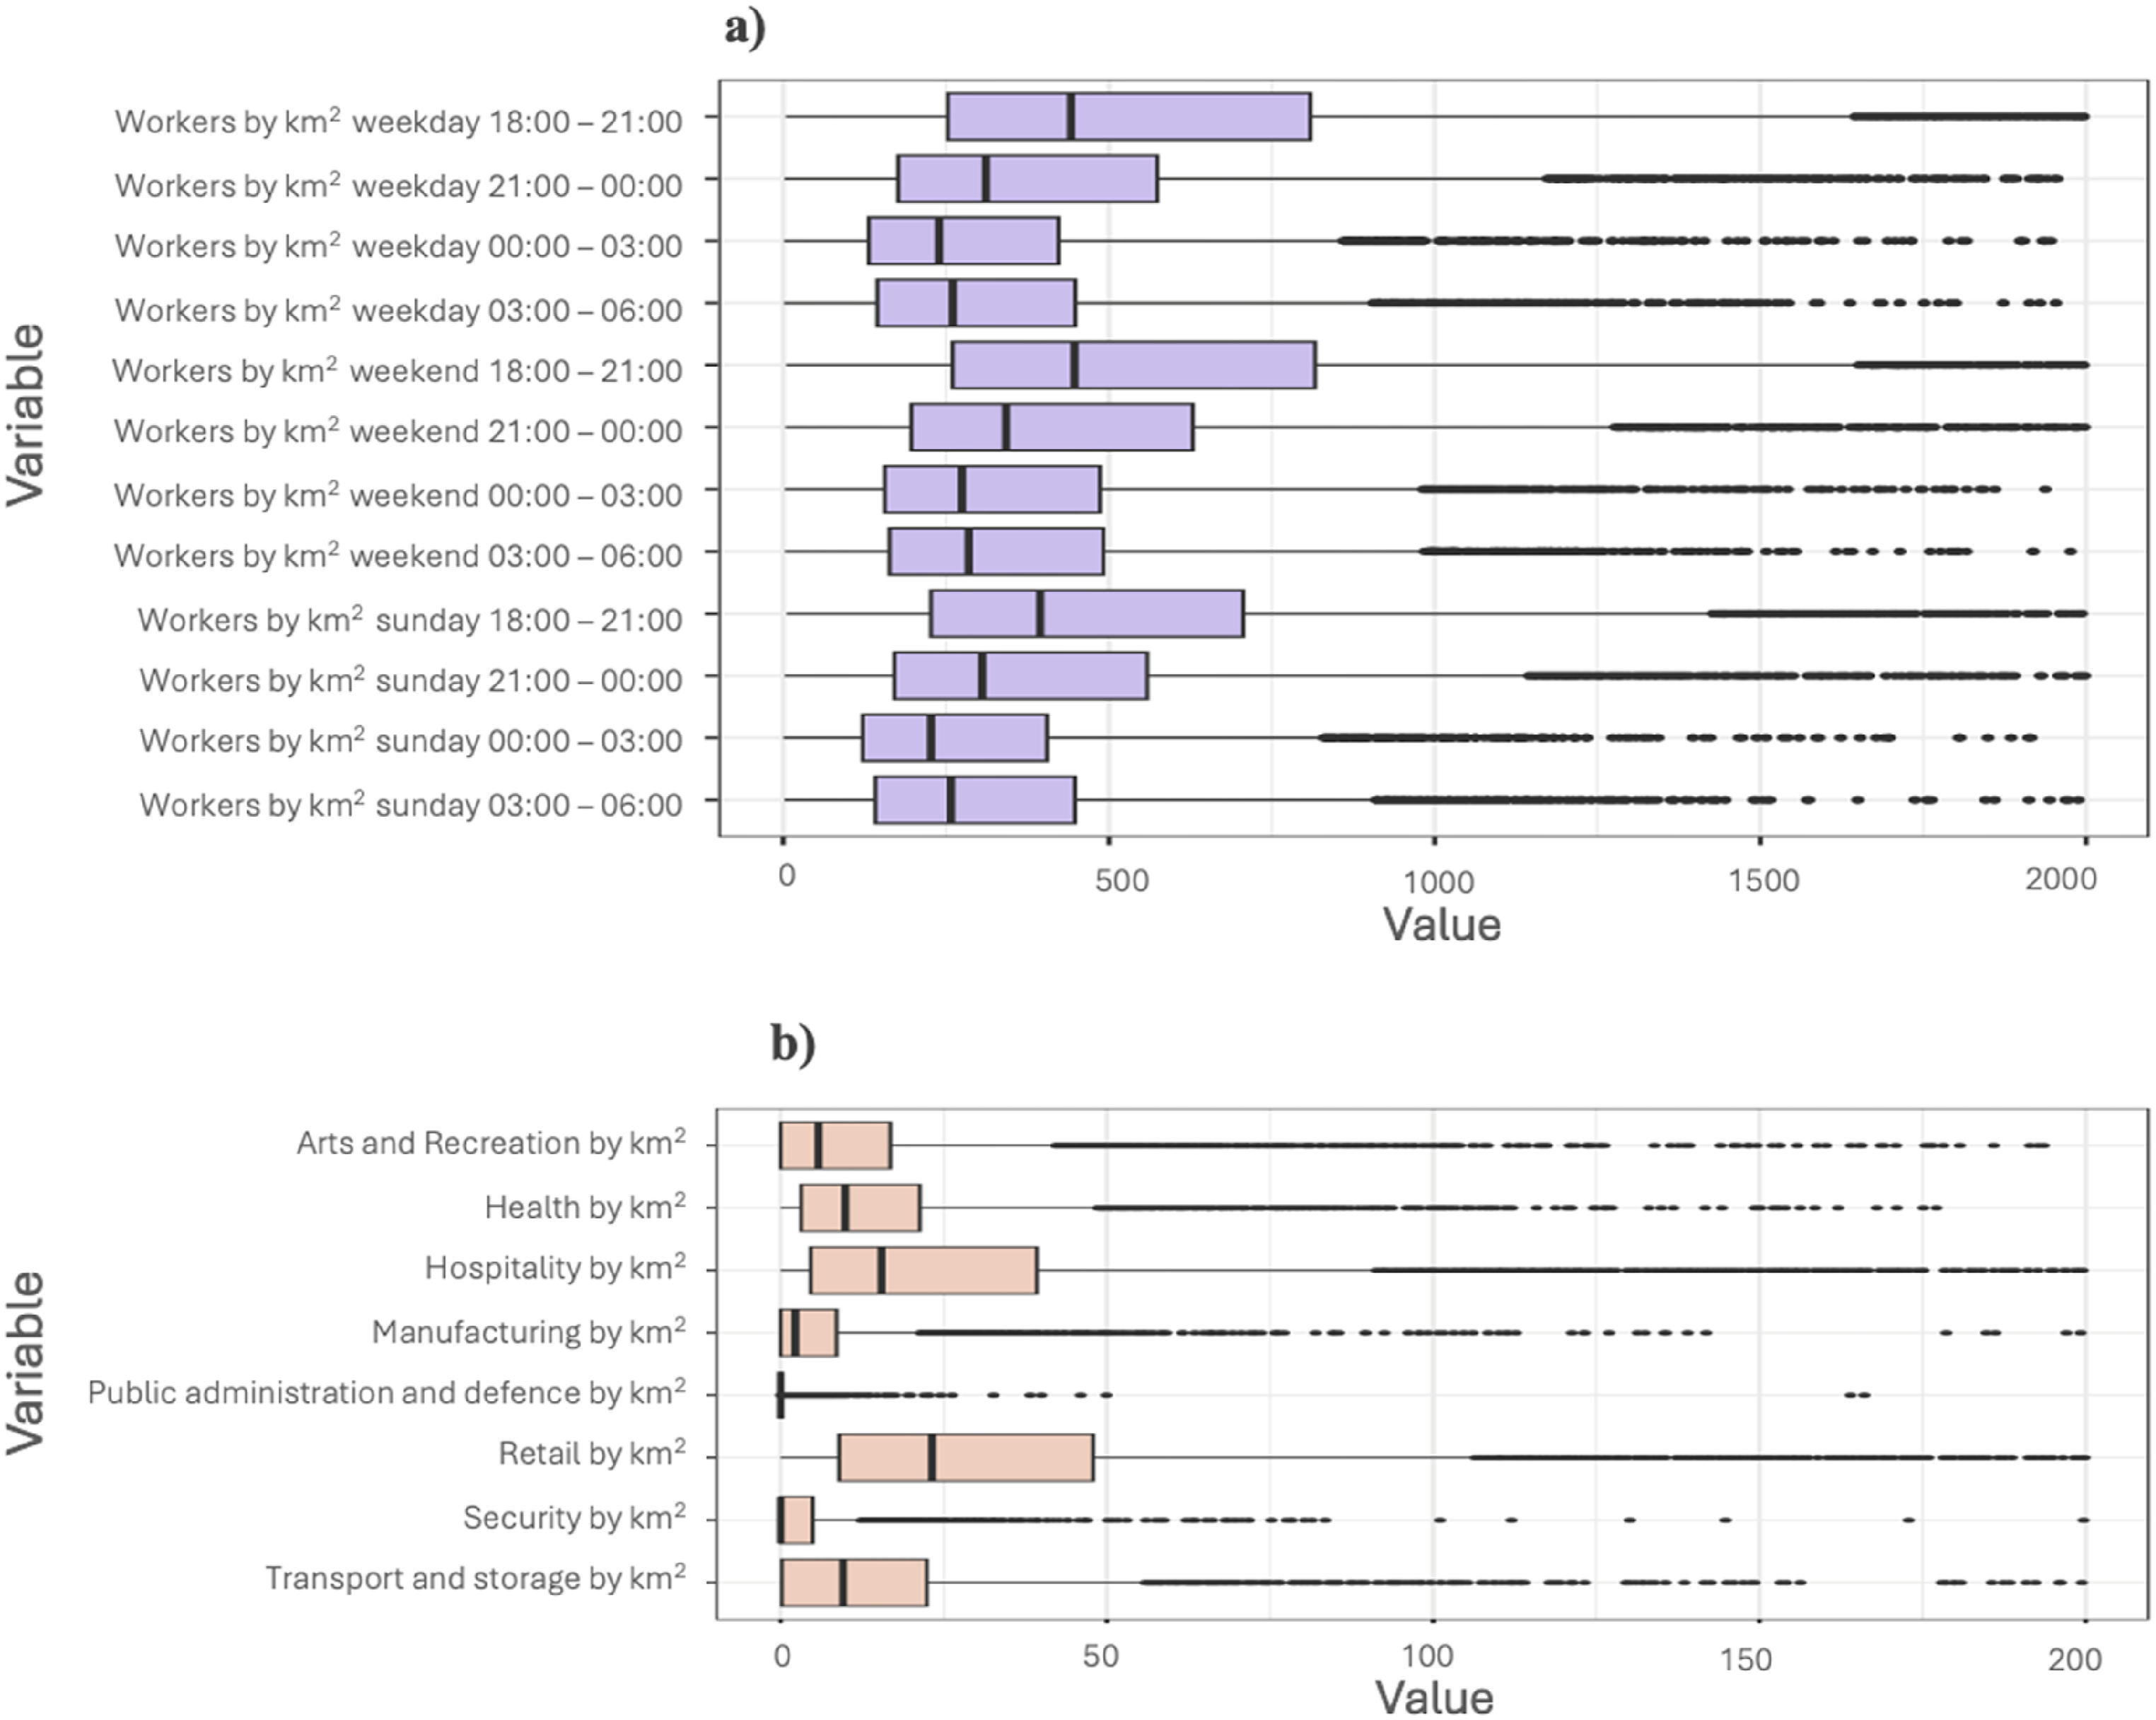
Next, we applied an Inverse Hyperbolic Sine (IHS) transformation method to ensure the normality of the variables (cf. Gale et al., 2016; Vickers and Rees, 2007; Wyszomierski et al., 2024). Figure 4 illustrates the distribution of all variables following the transformation. All variables now appear normally distributed, albeit that some of the employment variables contain zero values. However, we decided to keep these in the final pool of variables because it showed up in the city-wide survey of night-workers and their employers as one of the night-worker business categories. Variable distribution after transformation for (a) BT footfall and (b) Business variables.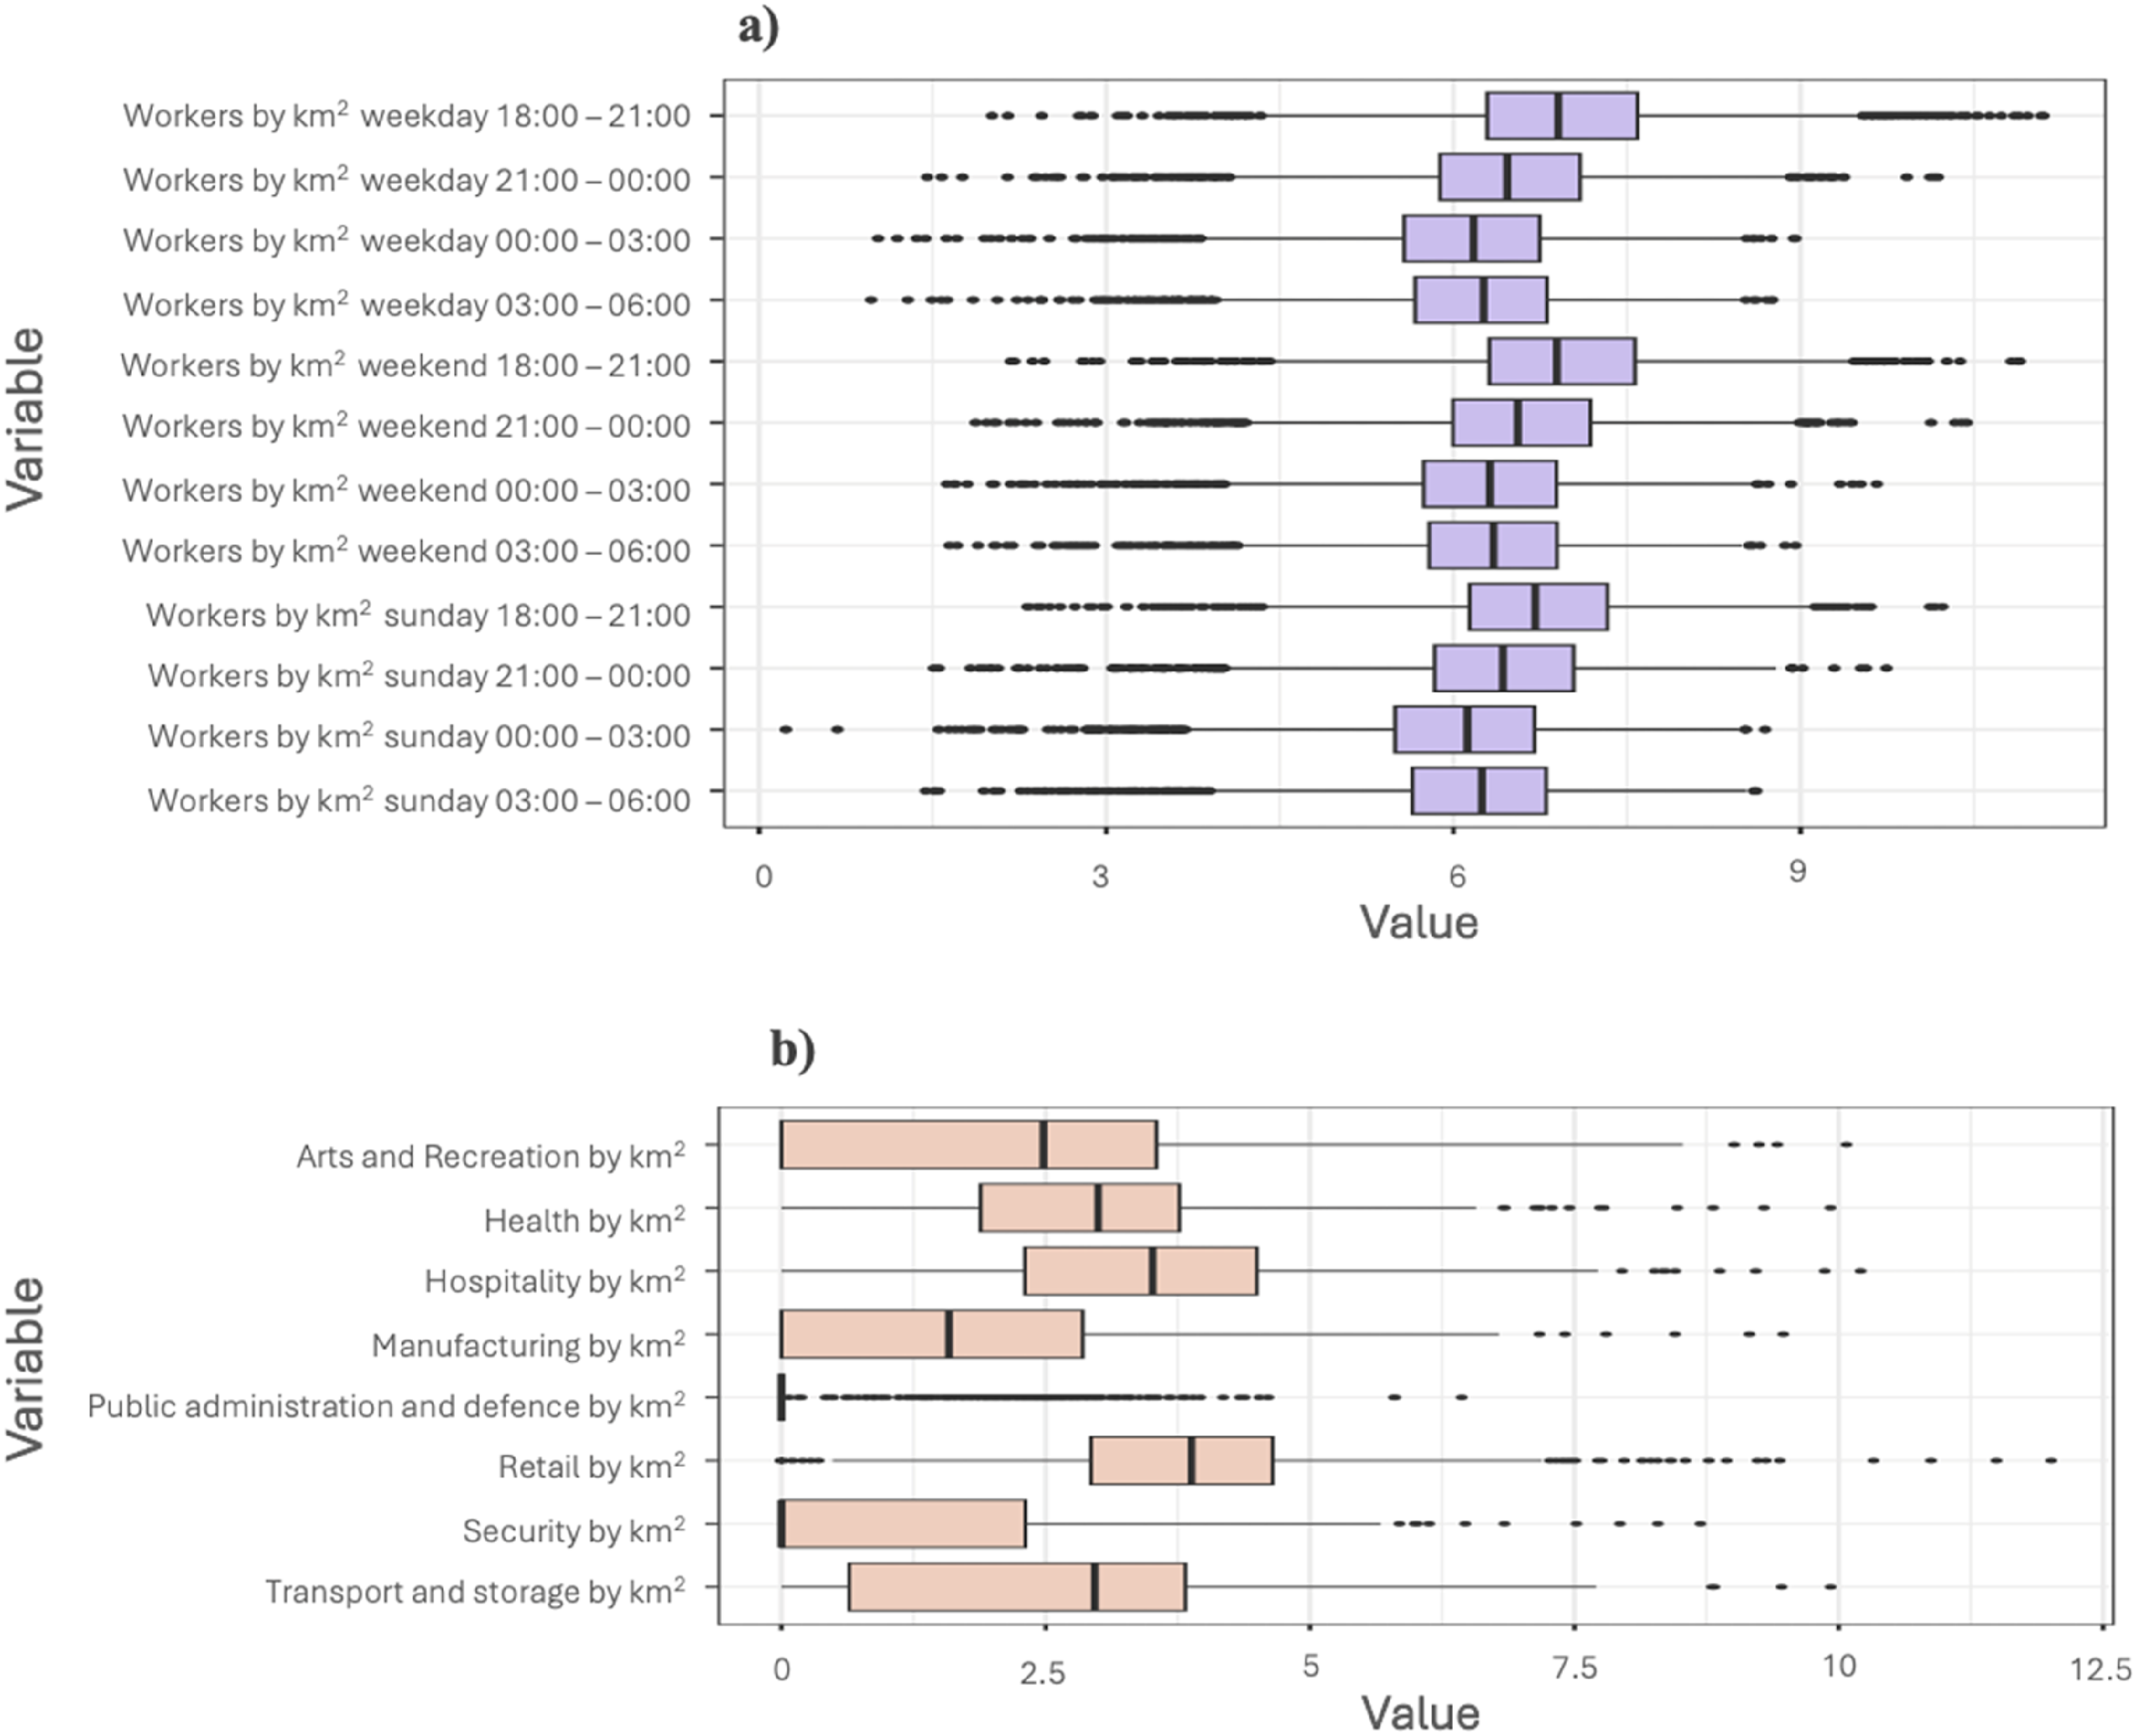
We subsequently range-standardised all variables to place them on a common scale from 0 to 1. To assess potential multicollinearity, pairwise correlations were examined. Correlations above ±0.6 were reviewed, following the approach used in previous classifications (Gale et al., 2016), and none exceeded 0.7. While there is no fixed rule for defining multicollinearity, correlations above 0.6 are generally considered strong and those between 0.66 and 0.8 very strong (cf. Wyszomierski et al., 2024). We therefore applied 0.7 as a practical upper limit to flag very strong relationships. Some variables with moderate or strong correlation were retained for conceptual reasons, consistent with established practice in geodemographic work.
Clustering
Following data preparation, clustering analysis was conducted in Python version 3.9.7 using the scikit-learn library to group output areas with the greatest similarity based on the selected variables (Pedregosa et al., 2011). In line with past geodemographic classification research, and in recognition of its ability to efficiently partition large datasets, we used k-means clustering. While alternative clustering methods such as fuzzy c-means, or neural network-based approaches offer certain advantages, we chose k-means for several reasons. Fuzzy clustering allows observations to belong to multiple clusters and can capture real-world irregularities, providing a probabilistic measure of cluster membership (see Fisher and Tate, 2015). However, it introduces variability between iterations and is highly sensitive to the initial cluster number and centroids, which can reduce reproducibility. Neural network-based methods (see De Sabbata and Liu, 2023) can account for spatial dependencies and handle complex, dynamic datasets, but they require substantially greater computational resources and are less interpretable, which can limit their suitability for policy-driven applications. K-means, by contrast, is computationally efficient for large datasets, deterministic, and produces clusters that are readily interpretable, allowing clear mapping of geographic areas. Given the combination of conventional and dynamic datasets used in this study, k-means provides a practical and robust method that balances computational feasibility, interpretability, and policy relevance, while remaining aligned with established practices in geodemographic classifications (Gale et al., 2016; Harris et al., 2005).
To determine the optimal number of clusters (k), a clustergram was used to visualise the redistribution of data as additional clusters are introduced (Wyszomierski et al., 2024). A clustergram (Fleischmann, 2023; Schonlau, 2002) visualises how observations move between-clusters across a range of solutions, allowing us to observe the hierarchical behaviour of the data and shifts in cluster membership, providing insight into both compactness and interpretability. Figure 5 illustrates the variation between cluster solutions and the partitioning of data across different cluster counts, seeking to maximise between-cluster variation with each additional cluster. A solution with seven clusters was selected as the most appropriate based on its ability to balance compactness (the degree of similarity within clusters) and interpretability (how clearly the clusters can be understood and applied) while avoiding overfitting. This decision was guided by the trade-off between achieving sufficient data partitioning and maintaining well-separated clusters. More importantly, the final classification was guided by extensive consultations with possible users of the classification, not least the GLA who were keen to ensure a robust classification that enabled actionable policy. Clustergram of component distribution by number of clusters.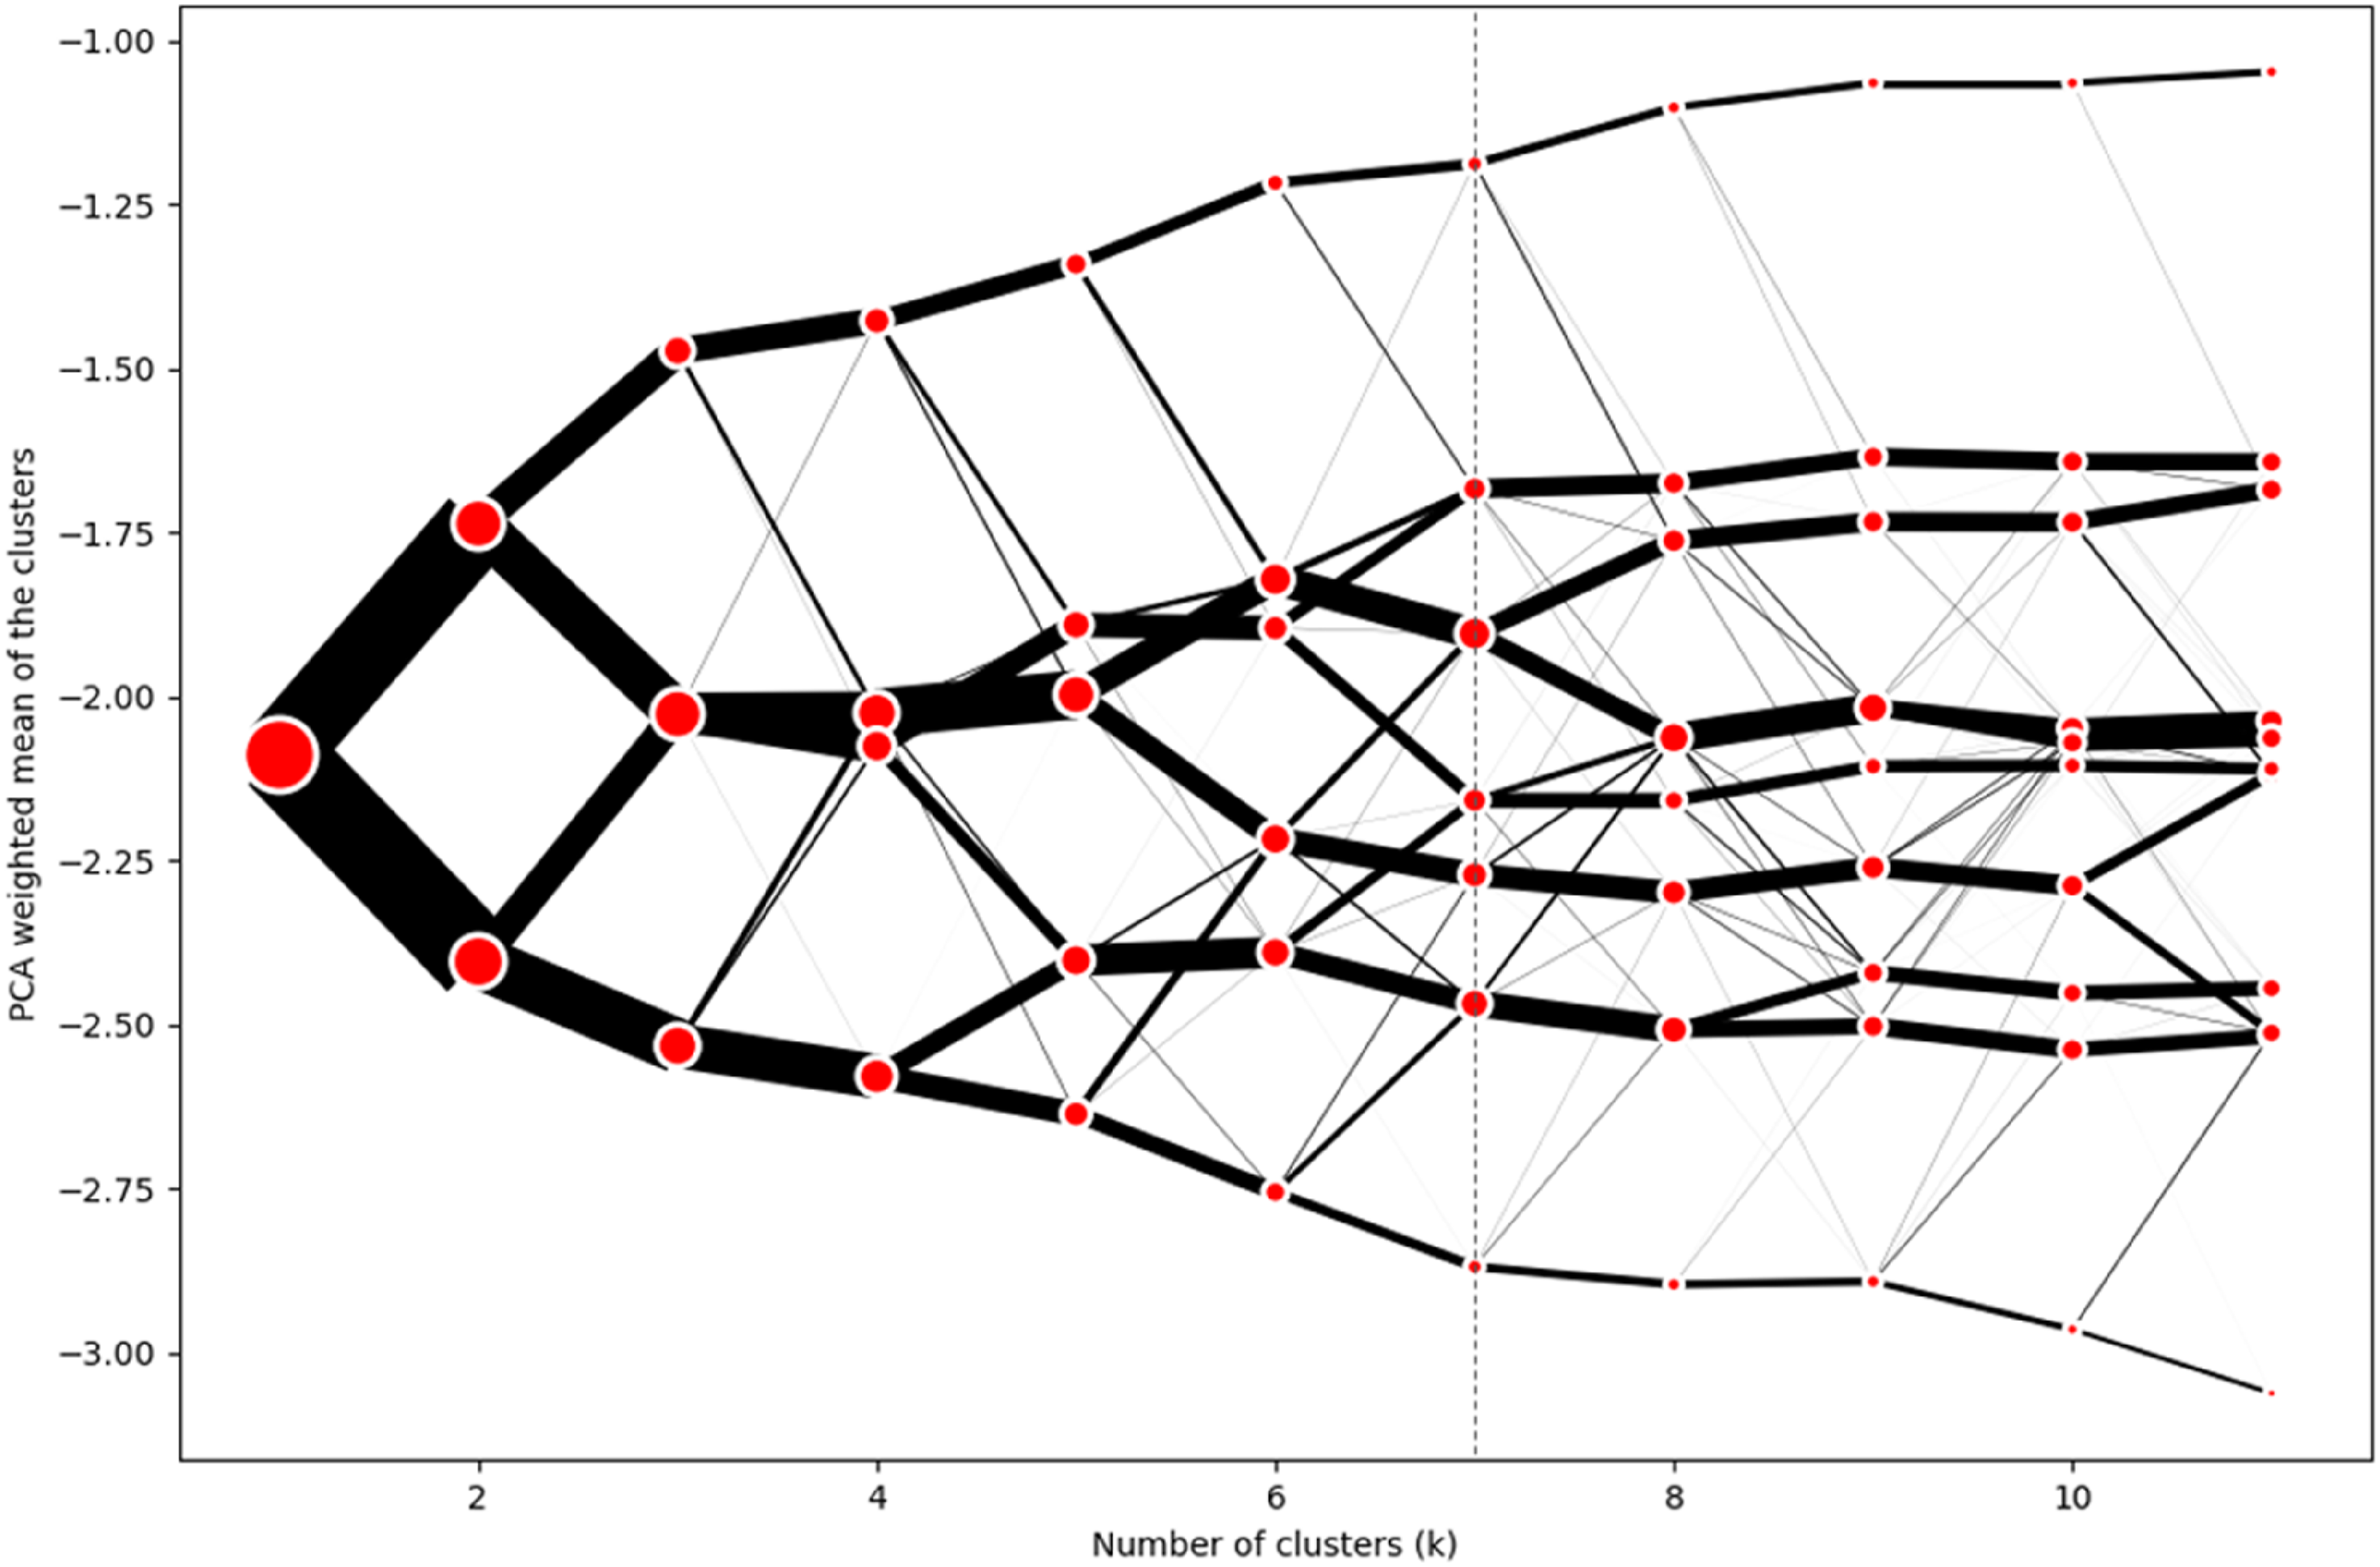
Whilst Figure 5 shows that there is clear stability in how data is redistributed between successive cluster solutions, cluster sensitivity was evaluated further by comparing solutions generated with different values of k. While the 7-cluster solution was selected as the most appropriate, an alternative 8-cluster solution also provided reasonable partitions of the data. To assess the stability of cluster assignments across these alternatives, cross-tabulations of membership were examined. The analysis showed that several clusters were highly stable, whilst the clusters with the lowest correspondence are the ones broken down to re-assign to the new cluster. In particular, the additional cluster in the 8-cluster solution was formed by redistributing subsets of three clusters from the 7-cluster solution, indicating that it represented a sub-division rather than an entirely new structure. This indicates that the overall clustering structure was robust, and that the choice of the 7-cluster solution reflects a balance between statistical validity and the interpretability required for the study’s objectives.
Additional steps were taken for internal validation, including examining the sensitivity of the clusters to the random seed parameter. Different random seeds were used to assess how cluster assignments might change due to the randomness inherent in k-means initialisation. Setting a random seed ensures reproducibility, while testing multiple seeds allows evaluation of the stability of the clustering solution. To quantify this stability, the Adjusted Rand Index (ARI) was calculated for all pairwise combinations of clustering solutions obtained from different seeds. The ARI measures the similarity between two solutions, regardless of the actual cluster labels assigned (Zhang et al., 2012). Its values range from −1 to 1, where 1 indicates perfect agreement, 0 corresponds to random chance, and negative values indicate worse than random agreement. In this study, ARI values ranged from 0.88 to 0.99, demonstrating a high degree of consistency across different seeds. This indicates that the identified clusters are robust, with only relatively minor variations occurring.
Figure 6 illustrates the contributions of each variable to the cluster allocation, with those above the London average shown in purple, and those below the London average in orange. These scores were derived by calculating the difference between the cluster mean and the global mean for each variable. Therefore, values below zero indicate that the variable’s average within the cluster is lower than the global mean, while values above zero indicate a higher-than-average contribution. For example, Figure 6 further shows that all variable scores in Cluster 7 are substantially lower than the global mean, whereas the opposite is true for Cluster 1. A radar plots for each cluster and their respective distributions of variable values is presented in Appendix C. Variable distribution by cluster compared to the global mean (lower quartile, mean, upper quartile).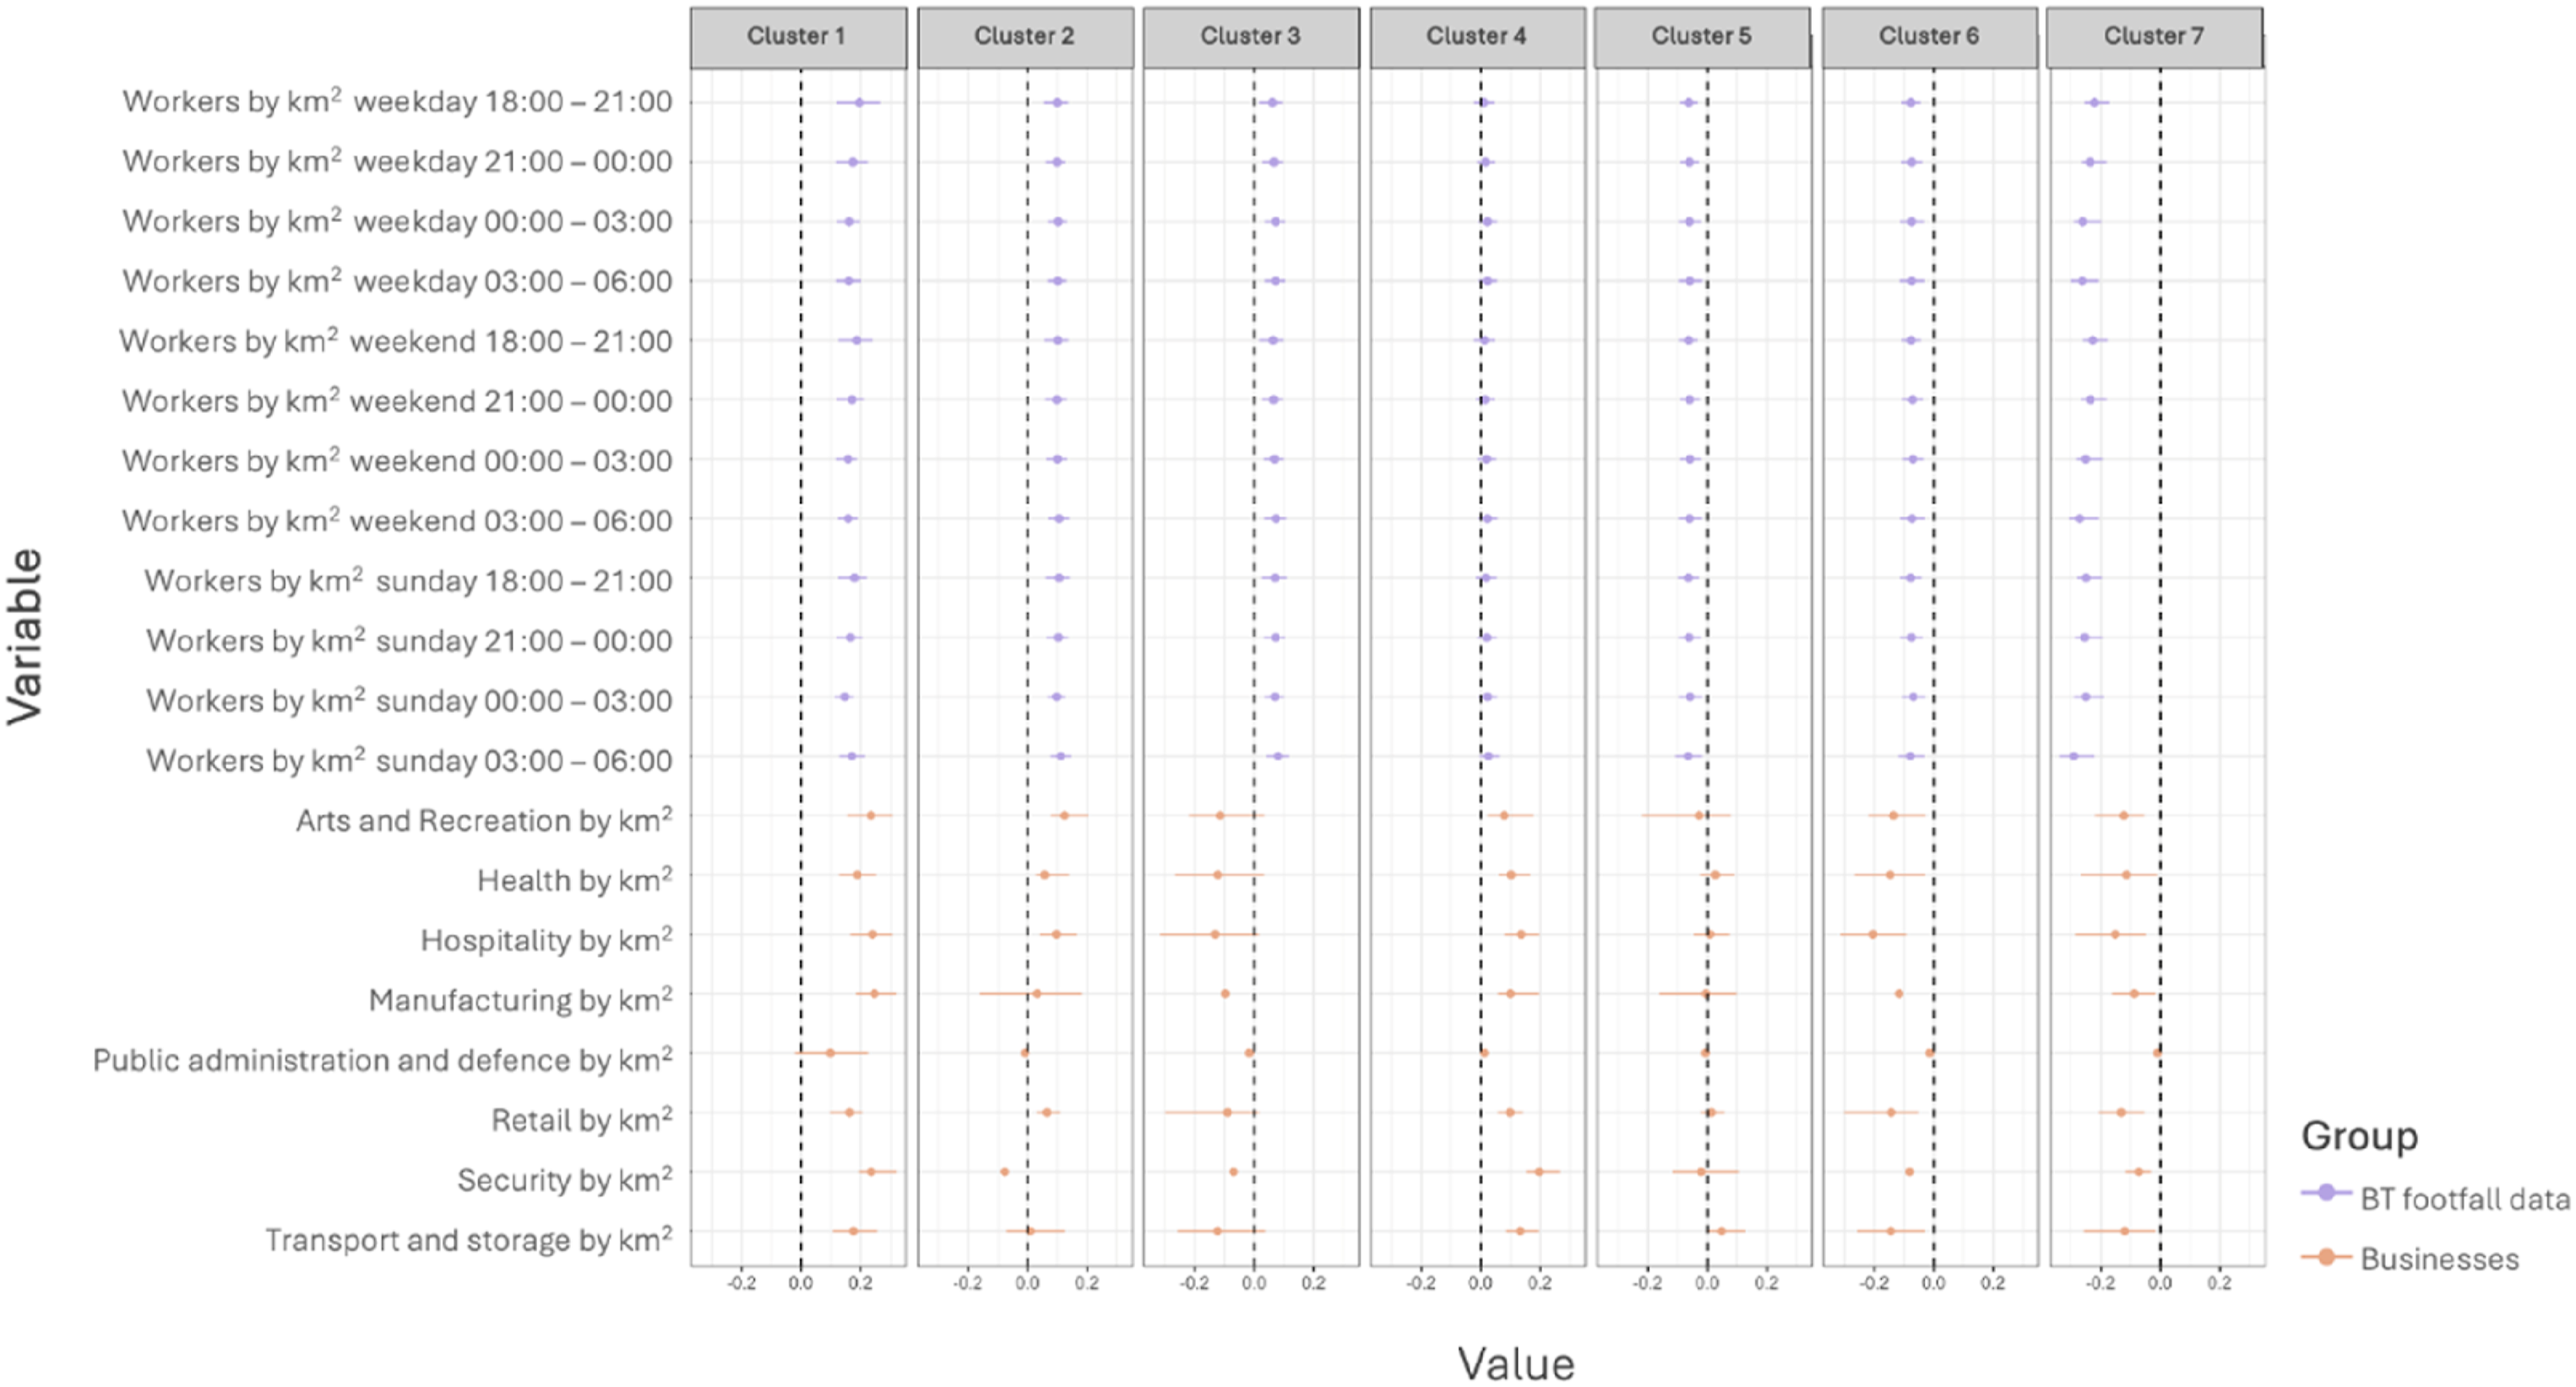
Results
The London night-workers classification
Figure 7 visualises the London Night-worker Classification. An initial examination of the spatial distribution of clusters reveals that central London LSOAs are grouped within the same cluster, reflecting their shared characteristics in night-time working patterns. The spatial distribution of the clusters demonstrates clear differentiation, with a notable pattern of concentric rings emerging. These clusters represent the core central areas as well as the peripheral zones that extend outward from the centre. The clusters also slightly intertwine with each other, highlighting overlaps and transitions in night-time working patterns across different areas. Composite map of the London night-worker classification.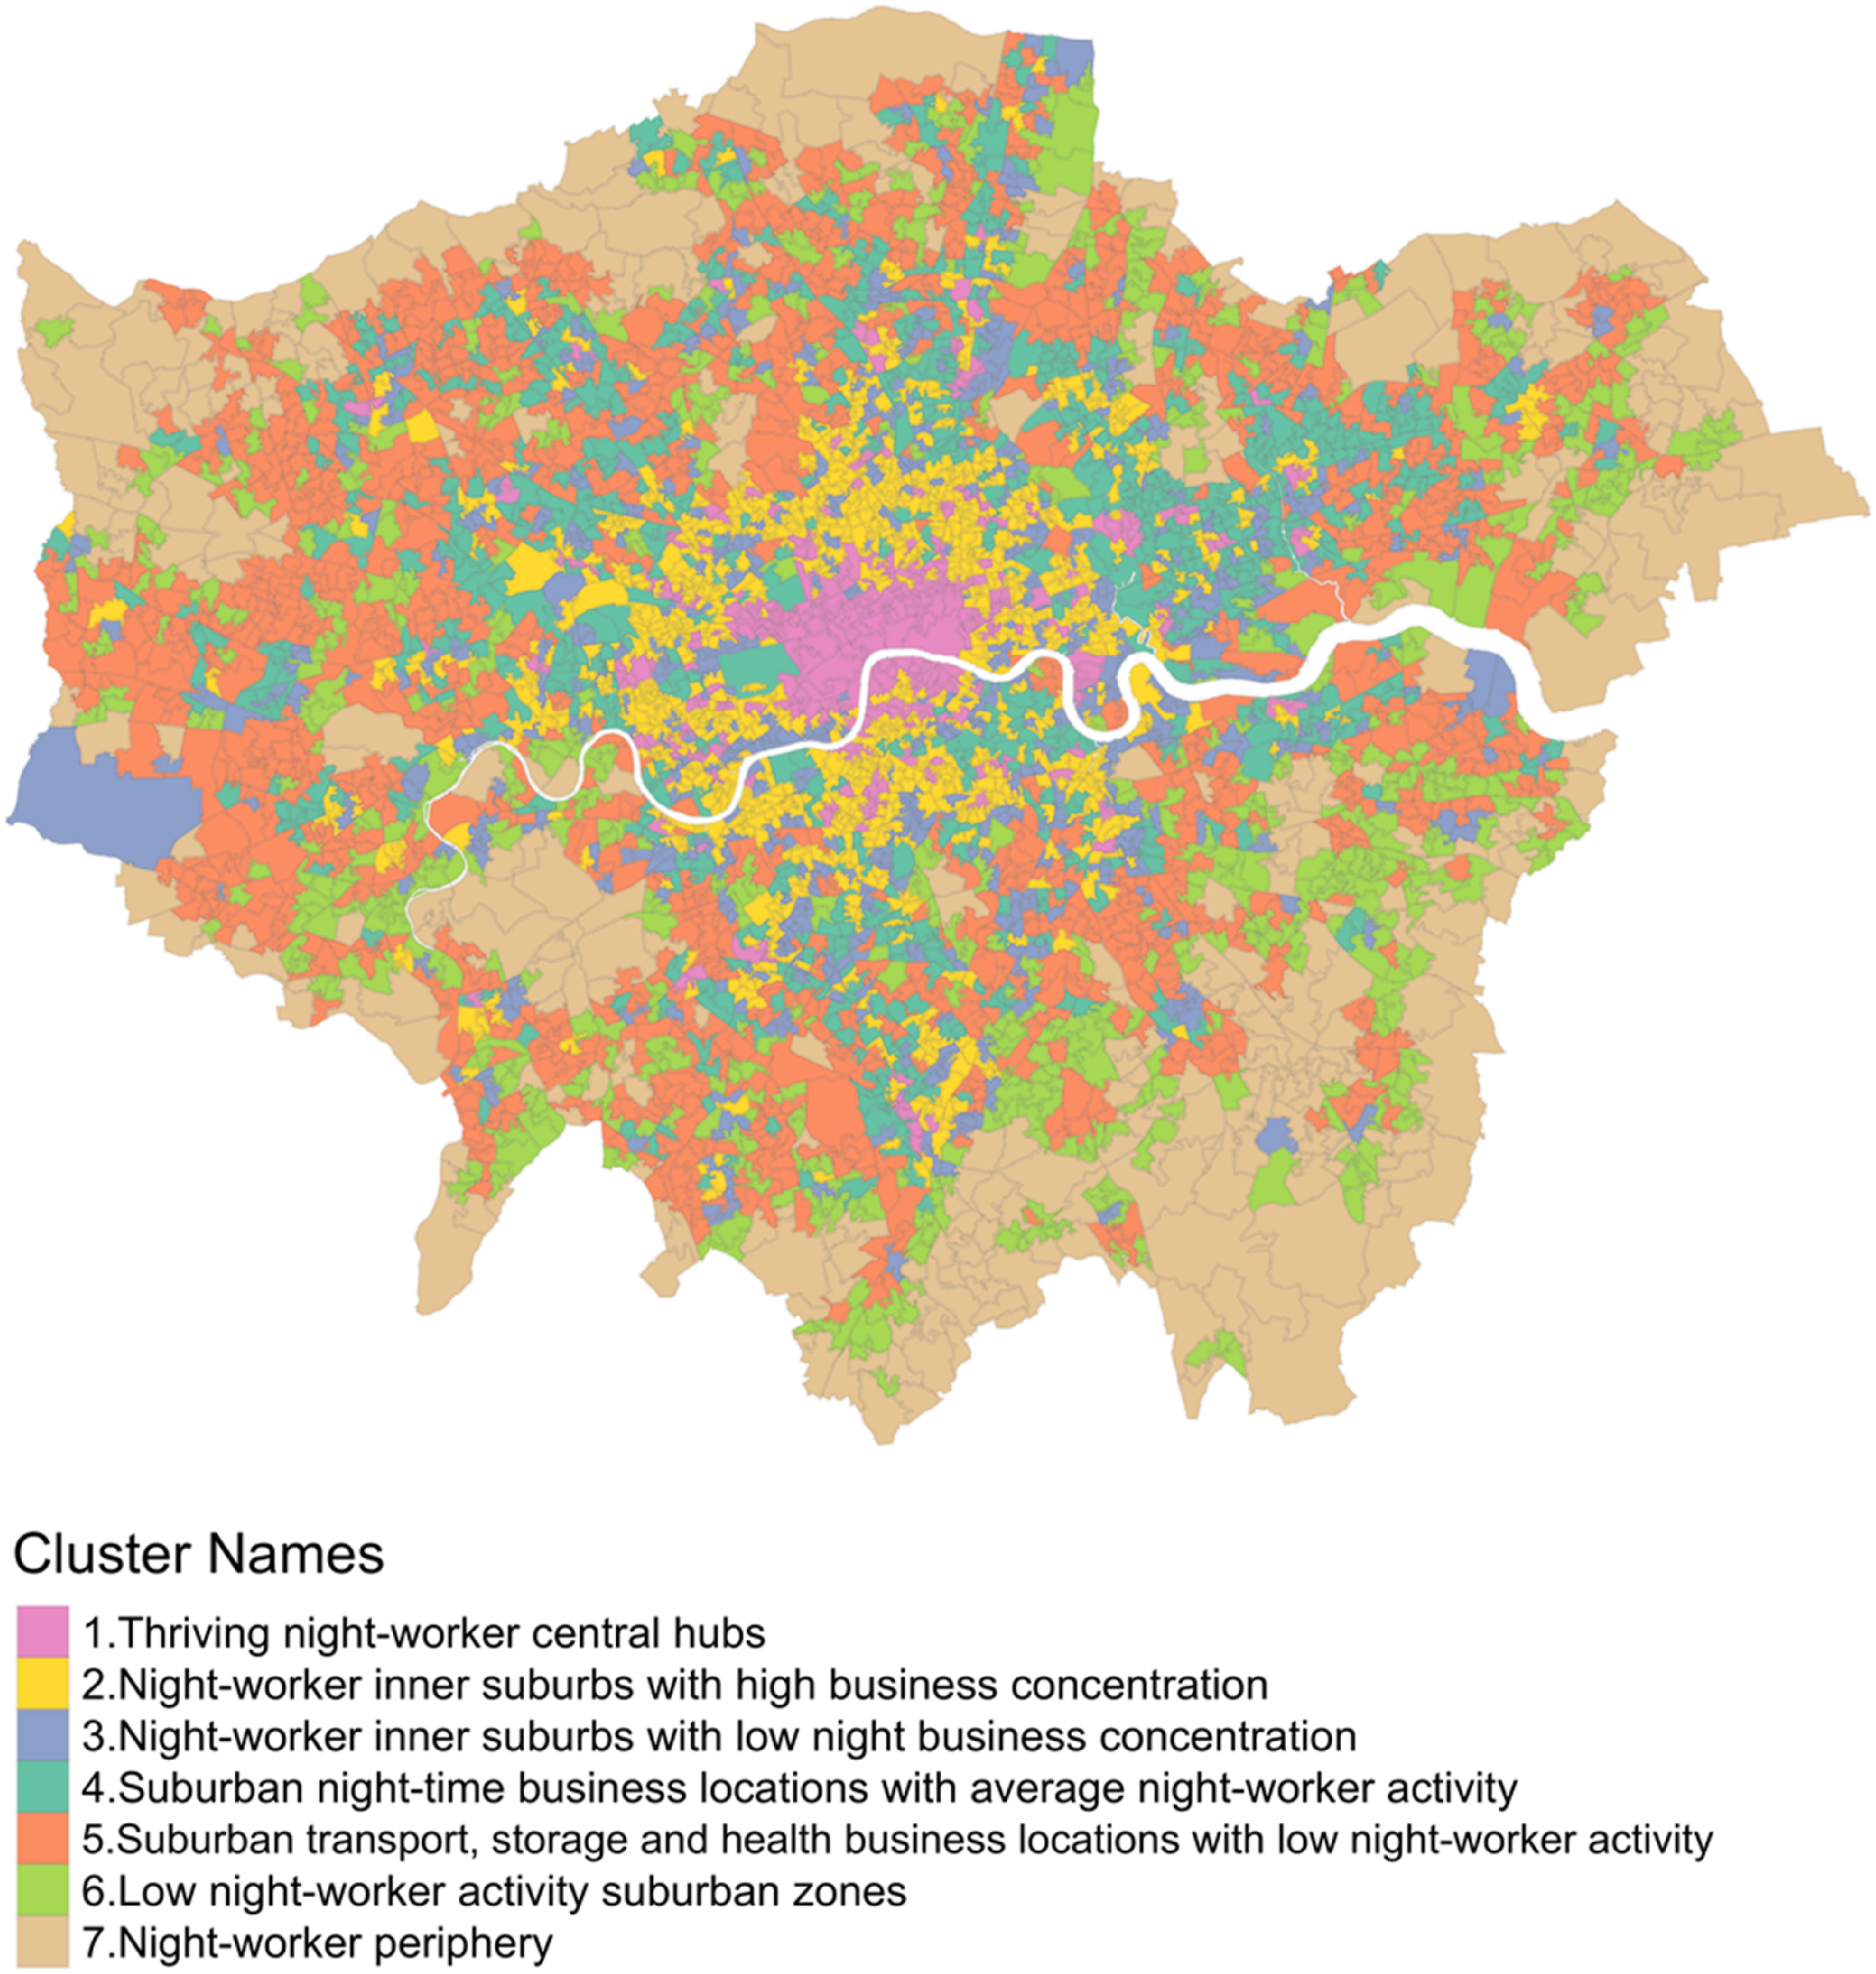
The individual clusters across London are mapped in Figure 8, enabling a visual inspection of their spatial distribution. The final step in developing the classification involves assigning descriptive names and pen-portraits to each cluster by describing the variables that contribute to each cluster. Cluster distribution across Greater London ordered by number of night-workers. Cluster 1 has the most night-workers and Cluster 7 the least.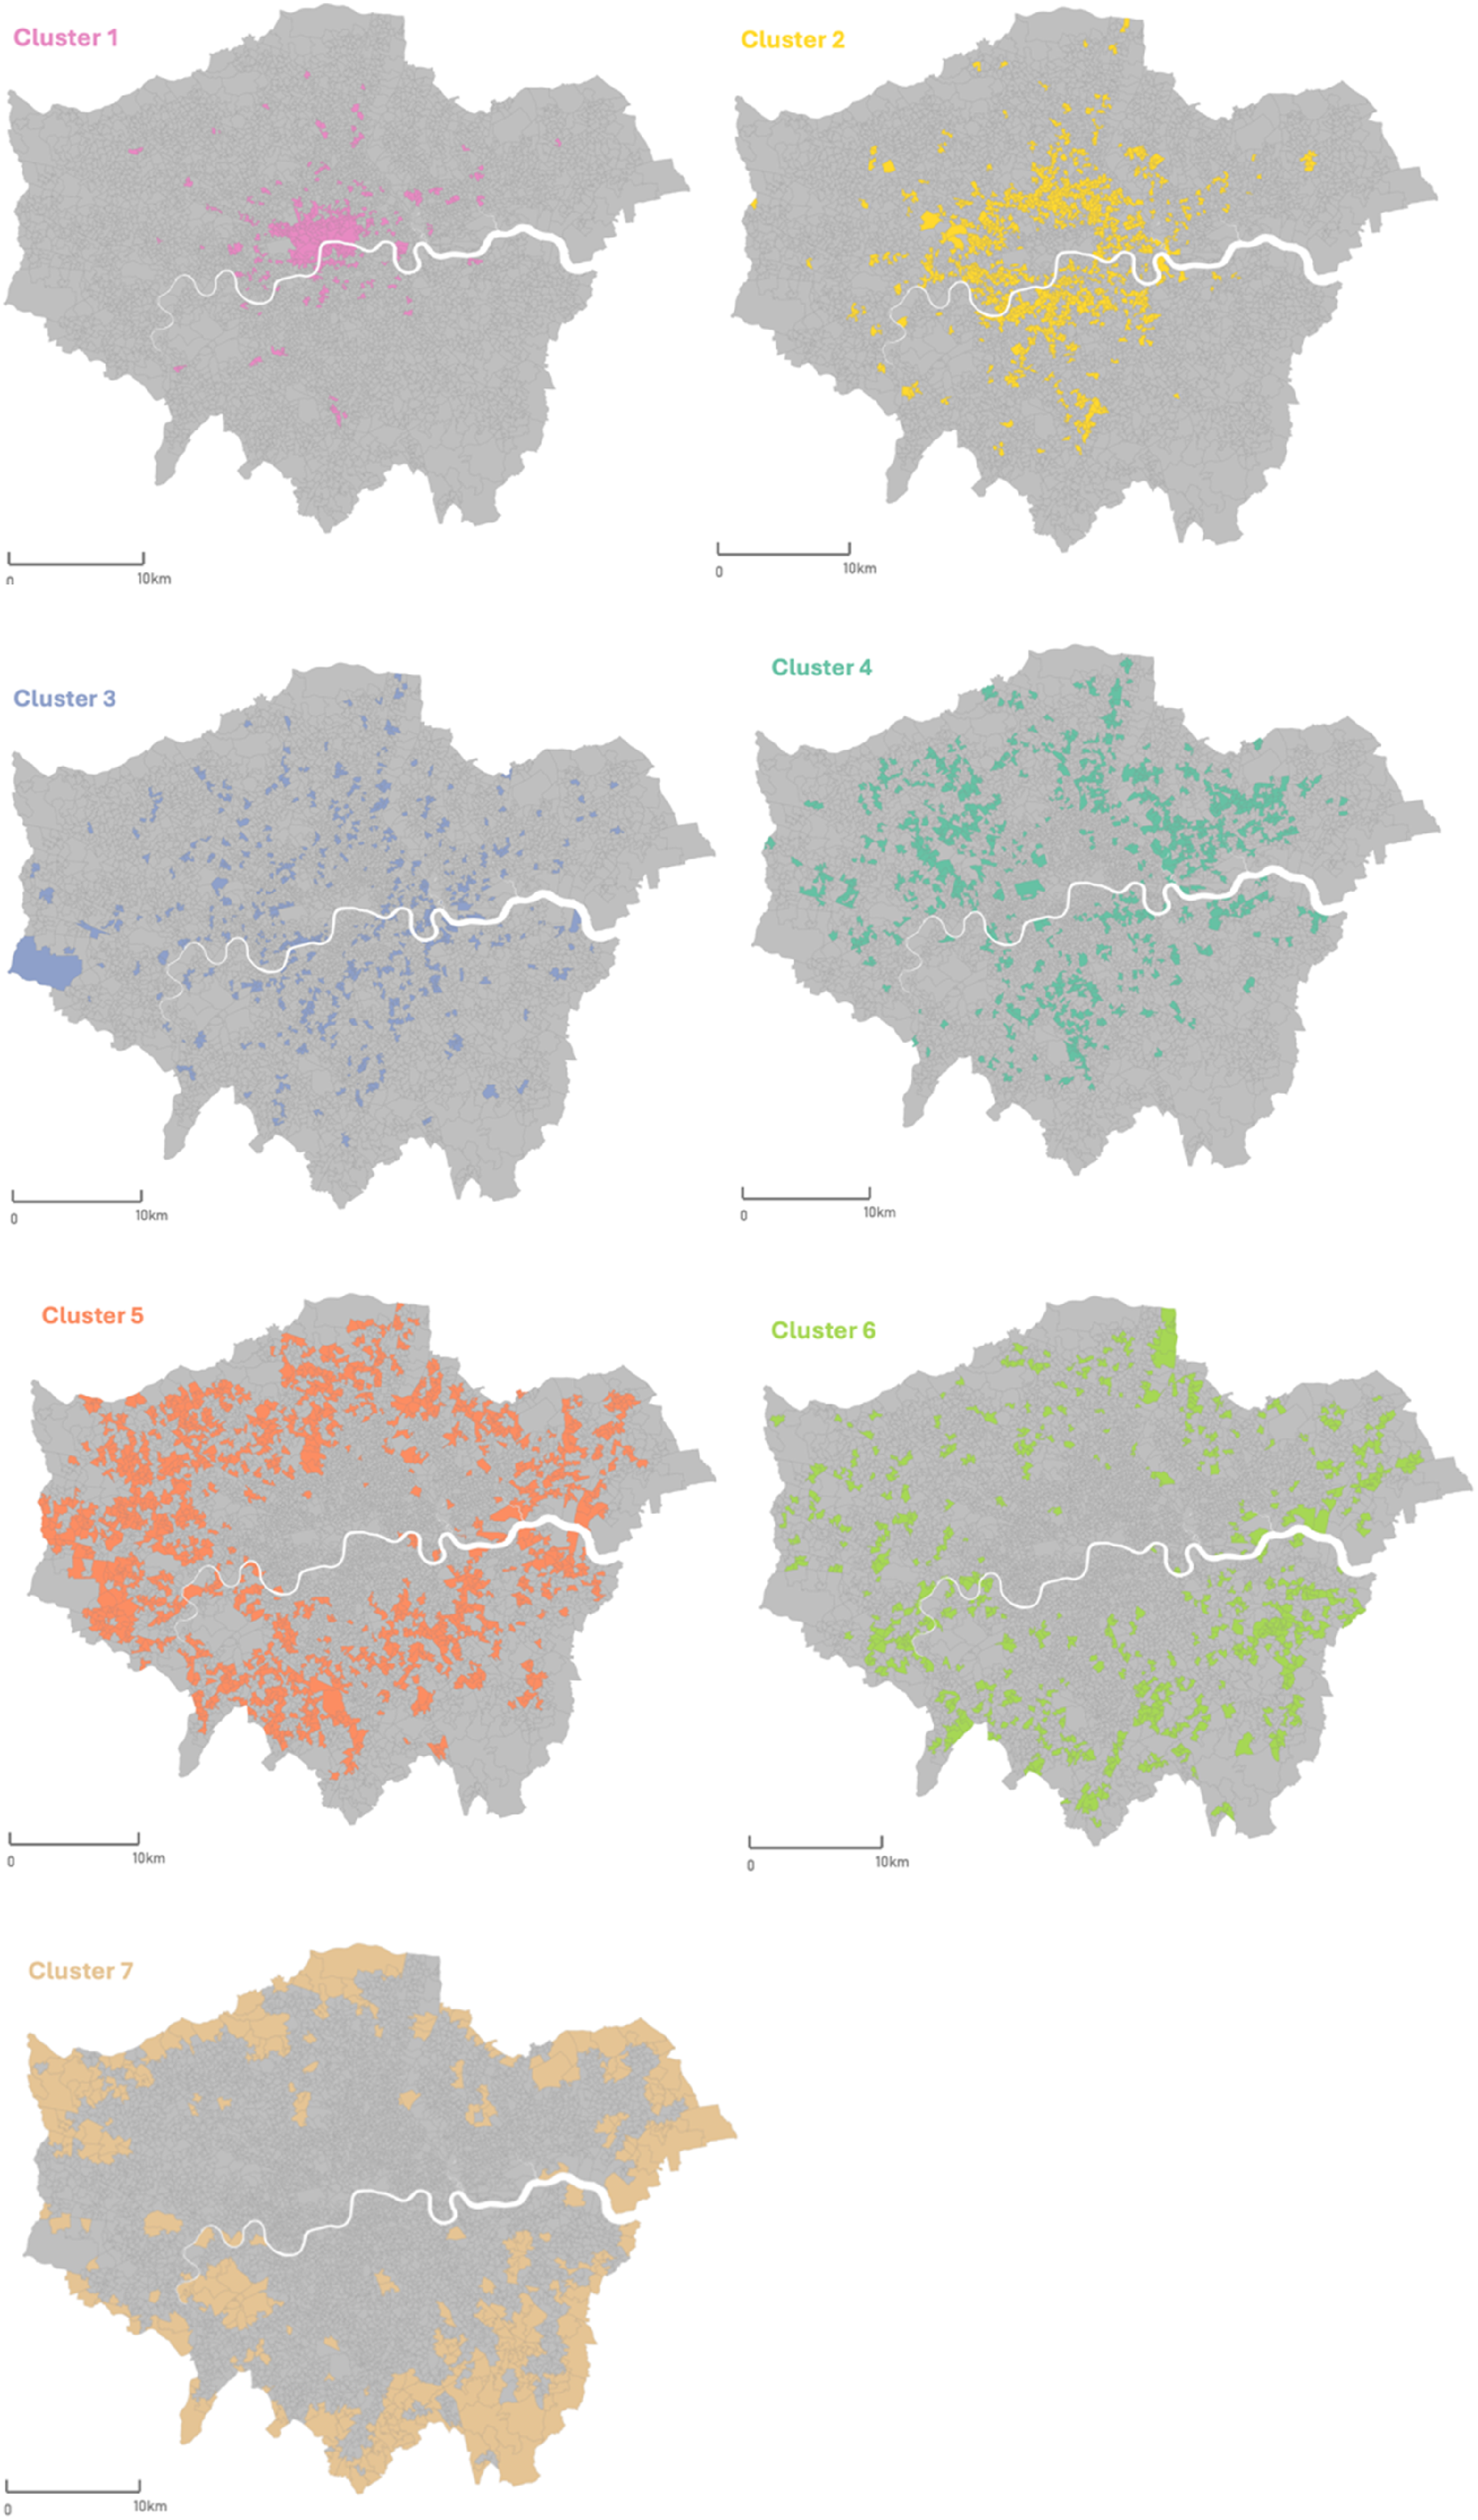
Pen-portraits
Clusters generated for geodemographic classifications are typically assigned descriptive names, referred to as ‘pen-portraits’, along with brief descriptions characterising the composition of each cluster. A common method for interpreting clusters involves examining whether the average value of each variable is above or below the global average. Based on the data, we can summarise each cluster as follows:
Cluster 1: Thriving night-worker central hubs
These areas have a much higher than the London average presence of night-workers across all time windows and days of the week, particularly from 6 pm to 9 pm on weekdays, indicating how these areas attract workers who finish their day shifts (9 am to 5 pm) later in the evening, as well as workers on various types of night shifts, reflected in the higher-than-average night-worker activity across all night-time windows. All business categories associated with the night-time economy are much higher than the London average in this cluster, with arts and recreation, hospitality and retail businesses being dominant. These areas are predominantly located in central London and include the City of London, Soho, Westminster, Marylebone, Fitzrovia and parts of Canary Wharf.
Cluster 2: Night-worker inner suburbs with high business concentration
These areas exhibit a higher than the London average presence of night-workers across all time windows. While similar to Cluster 3 in terms of worker footfall, Cluster 2 differs by having above-average levels of all business categories associated with the night-time economy, except for security and public administration and defence businesses. This cluster encompasses areas contagious with the central urban core such as Fulham, Wandsworth, Dalston, and Holloway, and extends outward to include smaller town centres.
Cluster 3: Night-worker inner suburbs with low night business concentration
Cluster 3 exhibits a higher than the London average presence of night-workers at all time windows, but presence of all business categories associated with the night-time economy are underrepresented in this cluster. This suggests that the workers in this cluster may be employed in facilities outside the identified business categories. For instance, Heathrow Airport is in this cluster, which employs a significant number of night-workers. These workers are active during night-time hours, but an airport is not classified under one of the businesses categories that were found to be associated with the night-time economy. Additionally, another group of night-workers includes cleaning crews employed in office buildings or public spaces, who typically work during the night to clean and maintain facilities, further contributing to night-time workforce activity outside of the identified night-time economy categories.
Cluster 4: Suburban night-time business locations with average night-worker activity
This cluster is characterised by an average presence of night-workers across all time windows and days of the week. All business categories associated with the night-time economy are present at above-global-average levels, with the highest contributions from security, hospitality, and transport and storage businesses. A closer look within the cluster reveals predominantly residential suburban zones such as Acton, Neasden and Maryland and others extending north-east, north-west and south of Central London. These areas, while not traditionally associated with night-time activity, nonetheless support the presence of night-workers, particularly within the more implicit and less visible segments of the night-time economy.
Cluster 5: Suburban transport, storage and health business locations with low night-worker activity
Cluster 5 consists of lower than the London average presence of night-workers across all time windows and days of the week. This might be attributed to its inclusion of areas that feature a mix of residential land use and substantial park or waterway spaces. All business categories associated with the night-time economy are generally average, with health, transport and storage being slightly above average, and arts and recreation being the lowest relative to the London average.
Cluster 6: Low night-worker activity suburban zones
This cluster has lower than the London average presence of night-workers across all time windows. In terms of night-worker footfall, this cluster resembles Cluster 5. However, it differs in that all business categories associated with the night-time economy are below the London average. The areas comprising this cluster share geographic proximity and spatial characteristics with those in Cluster 5.
Cluster 7: Night-worker periphery
Located on the outskirts of Greater London, this cluster has an extremely low presence of night-workers across all time windows, especially between 3 am and 6 am on weekdays. All business categories associated with the night-time economy are below the London average in this cluster. It represents the opposite end of the spectrum compared to ‘Thriving Night-Worker Central Hubs’ (Cluster 1) in terms of night-time economy activity.
Discussion
Validation
Validating a geodemographic classification is challenging when independent benchmarks are not available, and this is particularly true for night-time work. The use of mobile phone activity data adds further complexity because there is no established dataset for direct comparison. We therefore made use of alternative ways of validation by combining well-established classification practices with input from expert stakeholders. This approach helps ensure that the classification is both methodologically sound and relevant to policy needs. It also reflects the iterative nature of the work: the classification is intended as a first version that will be refined as new data and validation opportunities emerge.With this in mind, the final cluster allocations detailed above – and their interpretation – were shared for comment and validation with key stakeholders in three ways. The first was the circulation of a draft of the results via email to 12 representatives from the GLA and Transport for London (TfL) with interests in night-workers and the London night-time economy more broadly. The request to this group was to confirm that the input variables were appropriately selected, and given their knowledge of the sector, that the methodology was robust (if they felt able to do so since a number were data analysts) and finally if the results matched their understandings of the geography of night-working in London. Getting a sense of the latter was important given the local expertise of the stakeholders who would be familiar with their contexts (a major employer for example) that could have been overlooked with this citywide analysis. Feedback was positive with only suggested tweaks to cluster explanations and not core data or methods.
The second point of validation was a stakeholder workshop attended by 15 representatives from the GLA, local councils and several businesses in December 2024. The classification was presented at this event with an opportunity for feedback and discussion. As with the stakeholder email, feedback was positive with no indication that the data selections and cluster allocations were problematic. The push from the group was to ensure the policy relevance and applications of the work are well articulated and that the data were easily accessible to ensure its widespread and rapid use.
Lastly, we sought to validate this approach against analysis conducted by TfL. TfL operate most of the public transport in London, not least the network of night buses and the ‘Night Tube’ which comprises London Underground and Overground services throughout Friday and Saturday nights. As a local government body with its board appointed by the Mayor of London, TfL is a major stakeholder in the night-time economy. We therefore requested that an analyst at TfL check the above results against their own findings and understanding of the geography of night-workers in London. The TfL data, unlike what has been used here, is tied specifically to where there is transportation infrastructure and so areas where this is lacking will be missing from their analysis. So given these differences in data granularity and sampling we did not see it as appropriate in this context to undertake a detailed quantitative comparison between TfL data and our own. Instead, we focused on the geographical patterns and likely interpretation of the results: principally whether they were in line with TfL’s expectations based on travel demand data. After receiving confirmation that this is the case, we are confident that the LNC offers a comprehensive and robust picture of the geography of night-workers in London.
Policy implications
This is the first map of its kind to be created for the city and marks an important development in the way that new forms of data, when combined with established methods and long-established open datasets, can help to create data-driven policy. That said, we are not naïve to the critiques of geodemographic classifications that are well established (see Goss, 1995) and highlight the risks of oversimplification of complex lived experiences and heterogenous areas that may, in its worst form, lead to stereotyping. These concerns are mixed with legitimate anxieties about the ethical use of mobile phone data which can be so disclosive of an individual’s movements and transforms them into a commodity to be bought and sold by commercial organisations (see Dalton and Thatcher, 2015; Sieg et al., 2023). The use of such data, especially for policy, is also contingent on public trust who can see the benefits of its proper analysis and interpretation for the public good and not simply commercial ends.
As mentioned in the introduction, the creation of the LNC is one of three strands of research activity in the Data After Dark project and we believe the LNC has the potential to offer policy insights across the full range of scales from the national to the local. Nationally, the datasets chosen to inform the classification are not unique to London, and therefore, we see this citywide analysis as a test case for a methodology that can easily be scaled to other areas. Subject to licensing agreements, the BT footfall data, for example, is available across the country and the choice of nationally available business data supplied by the ONS offers no barriers in this respect. The caveat here is that the choice of industrial classification variables was informed by the London-based survey and therefore creates a composition most relevant to the city. For a national analysis this will need to be revisited to offer a much broader range of variables.
The LNC offers insights across London and in this respect is an important source of insight for those areas that fall outside the central area, which, although it has long been known as a hub for the night-time economy and provides a large amount of employment in that sector, is not the only place where night-workers are found. So, the final way we hope to drive policy with the classification is at the more local level. London’s separate boroughs have a degree of independence in the policies they implement, and this means that they have areas of interest, such as their high streets, the provisions that they offer for certain workers, or in the lobbying for different transport and services and so on. The granularity of this classification enables them to see which areas are distinct from others within the borough, and to explore further work around the more unique characteristics of the night-workers that are employed there.
Limitations and further work
Although BT applies established heuristics to identify each individual’s workplace, validation remains challenging for night workers, whose activity patterns differ from conventional schedules and for whom survey benchmarks, such as the Labour Force Survey, provide only coarse estimates without spatial or temporal detail. Several checks, however, suggest that the dataset offers a credible representation of night-time work. The observed distributions align with expectations, including lower counts during holidays, elevated activity around airports, hospitals, and high streets, evening-only activity in office districts, and negligible activity in residential areas and parks (GLA Economics, 2024). These patterns were also reviewed by stakeholders with detailed knowledge of London’s night-time economy and found to be consistent with their understanding.
A further limitation lies in the model’s inability to capture highly mobile workers in the platform economy, such as delivery drivers, who are integral to the night-time economy but lack a fixed workplace and therefore fall outside conventional place-based metrics (Acuto et al., 2025). This reflects a broader challenge in representing mobile and informal labour and in understanding the behaviours and needs of these groups. At the same time, large numbers of night workers are employed in fixed locations, including entertainment venues, security, logistics, facility management, and cleaning. Since the classification was designed to inform place-based policy strategies, the focus on individuals with stable workplace locations remains appropriate in this context.
Another consideration relates to the choice of input variables. We tested clustering using only mobile phone activity data, which produced a reasonable structure but lacked detail about the environments where night work takes place. Including business variables adds information on the composition of night-time industries, which stakeholders viewed as important for policy interpretation. These variables were not intended to dominate the classification but to complement the mobility data and provide a framework that is more useful for policy. This reflects a broader trade-off between statistical optimisation and practical utility, particularly given the cost and sensitivity of mobility data. Future work could explore alternative combinations of variables and assess how these affect both interpretability and policy relevance.
In light of these challenges, there are several avenues of further development for the LNC. The first would be the move towards a more frequently updated picture of night-working that falls into an established rhythm of statistical releases that reflect policy imperatives. Those classifications that depend on census data for the variables associated with population distribution are necessarily decennial in their nature, but the use of mobile phone derived footfall indicators enables more timely updates. A further advantageous aspect of mobile phone data its ability to capture the commutes of workers as they travel from home to their place of employment (if it is fixed). This information is particularly relevant to transportation planning for the likes of TfL, but it is also relevant to employers themselves and policymakers who may be interested in the extent of the catchment area of their workforce and the length of journeys that they are undertaking.
Our broader work (see https://dataafterdark.org) interviewing night-workers indicates that the journeys themselves can be long and arduous, particularly in contrast to those who work during daylight hours. TfL’s more sparse origin destination matrix as well as concerns around privacy may in fact be alleviated by aggregating to clusters rather than small spatial units. So we might, for example, calculate the average distance travelled to work by workers in Cluster 1 and compare it to those of Clusters 2 and 3. The data in this case would only need to be disclosed at the aggregate cluster level rather than LSOA to LSOA flows, but will provide vital intelligence in understanding what night-workers are experiencing in terms of journey times.
Conclusion
In conclusion the LNC offers a first attempt at creating a geodemographic classification tailored to those who work between the hours of 6 pm and 6 am. This workforce is often overlooked by conventional daytime data, and therefore, the LNC is founded on an innovative mix of official statistics and commercially gathered mobile phone activity grids. The methods, input data and results were appraised by key stakeholders of this classification, and we hope it will therefore provide an important addition to the policy evidence base for London. The approach taken was also deliberately applicable to the rest of the UK should it prove successful and could therefore provide a national classification of this important but often hard to measure aspect of economic activity.
Footnotes
Acknowledgements
We thank the Greater London Authority for providing access to British Telecom (BT) footfall data via the High Streets Data Service.
Ethical considerations
Ethical approval for the survey of night-workers and their employers was granted through University College London (UCL) Research Ethics Committee.
Consent to participate
Participants gave written informed consent before completing the survey.
Author contributions
Funding
The authors disclosed receipt of the following financial support for the research, authorship, and/or publication of this article: This project has received support, advice, and funding from UCL Innovation & Enterprise and data from Smart Data Research UK through the Geographic Data Service (GeoDS: Award Number ES/Z504464/1). We are also in collaboration with Didobi Ltd, UCL Urban Laboratory, and The Bartlett School of Architecture.
Declaration of conflicting interests
The authors declared no potential conflicts of interest with respect to the research, authorship, and/or publication of this article.
Data Availability Statement
The London Nightworker Classification (LNC) dataset is available via the Smart Data Research UK-funded Geographic Data Service (GeoDS) (geods.ac.uk: https://data.geods.ac.uk/dataset/london-night-workers-classification-lnwc) and the London Datastore (data.london.gov.uk) by ![]() .
.
Notes
Author biographies
Night-time industries
2007 Standard Industrial Classification codes of the night-time industries as defined by the GLA and the ONS (GLA Economics, 2018).
General Category
SIC 2007 Name (sub-categories)
SIC 2007 code
Cultural and leisure activities
Hotels and similar accommodation
551
Restaurants and mobile food service activities
561
Event catering and other food service activities
562
Beverage serving activities
563
Private security activities
801
Creative; arts and entertainment activities
900
Gambling and betting activities
920
Sports activities
931
Amusement and recreation activities
932
Activities which support night-time cultural and leisure activities
Retail sale in non-specialised stores
471
Retail sale of food; beverages and tobacco in specialised stores
472
Retail sale of automotive fuel in specialised stores
473
Retail trade not in stores; stalls or markets
479
Passenger rail transport; interurban
491
Other passenger land transport
493
Holiday and other short-stay accommodation
552
Security systems service activities
802
24-h health and personal social services
Provision of services to the community as a whole
842
Hospital activities
861
Other human health activities
869
Residential nursing care activities
871
Residential care activities for mental retardation; mental health and substance abuse
872
Residential care activities for the elderly and disabled
873
Other residential care activities
879
Social work activities without accommodation for the elderly and disabled
881
Activities which support wider social and economic activities
Animal production
014
Mixed farming
015
Support activities to agriculture and post-harvest crop activities
016
Processing and preserving of meat and production of meat products
101
Processing and preserving of fruit and vegetables
103
Manufacture of dairy products
105
Manufacture of bakery and farinaceous products
107
Manufacture of other food products
108
Manufacture of pulp; paper and paperboard
171
Manufacture of articles of paper and paperboard
172
Printing and service activities related to printing
181
Manufacture of basic chemicals; fertilisers and nitrogen compounds; plastics and synthetic rubber in primary forms
201
Manufacture of rubber products
221
Manufacture of plastics products
222
Manufacture of domestic appliances
275
Manufacture of motor vehicles
291
Manufacture of bodies (coachwork) for motor vehicles; manufacture of trailers and semi-trailers
292
Manufacture of air and spacecraft and related machinery
303
Manufacture of medical and dental instruments and supplies
325
Manufacture of gas; distribution of gaseous fuels through mains
352
Wholesale of food; beverages and tobacco
463
Freight transport by road and removal services
494
Sea and coastal freight water transport
502
Passenger air transport
511
Warehousing and storage
521
Support activities for transportation
522
Other postal and courier activities
532
Motion picture; video and television programme activities
591
Television programming and broadcasting activities
602
Photographic activities
742
Veterinary activities
750
Temporary employment agency activities
782
Activities of call centres
822
Other education
855
Activities of other membership organisations
949
Other personal service activities
960
SIC categories informed by the night-worker survey
The businesses that contribute to the night-time economy, based on the survey, are presented below.
Survey Category
SIC 2007 Name
SIC 2007 code
Arts and recreation
Creative; arts and entertainment activities
900
Amusement and recreation activities
932
Health
Hospital activities
861
Other human health activities
869
Hospitality
Hotels and similar accommodation
551
Restaurants and mobile food service activities
561
Event catering and other food service activities
562
Beverage serving activities
563
Manufacturing
Manufacture of dairy products
105
Manufacture of bakery and farinaceous products
107
Manufacture of other food products
108
Manufacture of pulp; paper and paperboard
171
Manufacture of articles of paper and paperboard
172
Printing and service activities related to printing
181
Manufacture of basic chemicals; fertilisers and nitrogen compounds; plastics and synthetic rubber in primary forms
201
Manufacture of rubber products
221
Manufacture of plastics products
222
Manufacture of domestic appliances
275
Manufacture of motor vehicles
291
Manufacture of bodies (coachwork) for motor vehicles; manufacture of trailers and semi-trailers
292
Manufacture of air and spacecraft and related machinery
303
Manufacture of medical and dental instruments and supplies
325
Manufacture of gas; distribution of gaseous fuels through mains
352
Public admin. and defence
Provision of services to the community as a whole
842
Retail
Retail sale in non-specialised stores
471
Retail sale of food; beverages and tobacco in specialised stores
472
Retail sale of automotive fuel in specialised stores
473
Retail trade not in stores; stalls or markets
479
Security
Private security activities
801
Security systems service activities
802
Transport and storage
Passenger rail transport; interurban
491
Other passenger land transport
493
Freight transport by road and removal services
494
Passenger air transport
511
Warehousing and storage
521
Support activities for transportation
522
Other postal and courier activities
532
Radar plot
Radar Plot of the variable differences from the global mean for each cluster solution. Values are standardised to range between 0 and 1.