
Abstract
The complexity of environmental factors experienced in active mobility presents unique challenges for the design of sustainable urban mobility environments. Particularly, active mobility modes are frequently associated with increased stress and unsafety. Most studies apply qualitative assessment methods for evaluating cyclists’ stress levels and subjective cycling experiences. Quantitative approaches are either limited in sample size, or conducted over short periods of time. This study introduces a transferable methodology that combines physiological measurements from wearable sensors with openly available spatial data to assess environmental stressors in urban cycling. A field study was conducted in Osnabrück, Germany, and involved 89 participants, 1,780 cycling trips, and 2,104,109 geo-referenced data points. Stress levels were quantified through processed Electrodermal Activity (EDA) measurements to identify Moment of Stress (MOS) along mapped road segments. We derived features from OpenStreetMap (OSM), Sentinel-2 Remote Sensing (RS), and Mapillary Street View Imagery (SVI) to characterise spatial elements of the built and natural environment. Using feature importance methods on top of a Random Forest (RF) Machine Learning (ML) model, we identified key environmental aspects associated with cyclists’ stress. Results show that the availability of cycling infrastructure, traffic regulations and other road users, are of higher importance than the availability of green space, when it comes to predicting the stress potential of individual road segments. The proposed methodology offers a multi-faceted and extensible approach to evaluate environmental characteristics related to stress, providing information for creating safer and more comfortable cycling environments. While our approach investigated spatiotemporal stress factors in cycling, the use and the availability of open data sources restricts the feature set that can be derived and evaluated in a particular region. We encourage future research to apply and extend this approach in diverse urban contexts, incorporating temporally dynamic features to support evidence-based mobility planning.
Introduction
Urban areas are complex systems, characterised by numerous interconnected components, including buildings, infrastructure, transportation networks, and social interactions (McPhearson et al., 2016). These urban elements have different usage demands on the city, which can be addressed, organised, weighted, and, at best, harmonised through urban planning (Streich, 2005). One central difficulty in the planning context is data collection, particularly how specific spatial issues that impact safety perception in mobility can be identified and incorporated into the planning process (Cappa et al., 2022; Downs et al., 2021; Rittel and Webber, 1973). A helpful technological development was the emergence of Volunteered Geographic Information (VGI) (Goodchild, 2007) and (participatory) people-centric urban sensing systems (Campbell et al., 2006). However, despite the theoretical opportunities for active citizen participation, citizens have mainly remained passive consumers, rather than active co-creators of the urban environment (Cardullo and Kitchin, 2019).
As cities densify, ensuring safe and health-promoting sustainable mobility options becomes increasingly important (Lam and Head, 2012; Nieuwenhuijsen, 2016). Cycling poses a promising mobility mode which offers benefits for both individual health and environmental conservation. However, the adoption of cycling is affected by static and dynamic components of the immediate environment, which can trigger short-term (psycho)physiological responses, i.e., involuntary bodily reactions caused by urban stress factors (Berto, 2014). Dynamic factors include interactions between road users (Markkula et al., 2023), traffic, crowdedness (Engelniederhammer et al., 2019; Resch et al., 2020), meteorological conditions, or air quality (Labib, 2024). Stationary factors relate to the natural and built environment surrounding a person at a given point in time and space, e.g. level of greenness, building density, or availability of dedicated (active) mobility infrastructure (Saelens et al., 2003). To promote active modes of transportation, a better understanding of such environmental aspects and their relation to subjective, potentially stressful experiences, is essential (Rietveld and Daniel, 2004).
Non-invasive wearable sensor technology provides a citizen science-oriented approach to continuously measure subjective mobility experiences quantitatively. While quantitative data can be the product of questionnaires, i.e., subjective user feedback provided on a Likert scale, physiological sensor measurements enable unbiased quantitative assessment of people’s perceptions in different urban areas through involuntary reactions elicited by the Autonomous Nervous System (ANS). Giannakakis et al. (2022) highlight several physiological parameters and the behaviour of the ANS under stressful conditions, involving the body’s response to natural and dynamically changing spatio-temporal stimuli produced within or through the surrounding environment (Dritsa and Biloria, 2021; Giannakakis et al., 2022). Among several studies linking physiological reactions with environmental factors, Mygind et al. (2021) and Dritsa and Biloria (2021) show that green space is associated with lower Heart Rate (HR), while land use and traffic events, e.g., intersections without traffic regulation, can lead to increases in Electrodermal Activity (EDA). D. T. Fitch et al. (2020) examine Heart Rate Variability (HRV) as a quantification of psychological stress for cyclists in urban environments, but conclude that HRV metrics lead to diverging results, questioning the applicability of this physiological parameter under real-world and physically demanding conditions. Considering these findings, our methodology relies on EDA measurements to quantify subjective stressful experiences, where stress is considered the reaction to a real or imaginary threat, with a typical “stress event” being characterised by perceiving a stressor, leading to a Stress Response (SR) of the body that is triggered after processing in the brain and an activation of the ANS (Everly and Lating, 2019).
Following this definition, we applied a stress detection algorithm proposed by Moser et al. (2023) to identify Moment of Stress (MOS) events from physiological, frequency-filtered EDA time-series measurements, where deviations from a baseline, i.e., measurements at states of relaxation, are quantified to represent stress experienced by an individual.
Previous research has evaluated environmental influences on subjective experiences through qualitative interviews or quantitative data from wearable sensors. While studies applying use-case dependent qualitative interviews show limitations in terms of reproducibility, generalizability, and transferability of the applied methods and results (
Additionally, most studies are conducted on a single day, limiting an assessment of how environmental variations across different days affect individuals’ (physiological) responses (Dritsa and Biloria, 2021). We addressed these limitations by proposing a transferable and extensible methodology to evaluate the environmental influence on stress in cycling activities ( • • •
Related work
Assessment of urban (active) mobility experiences
Environmental conditions and urban characteristics, including the availability of mode-specific transportation infrastructure, affect the adoption and experiences of active mobility (Badland and Schofield, 2005). Numerous studies have explored influences of the environment on individuals’ health and well-being, where Ki et al. (2023) differentiate between micro-level (e.g., greenery, visual enclosure and complexity) and macro-level (e.g., street networks) urban influences that affect subjective mobility experiences. To promote active modes of transportation, urban mobility planning research develops suitability indicators such as walkability and bikeability indices (Werner et al., 2024), which assess the availability and quality of mode-specific road infrastructure, and assign a suitability score to individual road segments. However, analysing commuters’ experiences requires high-quality data with extensive spatial coverage to identify urban factors contributing to negative (active) mobility experiences, where Nieuwenhuijsen (2016) emphasises the importance of taking a multi-dimensional view on stressful urban environments. Biljecki and Ito (2021) show that SVI is a well-established data source in urban analytics, where findings of Ki et al. (2023) prove that SVI, in combination with modern Computer Vision (CV) techniques, can be used to derive micro- and macro-level features describing the underlying urban characteristics. Next to OSM, which provides openly accessible information about the built environment, e.g. buildings and mode-specific street networks, SVI provided by Google Street View and the open-source alternative Mapillary, are frequently used to extract information about urban environments (Biljecki and Ito, 2021). Street scenes, captured from a first-person perspective, can be characterised through semantic segmentation, where features describing the built environment, e.g. building or road view percentage, and the natural environment, e.g. green or sky view percentage, can be represented through pixel-wise class assignments of the visible scene (Cordts et al., 2016; Keralis et al., 2020; Ogawa et al., 2024). Based on these visual urban features, Han et al. (2022) propose a methodology to predict psychological stress in individuals. Their results show that high proportions of walls and buildings in the visual field of a person are associated with increased psychological stress, while greater visibility of sky, trees, and roads have a calming effect on individuals. Another popular data source used to infer environmental characteristics of urban landscapes is RS data, e.g. from satellite-based sensors. Schaefer et al., (2021) and Helbich et al. (2021) use the Normalised Difference Vegetation Index (NDVI) as quantification for the horizontal greenness of urban areas and assess its effect on mental health. Results show that greenness derived from RS and SVI were only moderately associated, highlighting that RS-based features provide a different view on urban green spaces.
Non-invasive physiological monitoring for contextualizing stress in urban environments
Participatory urban planning offers a practical approach to collect subjective experiences across different urban environments. Qualitative data, collected through interviews and surveys, and quantitative data, represented as time-series measurements of physiological parameters, provide valuable information for citizen-oriented designs of urban infrastructure (Haug et al., 2023). Such people-centric approaches require effective two-way communication between urban planners and citizens (Jakonen, 2023), where wearable sensor technology provides an unobtrusive method to collect quantitative and objective data on individual physiological reactions (Bigazzi et al., 2022).
Several studies investigate stress and perceived safety during cycling in a virtual setting, i.e., through Virtual Reality (VR). Mohsen Nazemi (2020) uses a bicycle simulator, immersive VR, and physiological sensor measurements to study subjective cycling experiences and perceived safety. Segregated bicycle paths were rated highest for perceived level of safety, while stress increased when participants approached intersections, or during interactions with other road users, i.e., passing events or conflicts with pedestrians. Guo et al. (2023b) also employ a virtual bicycle simulator setup alongside recordings of cardiovascular and eye-tracking metrics, showing that lower cycling speed at shared or less separated infrastructure designs are associated with higher physiological stress responses. Friel et al. (2023) use qualitative interviews in a bicycle simulation study, finding that visibility, kerbs and obstructed views are additional factors that reduce perceived safety in cycling activities. While virtual settings provide a controlled and safe environment for studying stress in active mobility, limited environmental and traffic variability, adaption effects, and the lack of unpredictability in a laboratory setting are common limitations that are mentioned (M. Nazemi et al., 2021; Guo et al., 2023b; Guo et al., 2023a).
Additional considerations go into the selection of physiological parameters to quantify stress in individuals (Giannakakis et al., 2022). Mygind et al. (2021) show inconsistencies of physiological stress markers depending on the study setting. Findings of a field experiment conducted with 20 cyclists reveal an inverse relationship between self-reported stress and HRV-based stress measurements (D. Fitch, 2021). The author notes several confounding variables that affect cardiovascular stress assessment based on HRV and HR. Among these, physical activity (Brockmann and Hunt, 2023), socio-demographic factors, and exposure to external factors are the most prominent (Sammito et al., 2024). Similar to cardiovascular metrics, other physiological parameters such as Blood Pressure (BP), EDA and Skin Temperature (ST) are affected by confounding variables. For EDA and ST, external factors such as ambient temperature, speed of movement with associated cooling effects, and physical activity show the most influence (Beermann and Sieben, 2023; Mohsen Nazemi et al., 2025). However, due to established frequency filtering techniques for EDA measurements, the Skin Conductance Response (SCR) component of the EDA signal is a commonly used physiological parameter in urban stress research (Haug et al., 2023; Kyriakou and Resch, 2019; Resch et al., 2020; Werner et al., 2019). Artefacts introduced through motion and physical activity can be reduced through a bandpass frequency filter (Boucsein, 2012). Individual baseline calculations alleviate inter-subjective differences and further reduce intra-individual variations (Moser et al., 2023), which may be caused by the time of the day when measurements are taken, or whether the test subject performs any physical activity (Dogan et al., 2022; Kim et al., 2018).
Bigazzi et al. (2022) review studies that apply physiological biomarkers to study traffic-related stress in real-world active mobility conditions, finding that physically separated cycling paths reduce stress, while intersections and dynamic factors such as traffic and noise increase stress. The authors emphasise challenges related to small and homogeneous sample sizes, the integration of different sensor modalities, and addressing intra-subjective differences among individuals. Teixeira et al. (2020) perform field experiments with 70 participants in 5 cities, showing that physiological stress during cycling is elevated at intersections, primary roads, rough surfaces and during elevated noise levels. Millar et al. (2021) conduct a study in the Netherlands with 12 study participants, where physiological EDA measurements are used to measure emotional arousal across different urban areas that are characterised by land use. Contrary to the findings of Tran et al. (2020) and Marquart et al. (2022), results of the study show that natural areas elicit higher emotional arousal than more developed urban areas. The authors mention the small sample size, limited route diversity, and confounding variables that affect EDA measurements as limiting factors. Additionally, they note that “arousal” may not directly map to stress and perception of safety. Similarly, Lim et al. (2022) study stress in cycling by combining physiological monitoring with subjective, self-reported stress, finding only moderate agreement between physiological stress responses and subjective user feedback. The authors claim that physiological parameters capture unconscious responses while subjectively reported stress events are characterised by conscious perceptions, potentially adding subjective recall biases related to previous experiences. To add additional context to urban stress measurements, Resch et al. (2020) propose a mixed-methods approach to analyse urban spaces by integrating multiple data modalities, i.e., physiological sensor measurements, first-person videos, and qualitative user feedback, gathered through geo-referenced interviews and post-hoc surveys. The authors show that a mixed-methods approach overcomes the limitations of individual, uni-modal approaches, providing an objective, multi-faceted method for evaluating the stress potential of urban spaces. However, a remaining challenge is the investigation of the relation between such situation-dependent, transient stress triggers and the surrounding environment. Dritsa and Biloria (2021) point out additional theoretical, methodological and practical issues with studies that use physiological sensor measurements for location-aware stress detection. Even though most studies deal with limited samples size and narrow time frames (ibid.), these approaches mark an important shift toward urban planning processes that are both empirically informed and citizen-centred, highlighting the need for scalable methods that strike a balance between methodological soundness and real-world applicability.
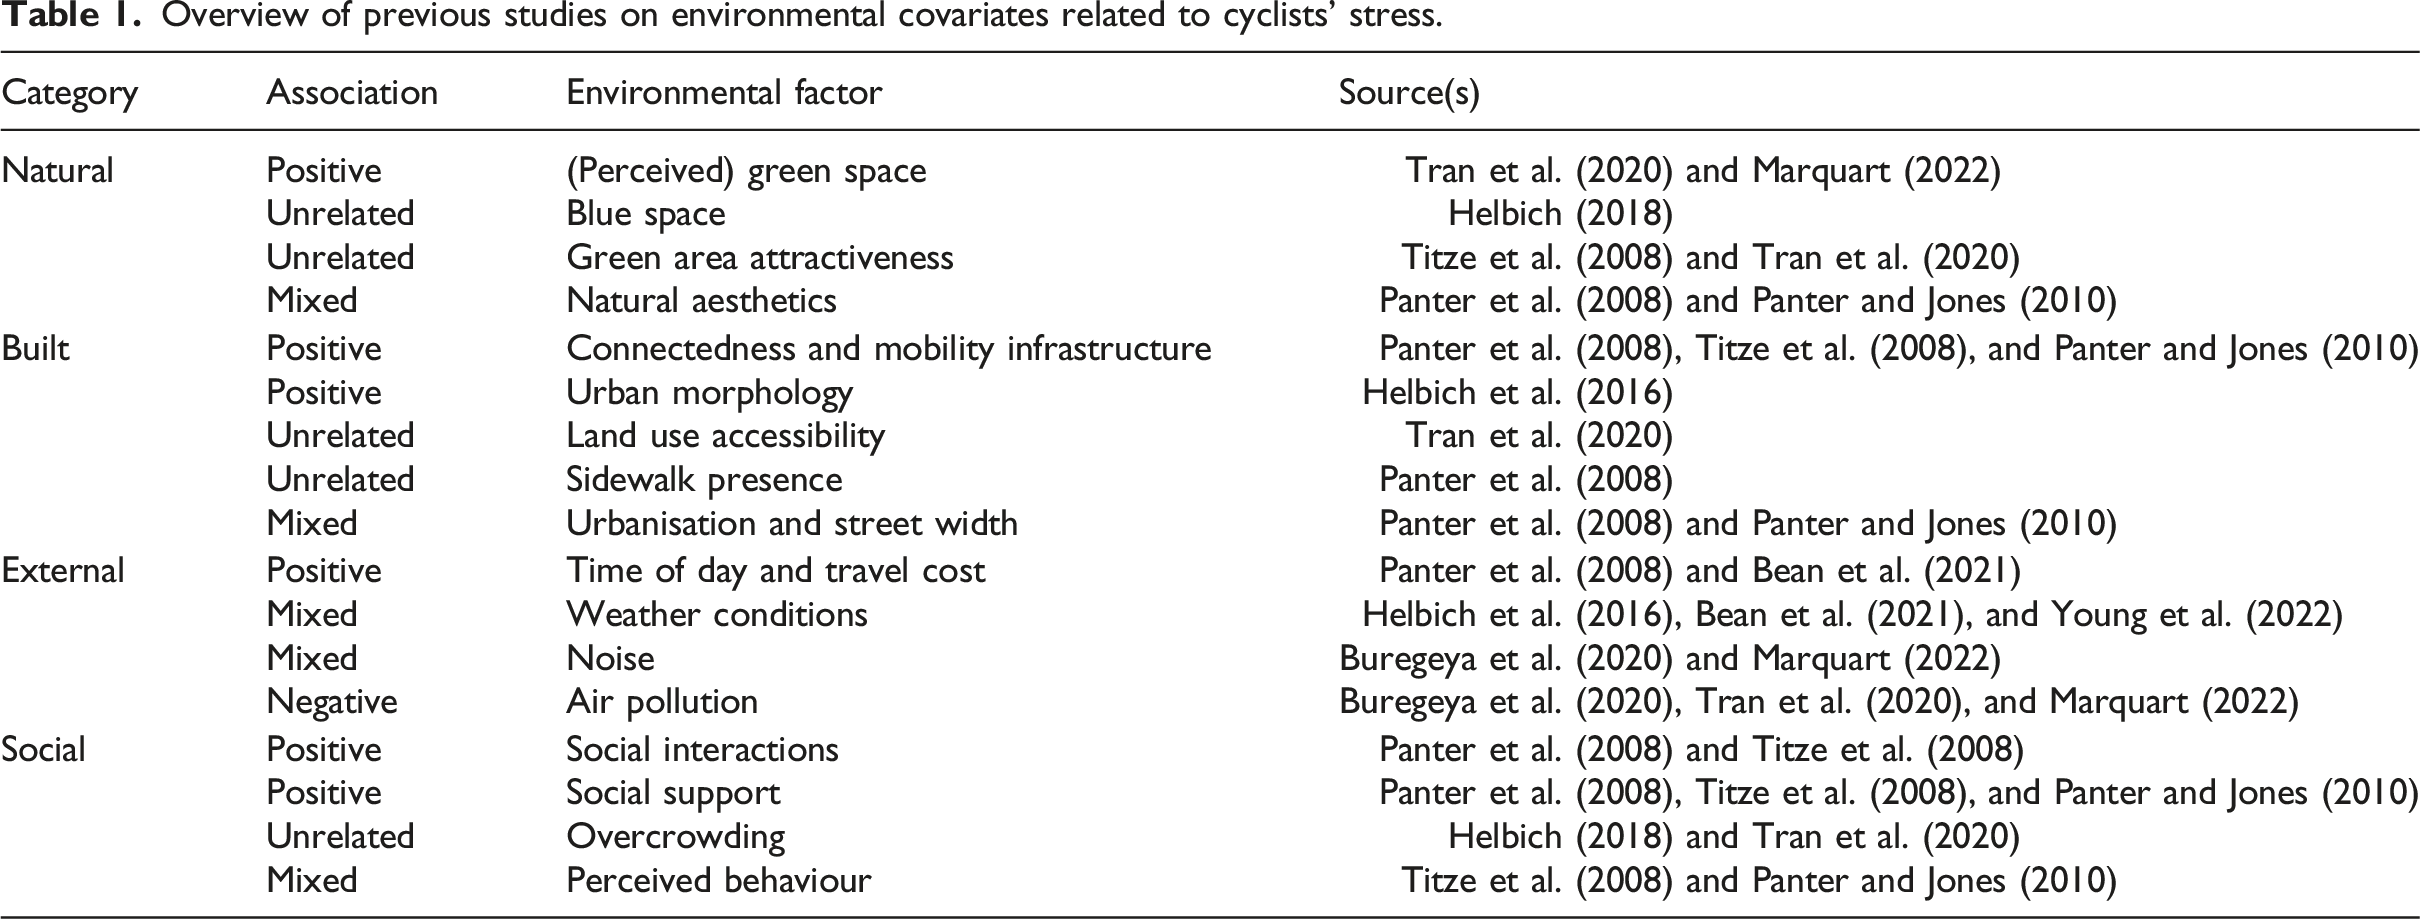
Overview of previous studies on environmental covariates related to cyclists’ stress.
This paper addresses the identified research gaps by proposing and evaluating a scalable, transferable methodology for assessing environmental stressors in urban cycling. Specifically, we: • Develop a multi-modal approach combining wearable physiological sensing (EDA) with open urban data to capture subjective experiences in cycling ( • Leverage a comparatively large and diverse sample (89 participants, 1,780 trips) collected over multiple months under real-world cycling conditions ( • Integrate features from open datasets including SVI and OSM, to quantify environmental factors ( • Train and evaluate a machine learning model (Random Forest) to identify key covariates influencing cyclists’ stress, supported by global and local feature importance analysis.
Methodology
Figure 1 illustrates the workflow for collecting and integrating wearable sensor data with open data sources, which can be used to derive features describing environmental characteristics and may cause stress during cycling activities. In the proposed methodology, we focused on stress covariates that can be derived within a 50 m radius of a street segment, which is defined as the road segment that connects two adjacent intersections, i.e., nodes from OSM. These covariates are features showing exhaustive coverage of different urban areas and describe the immediate surroundings. Workflow for integrating wearable sensor data and open environmental data to derive stress covariates.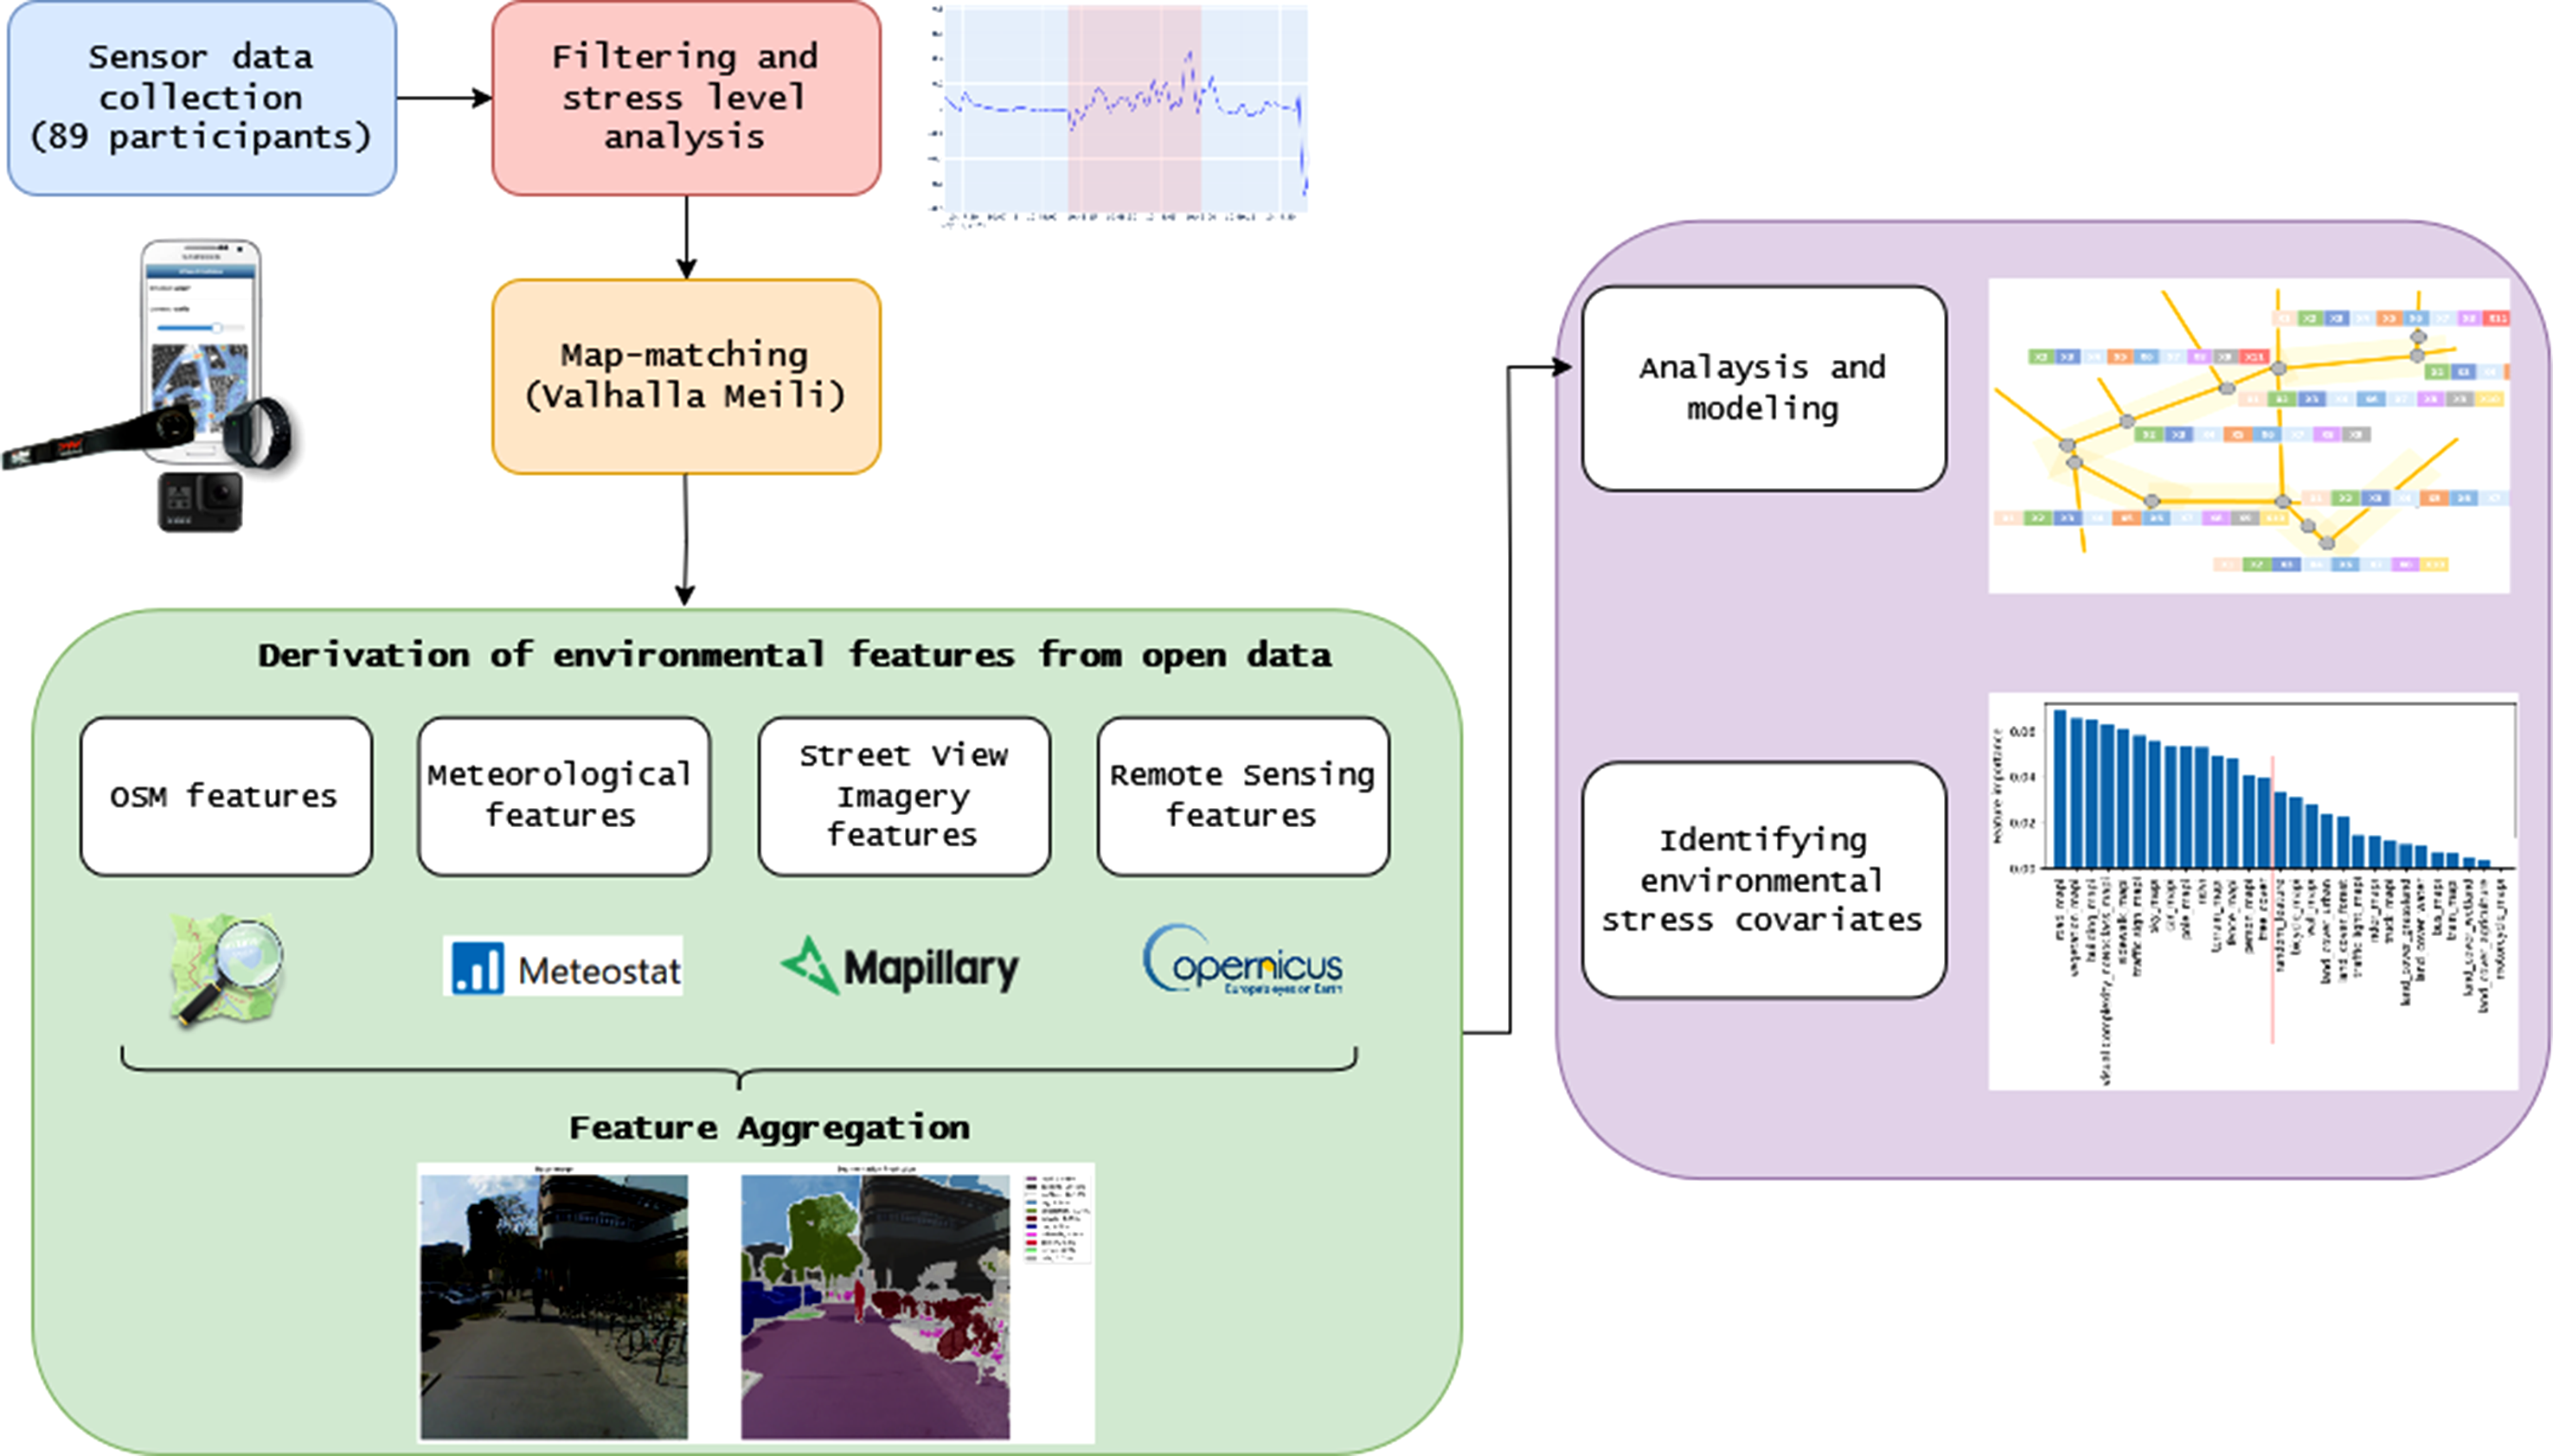
Sensor data collection
The dataset used in this work was collected in a field study conducted in Osnabrück, Germany, a large city located in a flat region in Lower Saxony in north-western Germany. The data collection was performed between July 2022 and November 2023 (cf. Figure 2), where 89 European White study participants - 38 female, 47 male, 1 diverse, and 3 who did not provide information on their gender - volunteered to wear the Empatica E4 sensor (Empatica 2024) and an Android smartphone during their daily cycling activities. The smartphone ran an eDiary app (Petutschnig et al., 2022), which connected to the sensor via Bluetooth and served as an interface between the sensor device and the smartphone. The age of the participants varied between 20 and 75, with a mean age of 47 years. Timestamps of measurements were utilised for temporal alignment and the smartphone’s GPS to add a geographical reference to physiological reactions. A sensor recording describing a cycling trajectory produced by one participant is referred to as a run. The average distance of a run was 3.8 km, with an average speed of 11.52 km per hour. Additionally, speed, bearing and position were recorded. The Empatica E4 is equipped with several sensors that measure physiological parameters of the human body. In particular, the bracelet measures Electrodermal Activity (EDA), Photoplethysmography (PPG), ST and Accelerometery (ACC). EDA, the physiological parameter used for deriving stress, is recorded at a sampling frequency of 4 Hz. All voluntary study participants were recruited by the city of Osnabrück through online advertisement, email campaigns and in situ on the street, where signed consent forms approving the collection of their data for research purposes were required. Map of city of Osnabrück - field study area showing cyclists’ stress scores and road usage density. Streets with at least 3 runs and their average MOS scores are shown. Labels refer to the city districts of Osnabrück.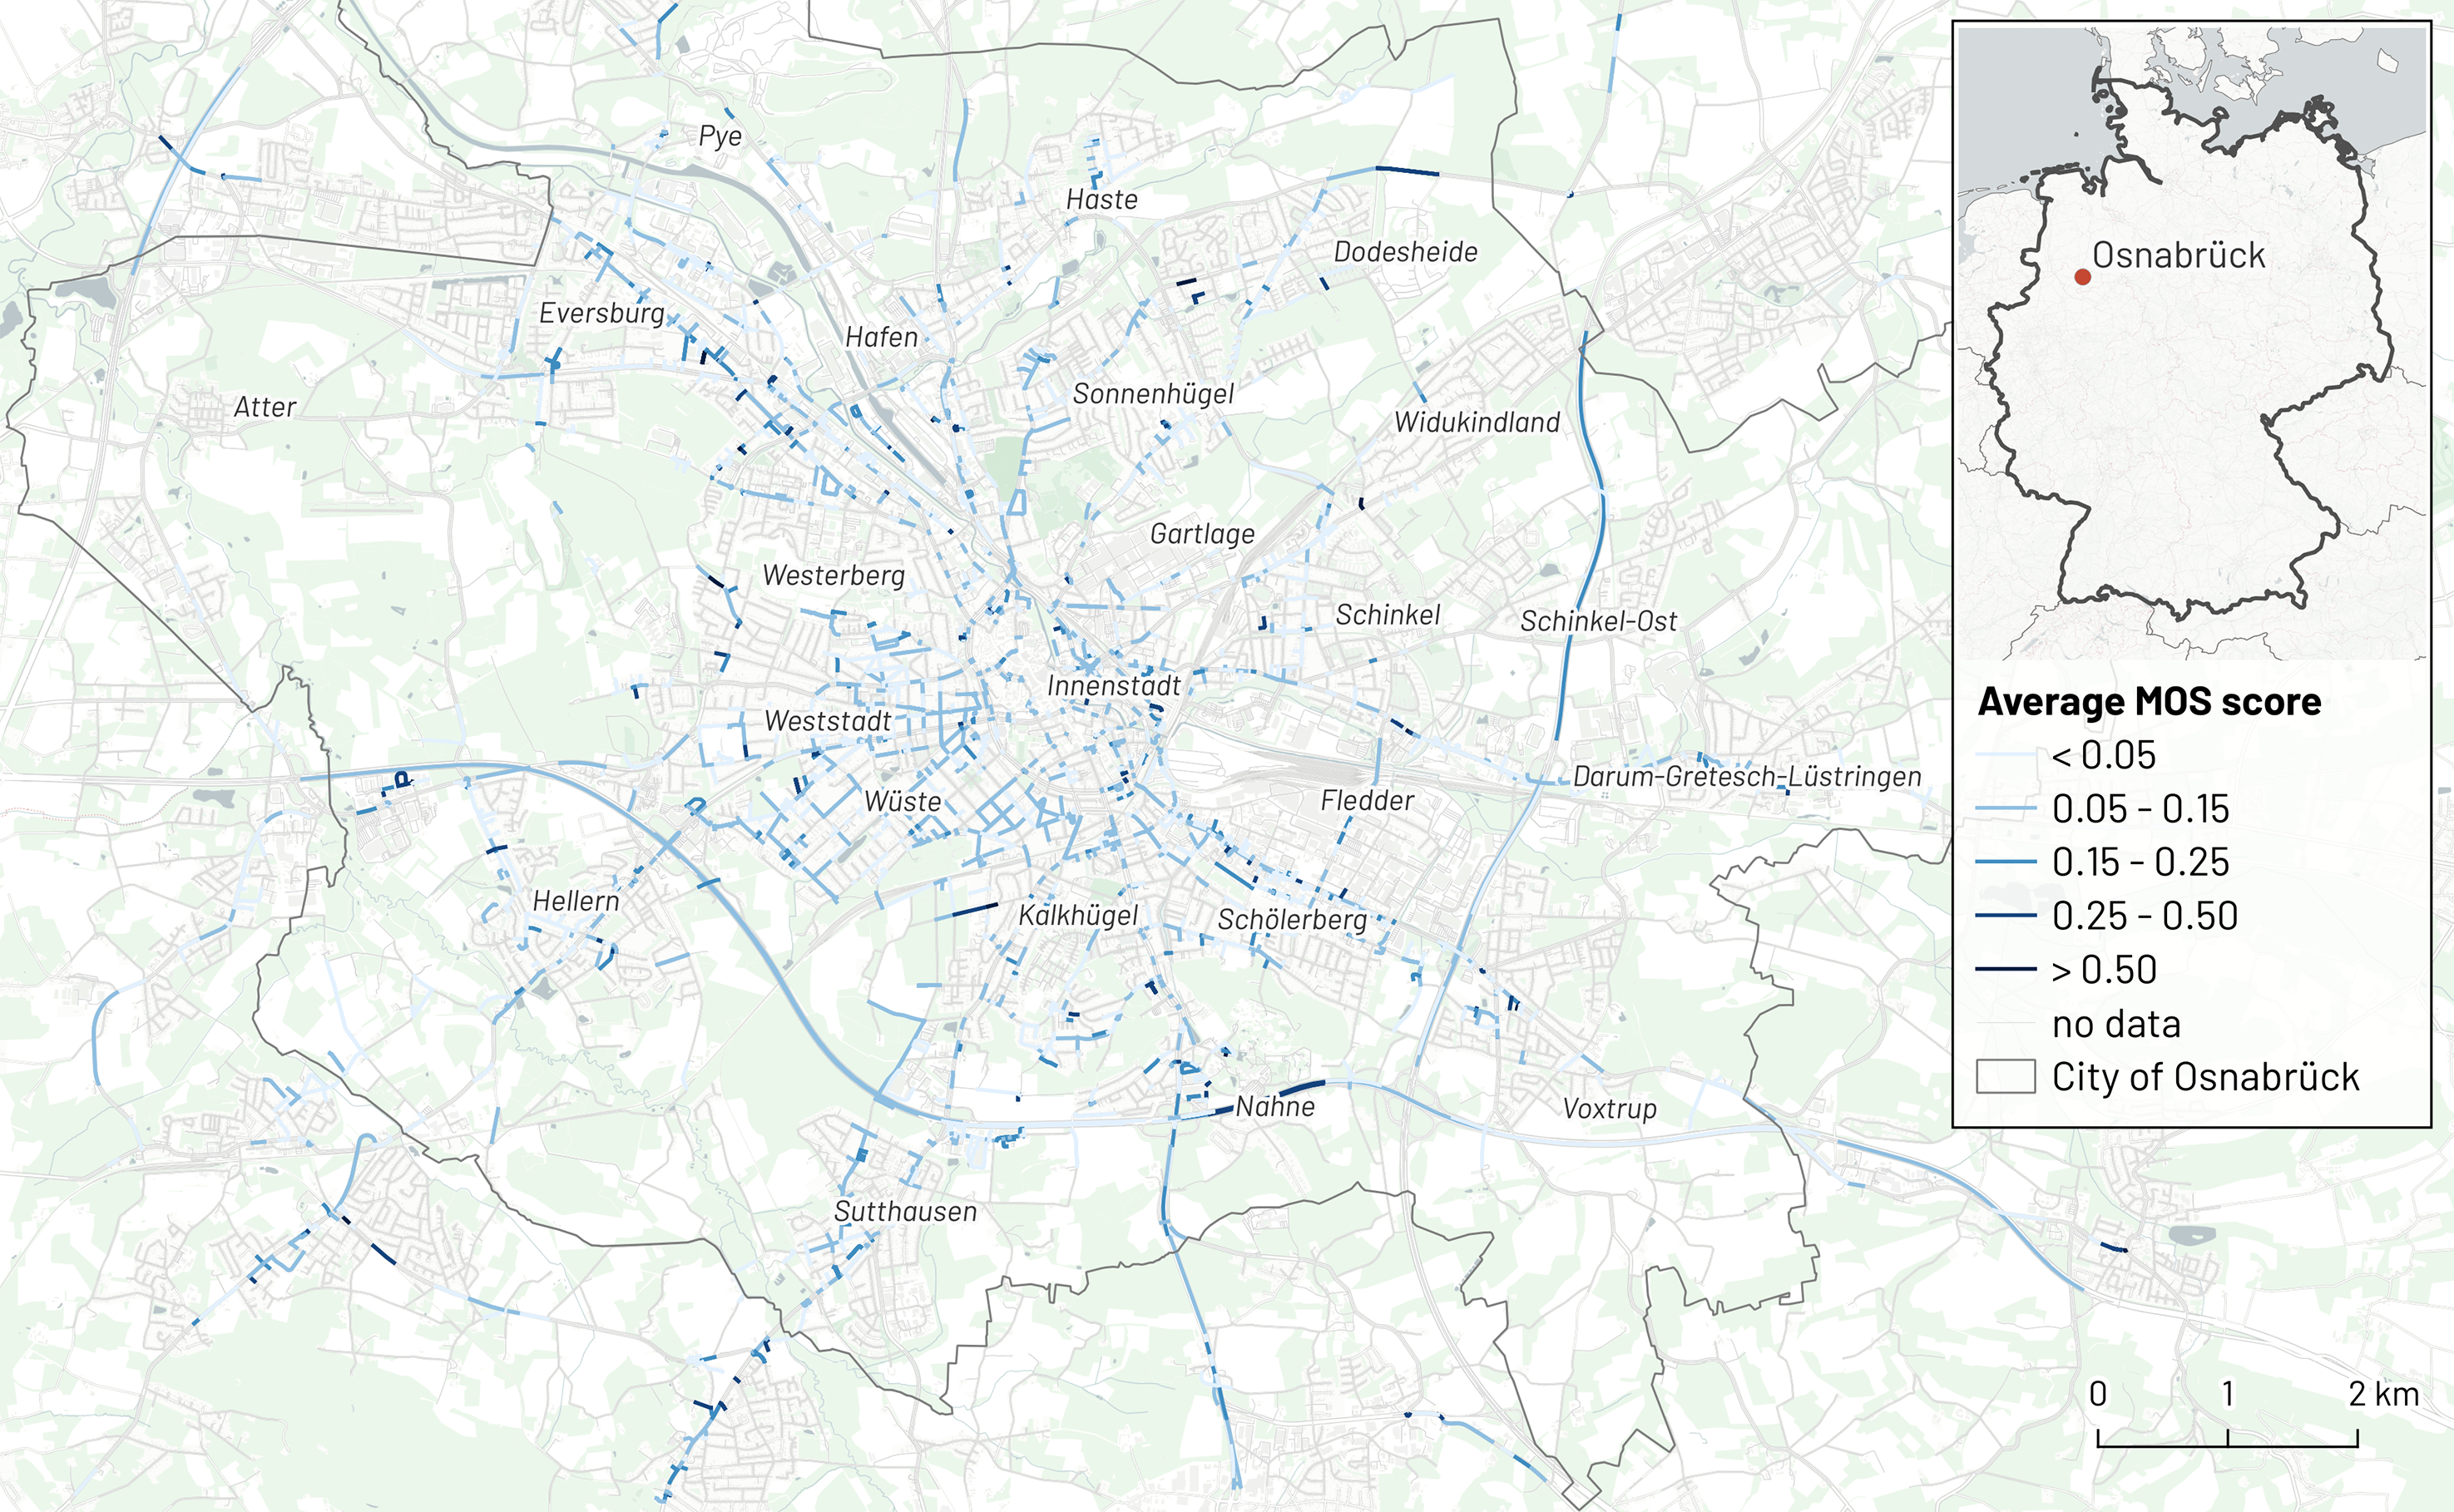
Filtering and stress level analysis
Based on a methodology proposed by Moser et al. (2023) we preprocessed the Electrodermal Activity (EDA) signal with a bandpass frequency filter. Following a first-order low-pass butterworth filter with a cut-off frequency of 1 Hz to remove noise caused by motion artefacts, we applied a first-order high-pass filter with a cut-off frequency of 0.05 Hz to extract the individual EDA signal components, i.e., Skin Conductance Level (SCL) and SCR. The SCL reflects the gradual increase in EDA, also caused by physical activity, while the SCR component reveals acute reactions of emotional arousal, which correspond to sudden spikes in the filtered EDA signal (Boucsein 2012; Moser et al. 2023). We then implemented the algorithm proposed by Moser et al. (2023) to detect acute stress based on local windows of SCR. The algorithm considers differences in physiological reactions inherent in individuals, where a baseline is used in the subsequent identification of MOS events to account for intra-subjective differences. The resulting MOS score, quantified by deviations from the baseline, is unitless, with higher values indicating more evidence of stress. As recommended in Cacioppo et al. (2016) we used the first 5 minutes of the recording of a cycling trip as a baseline. This ensured physiological baselines which are created based on realistic active mobility study conditions. Overall, the resulting dataset contained 1,780 cycling trajectories.
Map-matching
Recorded GPS trajectories with stress scores were mapped to the OSM cycling network of Osnabrück using Valhalla Meili, an open-source framework (Saki and Hagen 2022). The framework applies a Hidden Markov Model (HMM) to align noisy GPS traces with the most likely paths available on the underlying road network. Since direction of movement influences the perceived environment, we added directional information based on bearing measurements from the smartphone. The map-matched trajectories were joined with the OSM road network data, where join partners with a distance greater than 15 m were excluded.
Deriving environmental features from open data
Individual road segments - OSM linestring features defined by two adjacent OSM nodes - were additionally enriched with openly available, contextual data. The average road segment length was 70.95 m (median: 43.36 m).
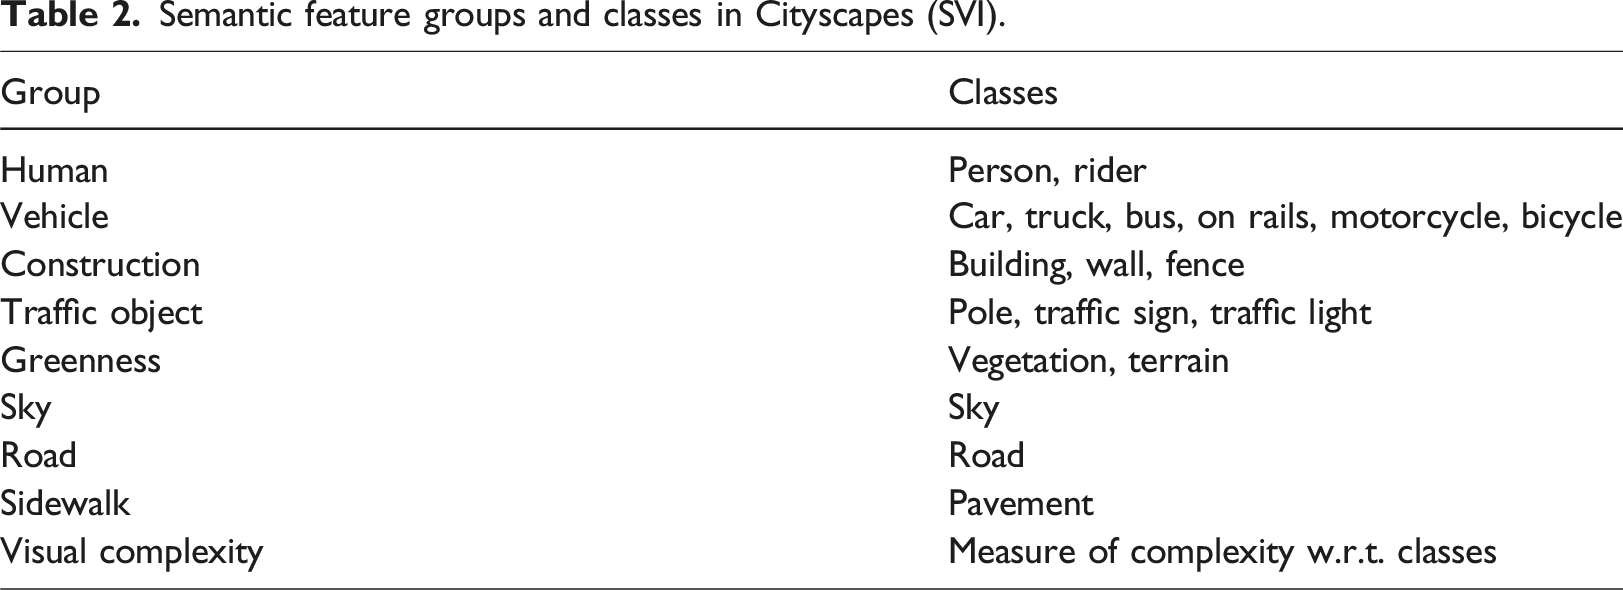
Semantic feature groups and classes in Cityscapes (SVI).
OSM features
Map-matched stress levels were spatially joined with OSM data to explicitly add attributes that characterise the built environment. Features describing the road infrastructure, e.g., street length, road width, speed limits, and the surrounding buildings, e.g., building height, were checked for completeness. OSM data was extracted using the osmnx python package (Boeing 2020), where the boundaries of the polygon encompassing all cycled trajectories defined the area of interest (AOI).
Mapillary street view imagery features
Mapillary provides crowd-sourced high-resolution SVI data on a global scale. Using Mapillary’s Version 4.0 Application Programming Interface (API) and a semantic segmentation model, trained on the Cityscapes dataset (Cordts et al., 2016), we extracted isovist environmental features for each available road segment, including greenness, road view, and visual complexity. The latter quantifies road segment complexity through an entropy measure based on detected scene elements from a first-person perspective.
Geo-referenced sensor measurements were matched to images based on proximity, bearing, and capture direction of the SVI. Join partners were selected from candidate sets, which were generated hierarchically, advancing to the next level only if no matches were found in the current level: 1. distance ≤5 m, angular deviation ≤ ±120° 2. distance ≤10 m, angular deviation ≤ ±90° 3. distance ≤15 m, angular deviation ≤ ±60°
The maximum allowable deviation of ±60° for points within 15 m was chosen to align with established visibility standards, which require a minimum 120° horizontal field of view for drivers. This ensured that retrieved images remained relevant to the forward-facing perspective of road users (Liu and Sevtsuk, 2024). For closer matches (≤5 m), the threshold was expanded to ±120° to increase the likelihood of retrieving SVIs that capture the immediate surroundings. This prioritisation balanced spatial proximity and viewpoint similarity, ensuring that nearby images were included even when their orientation deviated more significantly.
To characterise a person’s perception of the natural environment, we built a semantic segmentation pipeline based on the extracted SVI. A pixel-wise classification was performed using the SegFormer-B5 semantic segmentation model proposed by Xie et al. (2021). The model was pretrained for image classification on the ImageNet-1k dataset (Deng et al., 2009), and fine-tuned on the Cityscapes data (Cordts et al., 2016), encompassing 2,975 finely annotated images. Overall, the model had over 84 million parameters, making it suitable for high-resolution semantic segmentation of urban scenes (Xie et al., 2021).
Remote Sensing features
Satellite-based RS data was used to calculate the average NDVI, a measure for vegetation health, frequently featured in urban studies (Li et al., 2015). Using Google Earth Engine (GEE), we averaged all available values for periods of 3 months, which were in line with the respective field study time frames. Average NDVI values were calculated based on Sentinel-2 imagery and the following equation:
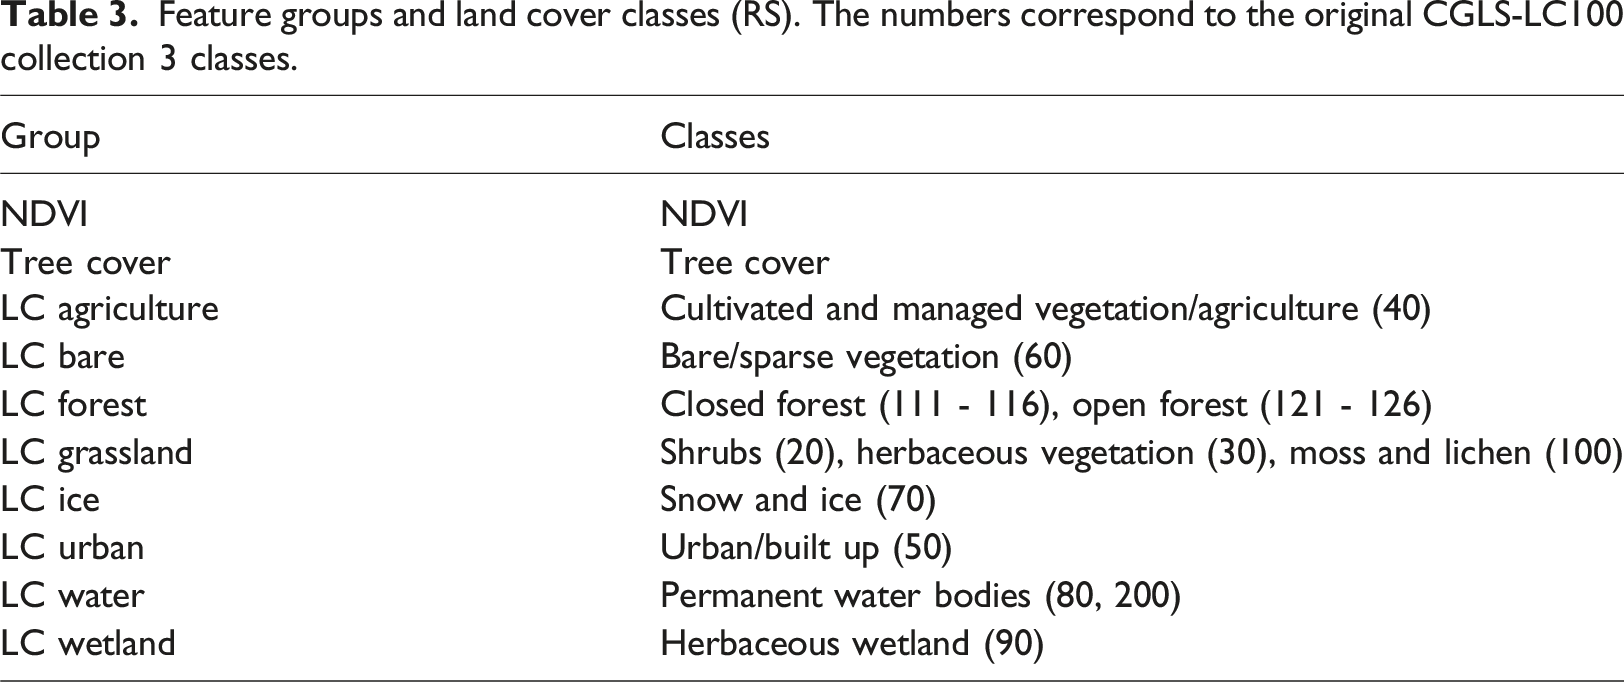
Feature groups and land cover classes (RS). The numbers correspond to the original CGLS-LC100 collection 3 classes.
Feature aggregation
To objectively assess how the natural and built environment affect individual stress levels of cyclists, we spatially aggregated previously defined features based on the underlying road network. For each road segment, we sampled 10 random points and calculated the average neighbouring feature values within a radius of 50 m, characterizing the surrounding environment of a road segment.
Considering the metadata of SVI, e.g., capture time and location, we performed a spatial join of the segmentation results describing the natural environment and the existing node- and edge-level attributes of a road segment. To remove outliers caused by a single run of a person, we introduced the requirement that a road segment needed to be traversed by at least 3 runs to be included in the final dataset. This reduced the dataset from 34,734 to 26,035 road segments, which were used for training a Random Forest (RF) model to classify the stress potential of a street segment.
Analysis & modelling
To identify environmental factors associated with stress responses, we leveraged exploratory data analysis and a modelling approach combined with feature selection and feature attribution methods.
The effect of dynamically changing environments and resulting road conditions on people’s measured stress was assessed based on run-wise aggregations of individual trajectories, containing the mean of contextual feature values, the total number of detected MOS, and the average MOS Score .
A RF ML model, trained on the subset of relevant covariates, was used to classify the stress potential of road segments. We chose a RF model for the binary classification task of predicting the stress potential of road segments, since they allow for the calculation of permutation importance scores. The model, consisting of an ensemble of 50 trees, was evaluated in terms of accuracy, recall, precision, and F1-score on a random subset, sampled from all road segments in the dataset. Due to the unbalanced sample of aggregated stress and non-stress segments, we performed undersampling to draw a random subset of non-stress segments and balance the class distributions. This sampling procedure was repeated 40 times, and performance was evaluated based on a 80:20 train-test split.
Identifying environmental stress covariates
Environmental characteristics related to stress were identified based on permutation importance (Hapfelmeier et al., 2023) applied to the RF model, and SHAP (Lundberg and Lee, 2017) applied as a feature attribution layer. Permutation scores provide a global view on the importance of features, by shuffling the values of an attribute and observing the effect on the model error. The calculated importance scores are ranked to reflect the model’s dependence on a particular feature, expressed in terms of decreases in classification performance (Saarela and Jauhiainen, 2021).
Additionally, we introduced a random variable with normal distribution as a baseline reference, where features showing less predictive power than this random variable can be considered insignificant for the predictions of the RF model (Stoppiglia et al., 2003).
Contrary to the importance of a variable derived from permutations, SHAP provides a global and a local perspective on the importance of a feature by linking feature values with individual predictions. SHAP values are calculated by comparing the marginal contributions of adding a feature to a baseline, which is the average prediction if none of the features is used. In doing so, each feature has an equal chance of contributing to a prediction, where the resulting SHAP values are ranked according to their importance scores (Lundberg and Lee, 2017).
Results
Exploratory data analysis investigating the effect of environmental conditions such as inclement weather and poor air quality on measured stress levels revealed no significant differences between measured stress. The majority of runs took place during pleasant weather conditions and the granularity of environmental conditions was too low to investigate differences on the level of road segments.
As two-sample t-tests comparing aggregate statistics of detected MOS revealed insignificant differences, meteorological conditions, air quality measurements and road segments with incomplete OSM attribute information were excluded as variables. A correlation matrix presenting the investigated features and their linear relationship is shown in Figure 3. Pearson correlation of environmental features.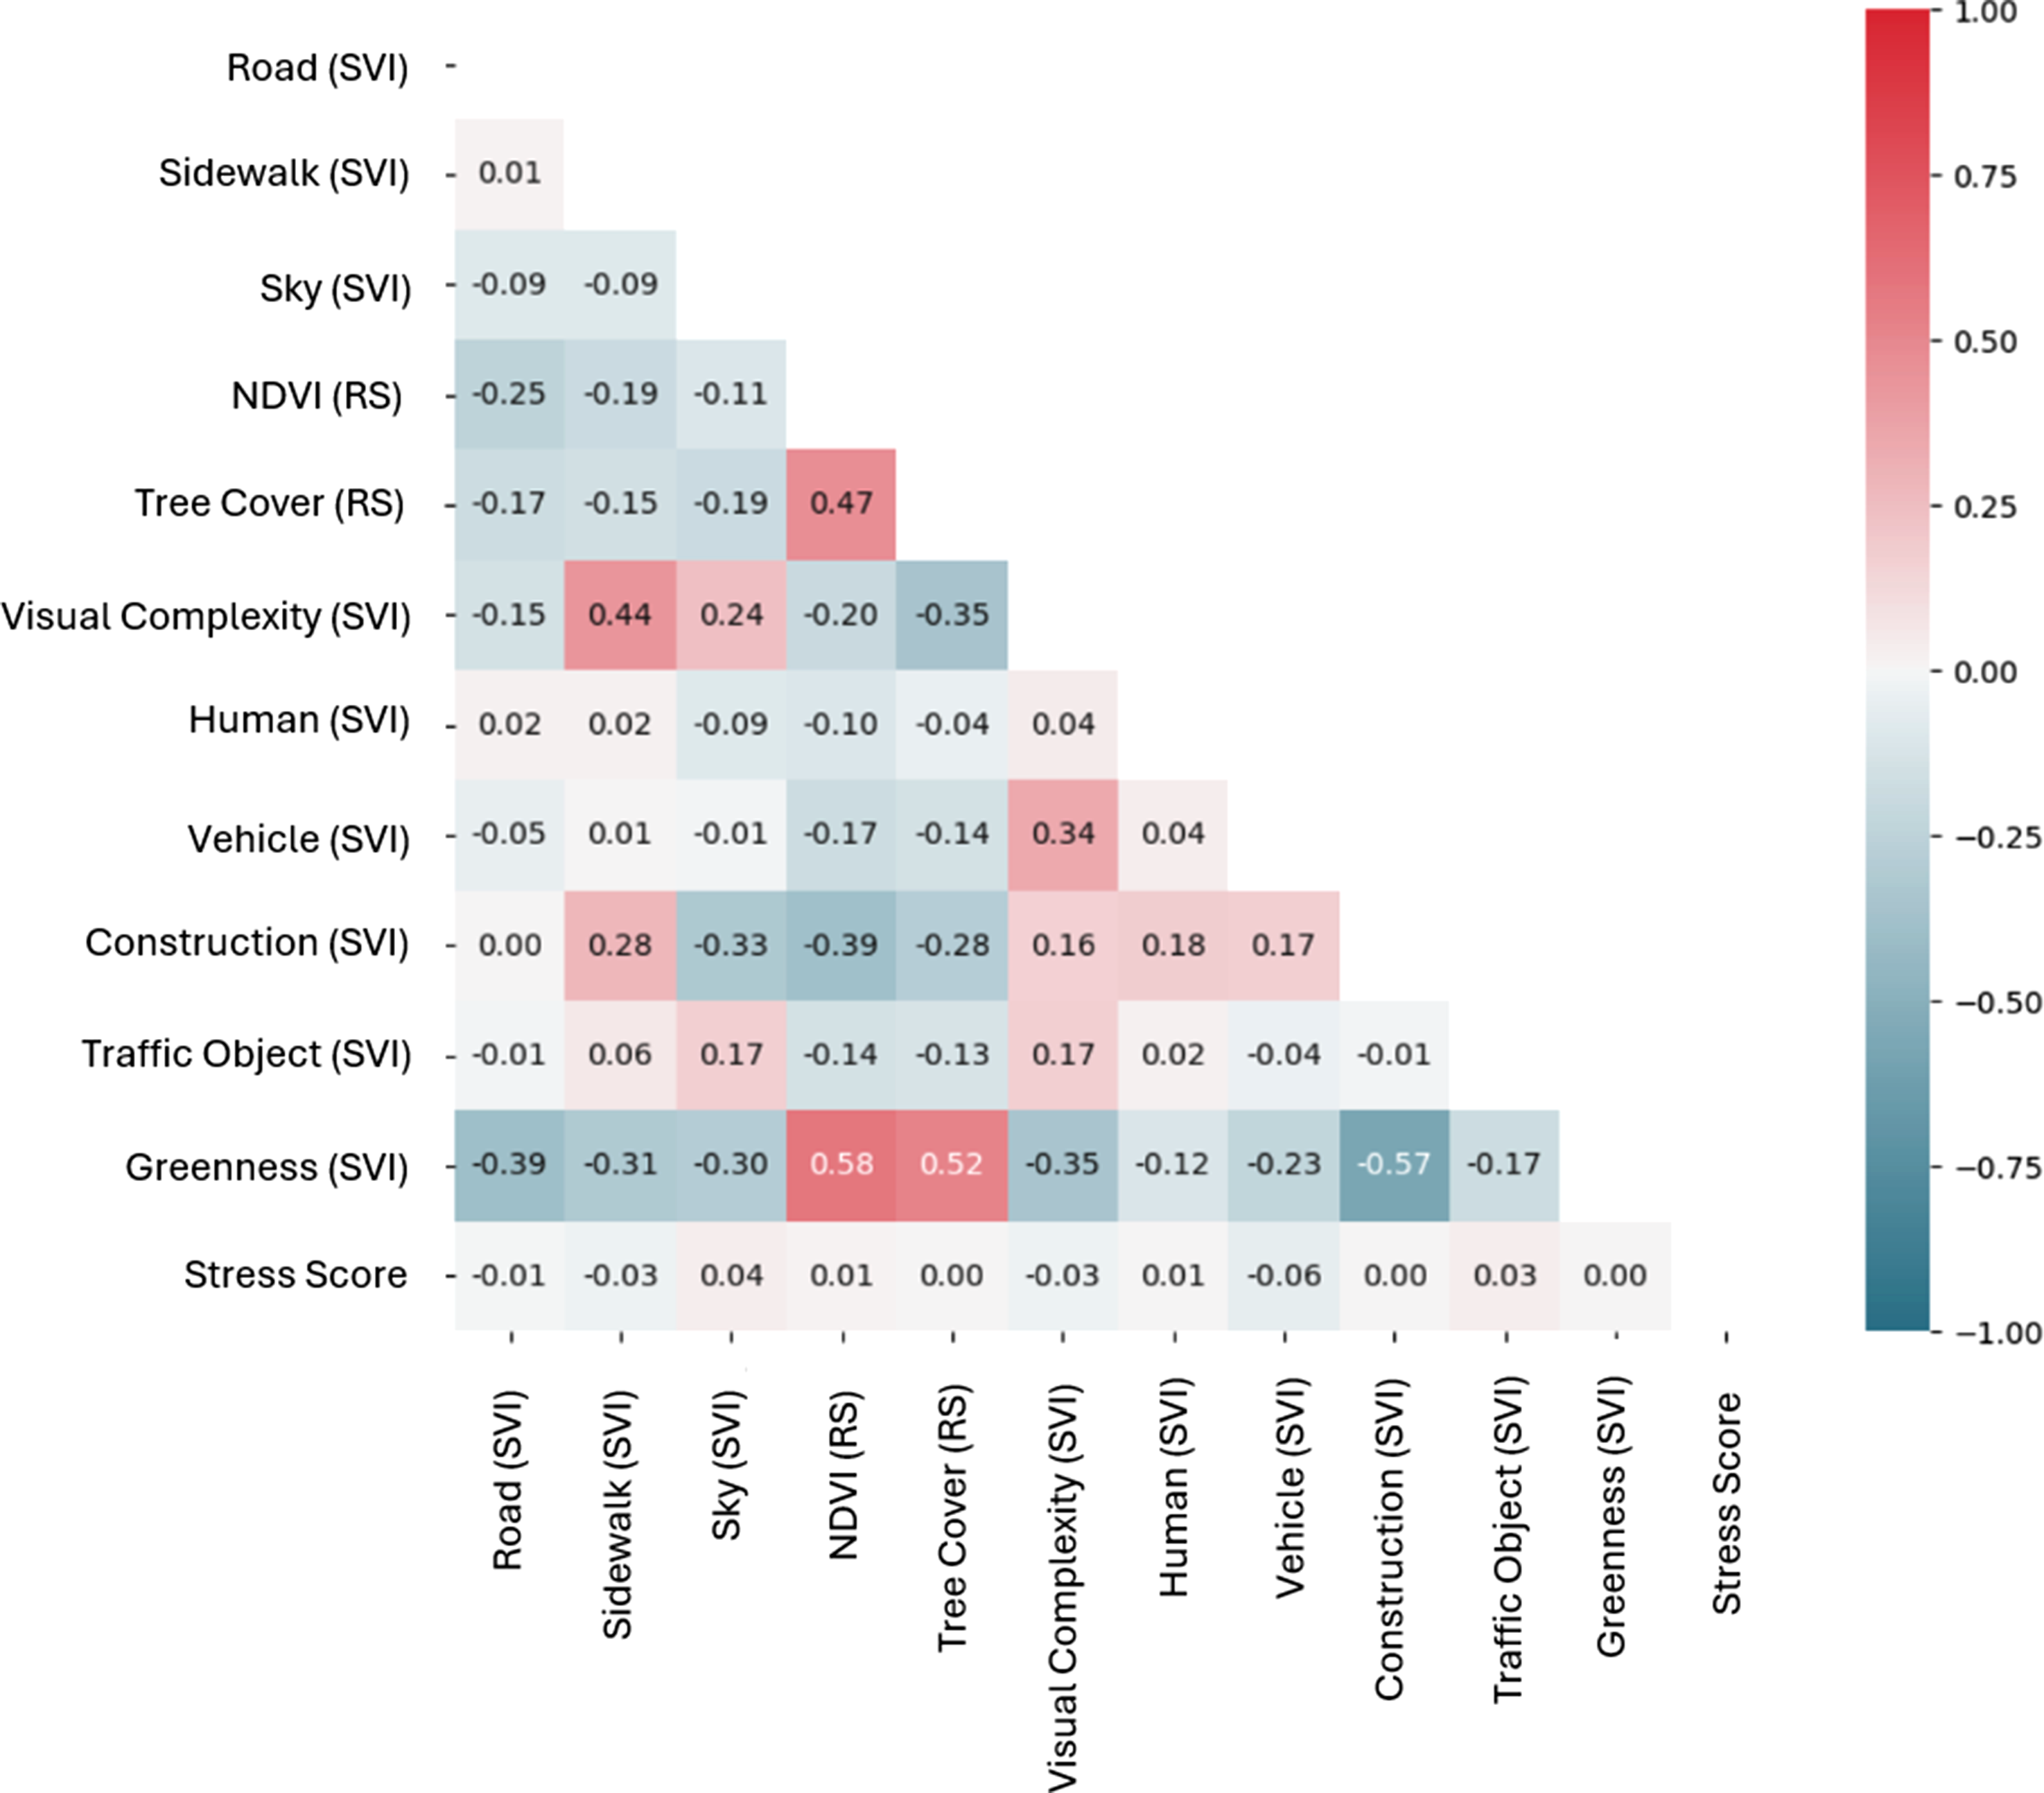
In line with the findings of Helbich et al. (2021), we observed that greenness, NDVI, and tree cover features provide different perspectives on the horizontal and vertical green view of an area. There was a negative association between construction, visual complexity, and greenness perspectives. Visual complexity was positively associated with detected pavements and vehicles, but had a negative linear relationship with greenness.
Performance metrics of the random forest model for predicting stressful versus non-stressful road segments. Results of the RF ensemble consisting of 50 trees, evaluated on 40 iterations of random draws and 20% test sets. (0) refers to non-stress samples, while (1) refers to stress samples.
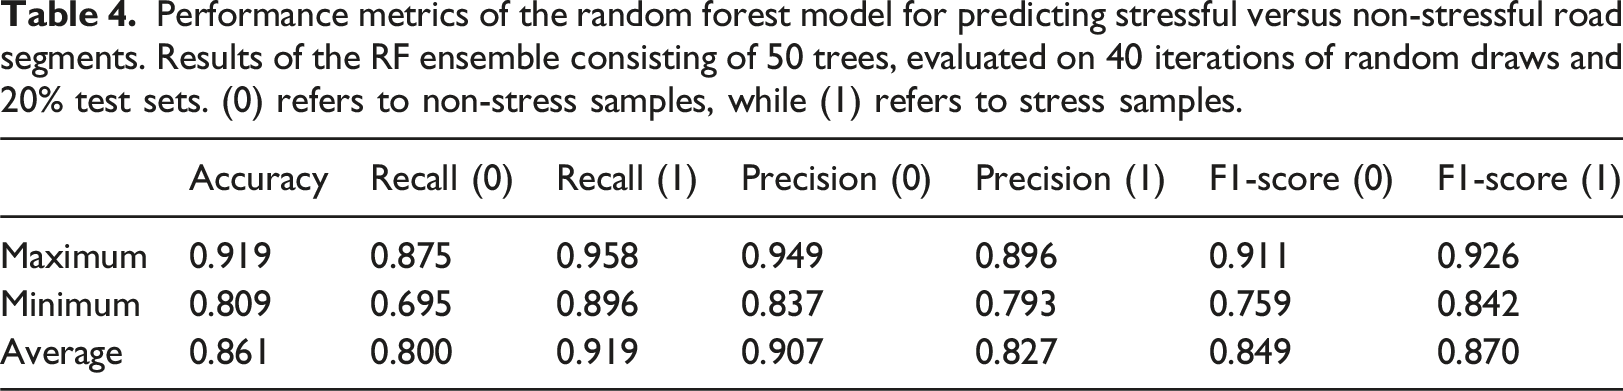
Figure 4 displays the averaged feature importance values expressed in terms of decreases in the RF model’s predictive performance. Values were averaged over 40 random train-test splits. While such importance scores should not be interpreted in absolute terms, they provide a global view on the model’s decision-making capabilities and the features that contribute to it. By introducing a normally distributed random variable in the training set, we identified and highlighted the most important variables to differentiate between stressful and non-stressful road segments. We additionally calculated the SHAP values of each feature to address local interpretability and to understand how a feature’s value impacts individual predictions of the model. RF permutation importance scores averaged over 40 independent draws of balanced training datasets.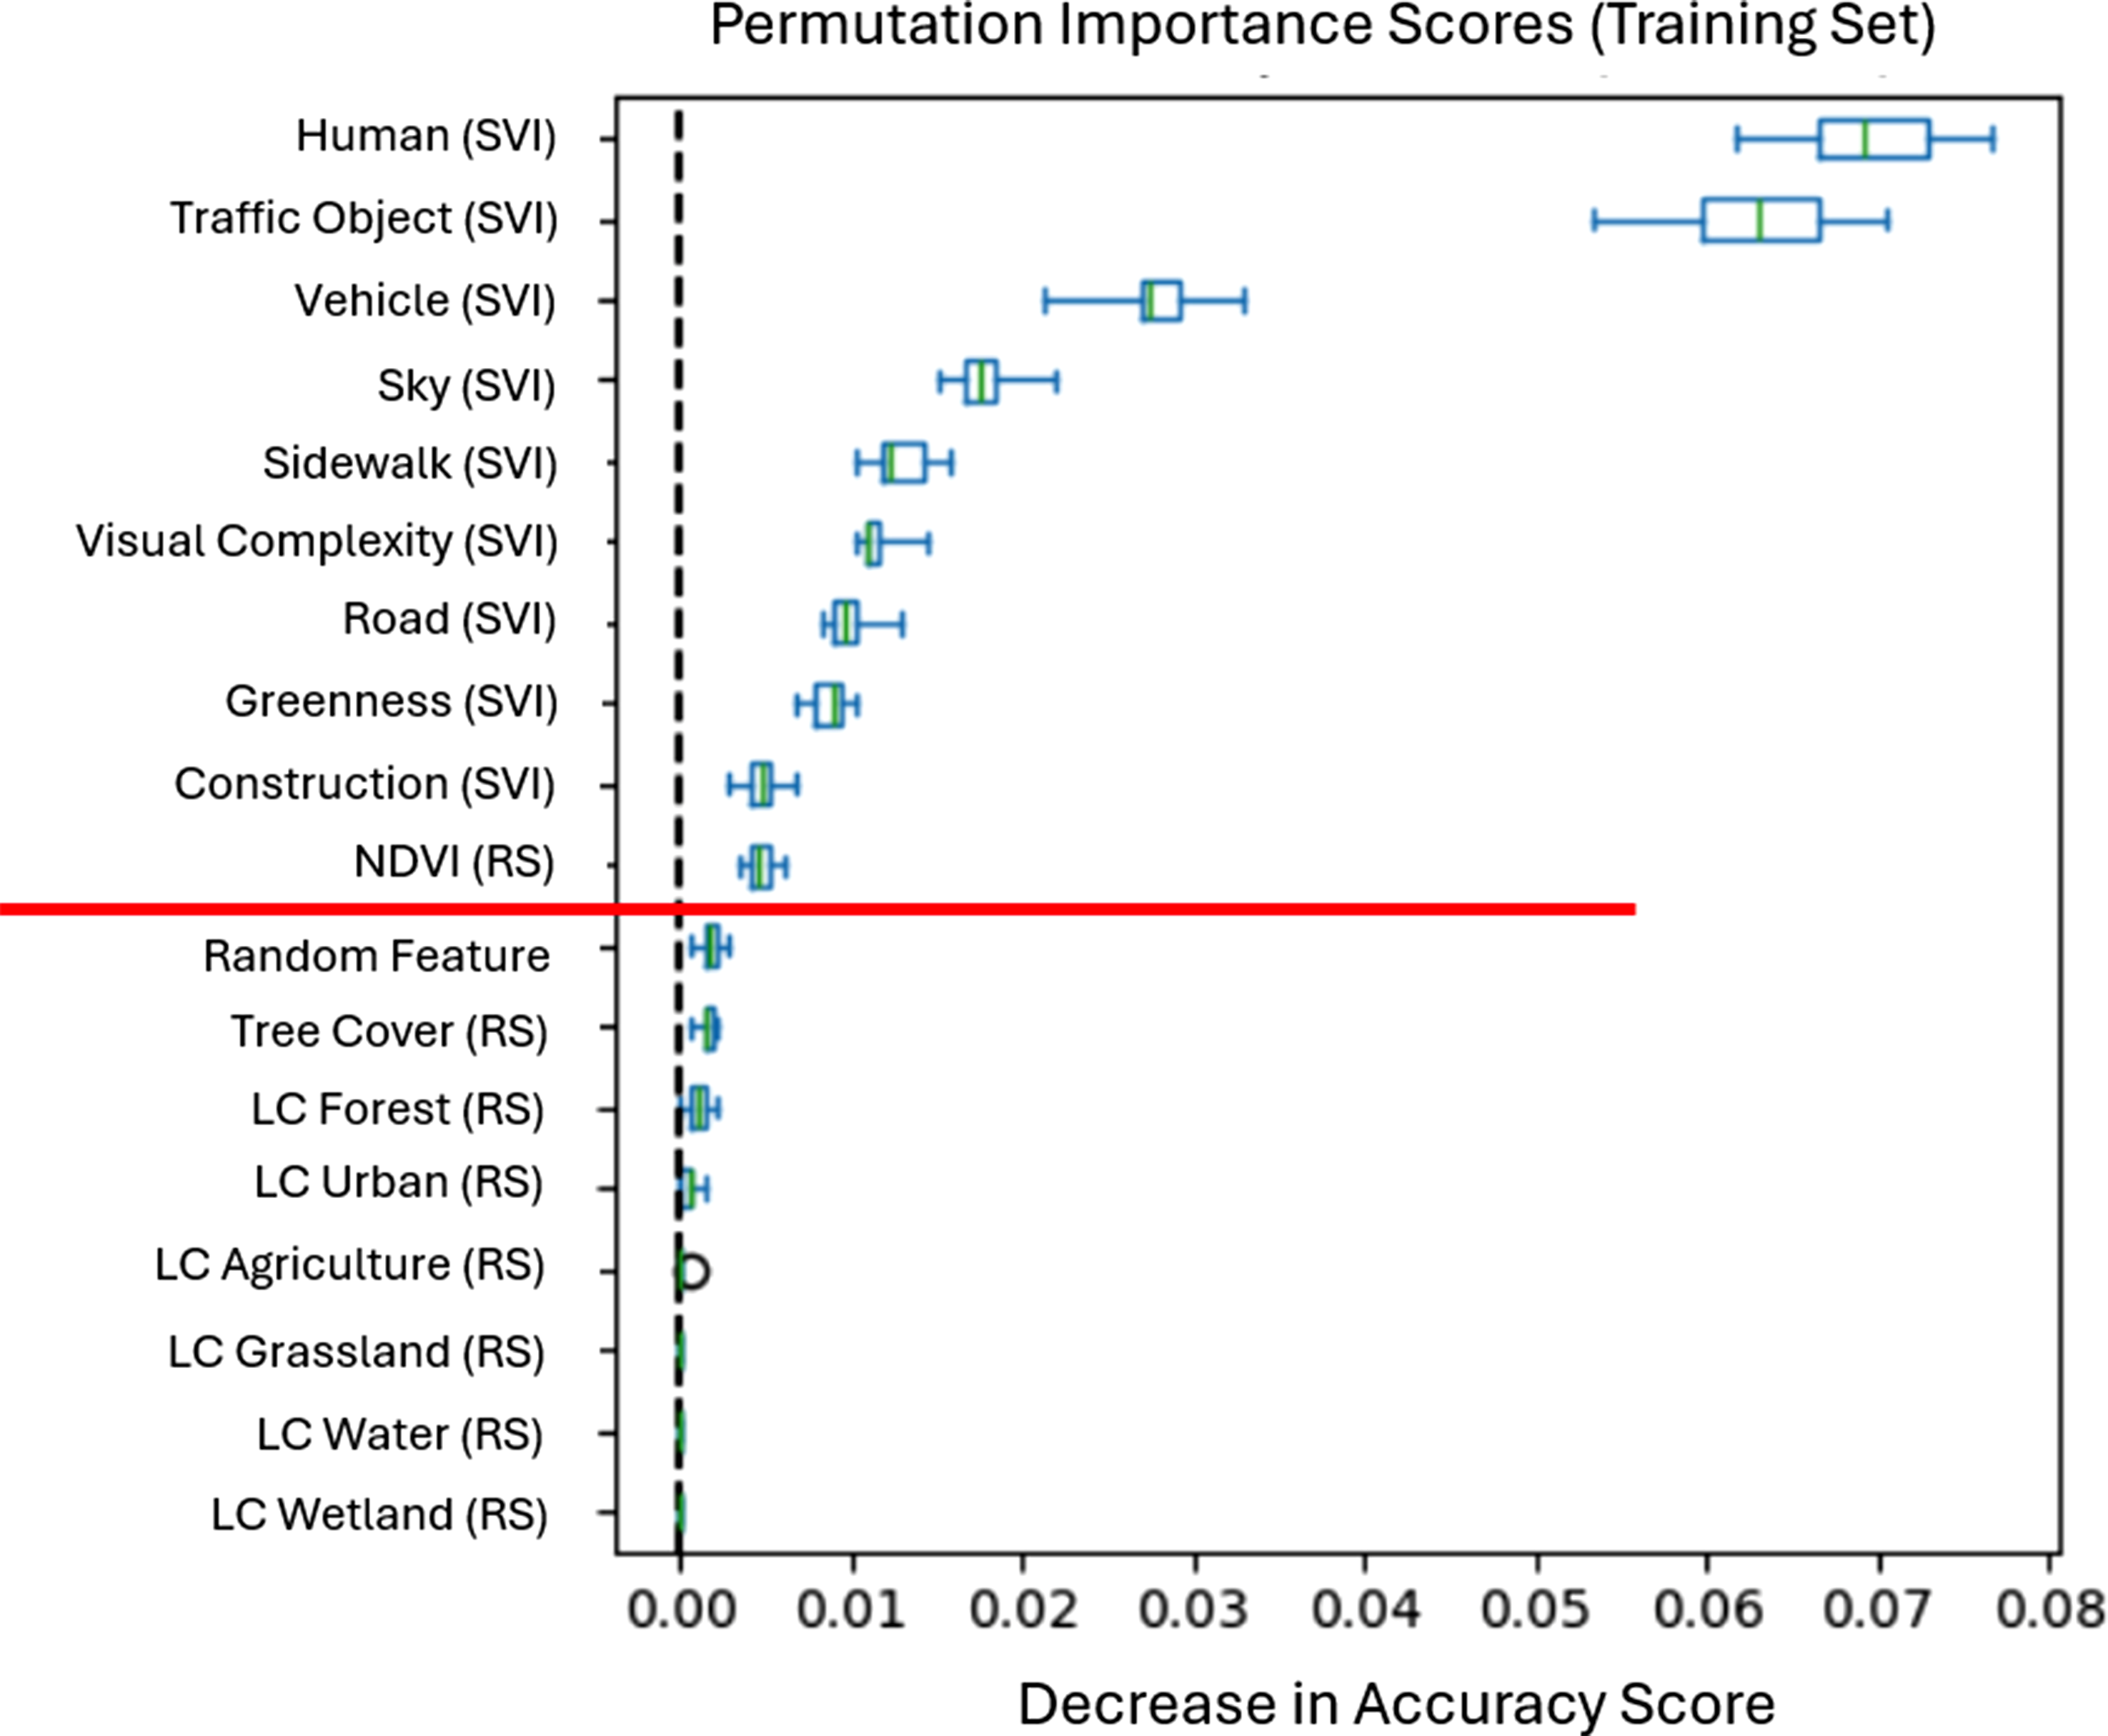
With respect to feature importance at the global model level, we observed that satellite-based land cover features with a resolution of 100 m did not help the model in discriminating between stressful and non-stressful environments, i.e., on average they performed worse than the normally distributed random variable. Comparing RS-based features with a spatial resolution of 10 m, i.e., NDVI and tree cover density, we observed that only NDVI contributes to a better discrimination of stressful and non-stressful areas. Isovist attributes from SVI, describing dynamically changing elements of the natural and built environment, played an important role in the model’s decision-making process.
Elements related to infrastructure and urban design, such as traffic objects, pavement, or road view, and the visual complexity of a scene also contributed to a better differentiation between stressful and non-stressful road segments.
After identifying relevant environmental covariates based on permutation scores, we computed SHAP values for the subset of relevant variables to understand individual model predictions. By combining these two approaches, we were able to eliminate non-informative features on the model level, and gain a better understanding of how feature values are pushing the model’s decision into one direction. SHAP values for the subset of relevant covariates are displayed in Figure 5. SHAP value distribution illustrating feature contributions to road segment stress classification.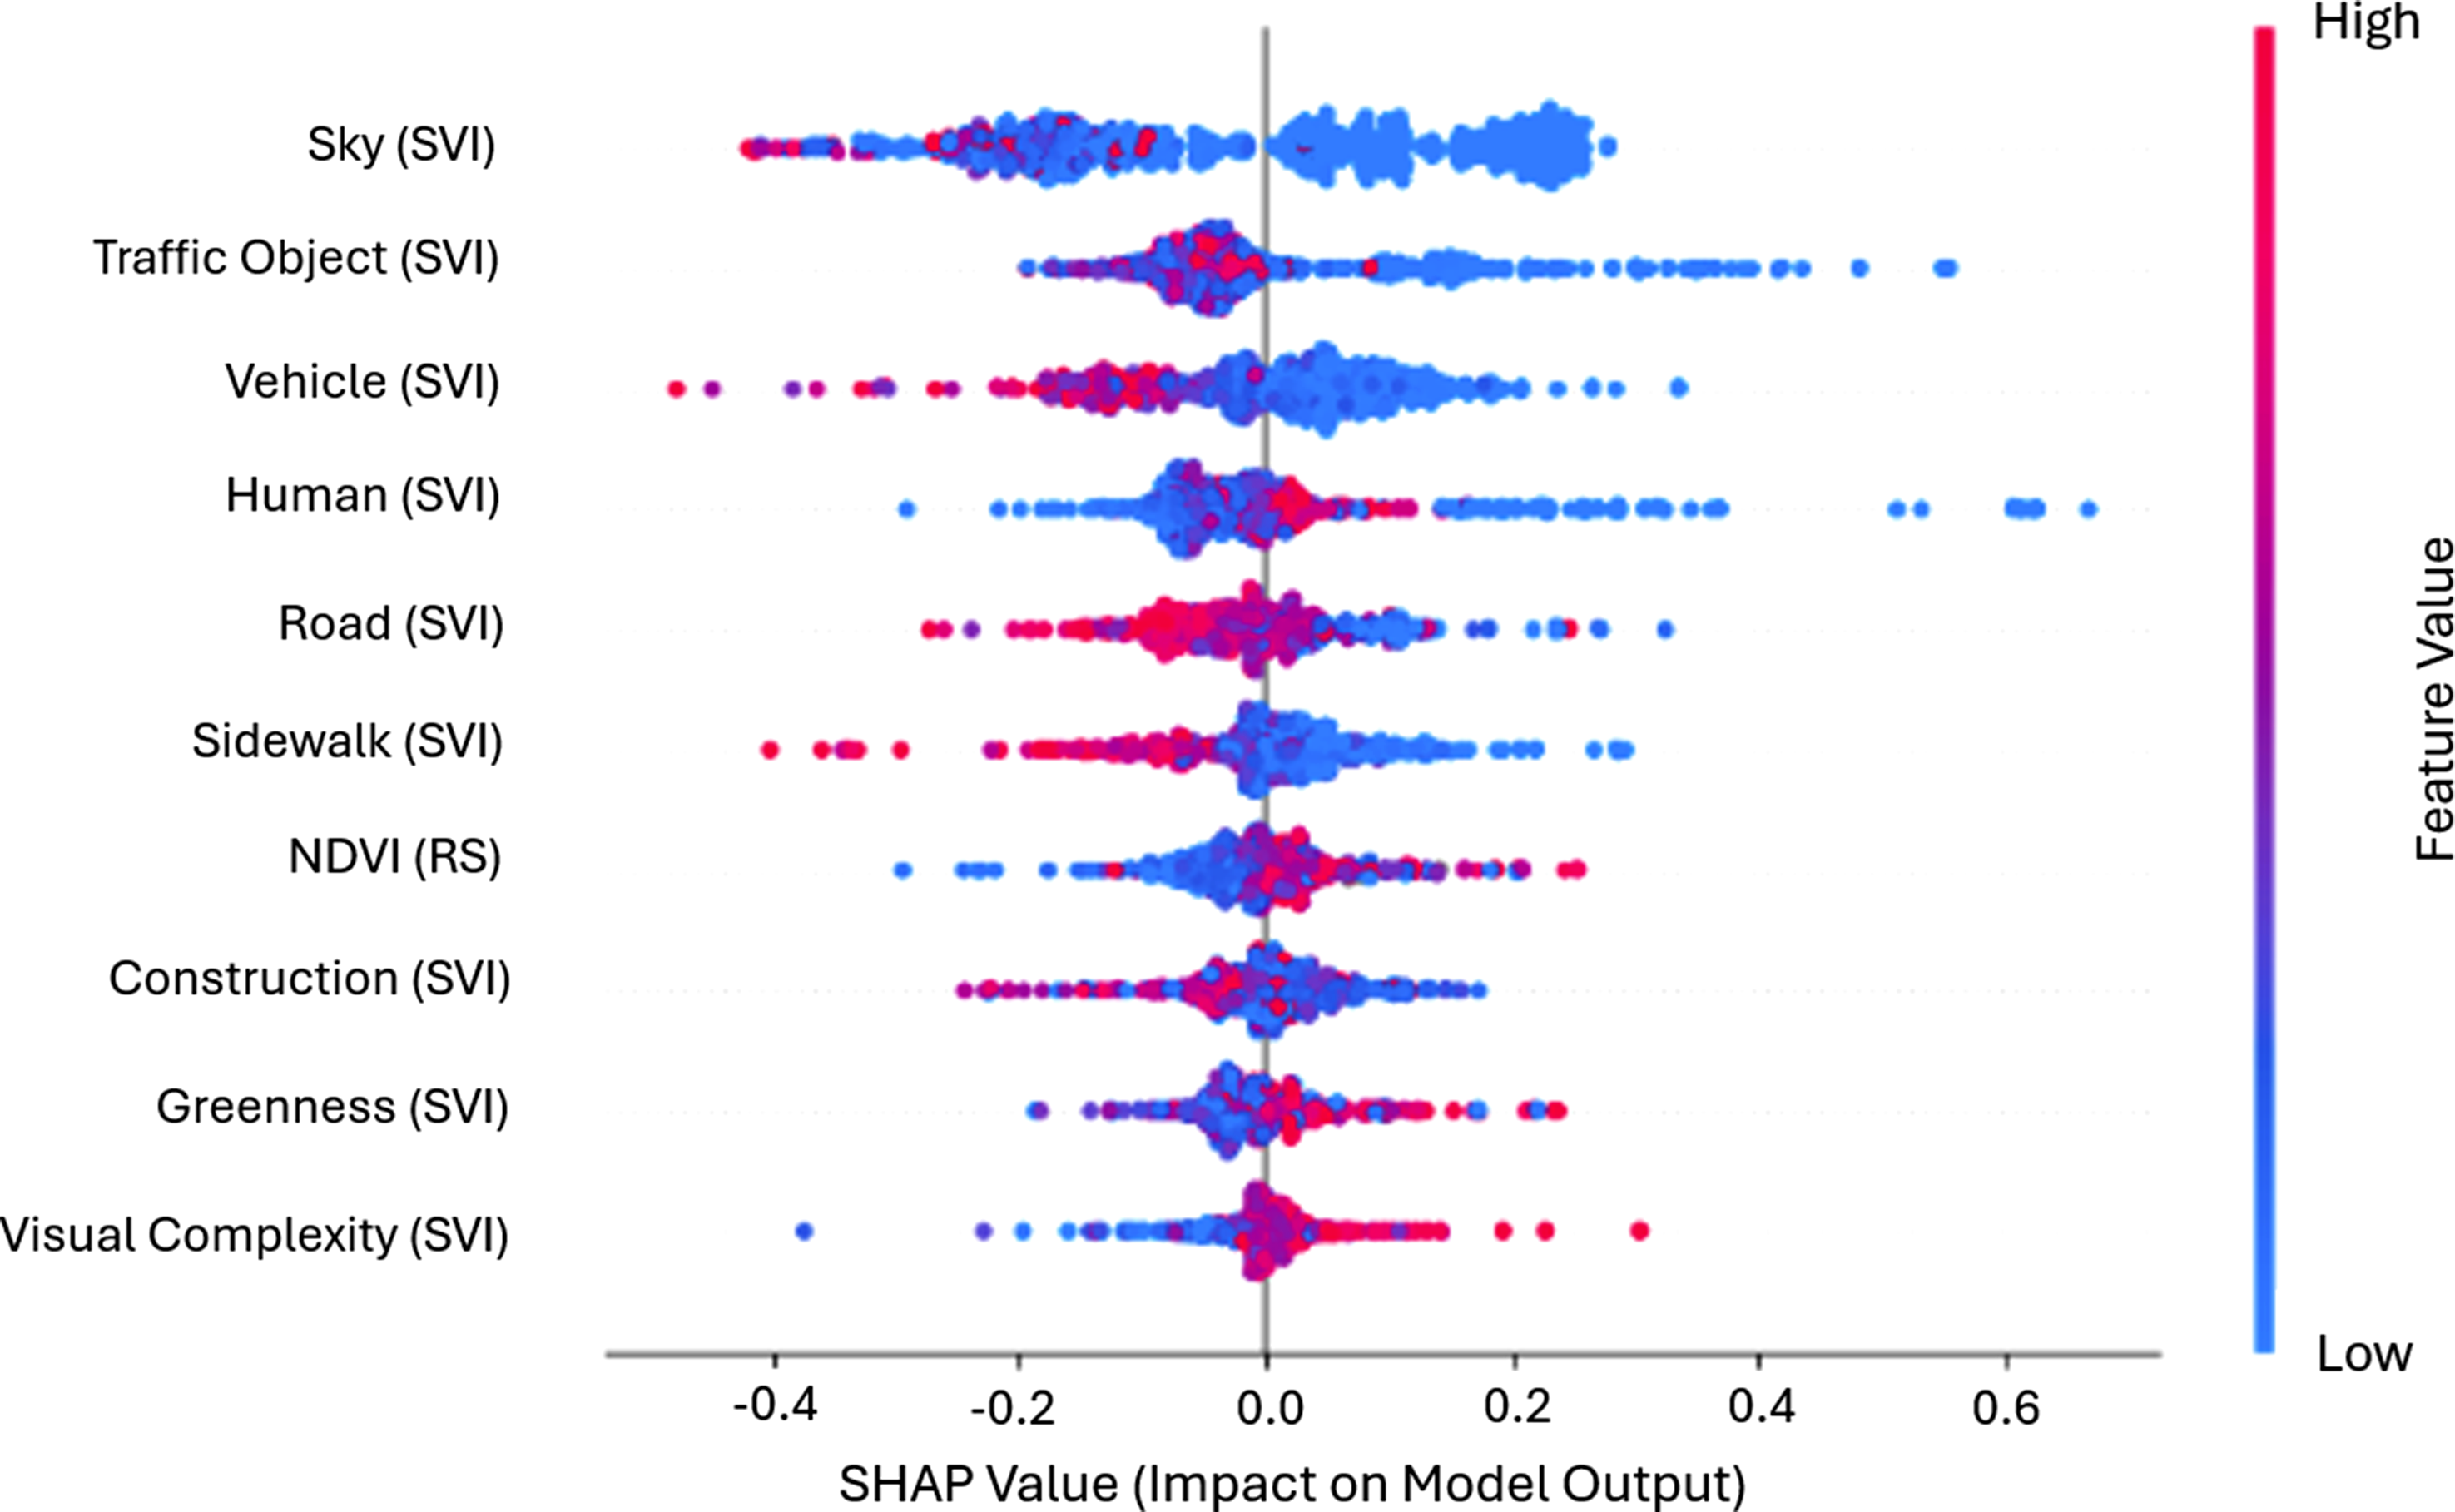
Increased road view, the availability of active mobility infrastructure, e.g., sidewalks and bicycle lanes, and a higher number of traffic objects, e.g., signage, pushed the model’s decision towards non-stressful road segments. Confirming the findings of Teixeira et al. (2020), traffic regulations in form of signs and cycle lanes or pavements that are physically separated from car lanes were associated with reduced stress levels, as they provide clear boundaries and designated spaces for different road users (Sharma and Gedeon, 2012). Higher visual complexity of a scene emerged as a stress-inducing factor, suggesting that cluttered or chaotic environments may require more cognitive processing from cyclists. Contributing to the diverging literature on green areas and their influence on well-being (Marquart et al., 2022; Titze et al., 2008; Tran et al., 2020), we observed that higher values of NDVI, capturing the horizontal green aspect of an area, and higher values of greenness, capturing green view from an isovist perspective, increased the chance of a road segment being classified as stressful.
Discussion
Considering the complexity of urban environments and the interplay between static and dynamic stress factors experienced in urban cycling activities, several aspects and potential limitations of the proposed methodology and the consequent results are discussed in the following.
Discussion of methodology
While combining wearable sensor measurements with an algorithmic approach to detect stress based on involuntary physiological reactions of the human body provides an unbiased way of quantitatively assessing stress in urban cycling activities, study design, duration, geographic scope, and sample size have major implications on (environmental) covariates that can be derived and related to spatially aggregated stress measurements (Bigazzi et al., 2022). In addition to factors concerning the study protocol, the availability, granularity, and completeness of data sources used for data enrichment affect the suitability and applicability of the proposed methodology.
Furthermore, it is essential to ensure the study period aligns temporally with external data availability.
The availability of OSM road network attributes varies by location, as it depends on community contributions (Barron et al., 2014). In Osnabrück, only 10 to 15% of road segments that were travelled by participants in the study had street-level attributes such as lane count or road width. Due to this limited coverage, we excluded OSM attribute features and only used the basic road network for spatial analysis. The Overture Maps Foundation offers an alternative schema with additional road attributes (Ballantyne and Berragan, 2024). However, future studies are needed to compare OSM attribute data with Overture, which uses ML to add descriptive features.
In addition to OSM features, we used RS data from aggregated satellite imagery or pre-existing, open-access products. The data’s limited spatio-temporal resolution was assumed sufficient for our analysis, which may have resulted in uncertainties. Future studies could consider images taken on the days of the field data collection to reduce imprecisions. Additionally, a more dynamic sampling approach that explicitly considers segment length to join the RS data with road segments could be considered. In topographically more complex regions, the incorporation of a Digital Elevation Model (DEM) should also be investigated.
The proposed methodology required dense Mapillary SVI data for the traversed routes. Seasonal changes and inconsistent street-level coverage can affect SVI-based greenness estimates, particularly for foliage. While coverage and seasonality effects were not an issue in the city of Osnabrück and the time frame of our study, being a crowd-sourced initiative, street characterisation based on Mapillary SVI can be impacted by the activity of the community. Although we focused on contributing a replicable methodology based on openly available datasets, many road segments were excluded due to missing data from both OSM and Mapillary. Commercial products such as Google Street View may have better image quality and spatio-temporal coverage (Juhász and Hochmair, 2016). To address limitations in capturing dynamic features, future studies could use first-person videos to assess real-time environmental changes. A comparison between first-person video segmentation and SVI-based segmentation could clarify how moving objects like other road users influence physiological responses.
We used a RF model to predict the stress potential of road segments and applied SHAP values for local interpretability. While other graph-based ML models could better capture the topological structure of urban networks (e.g. Graph Neural Networks (GNNs)), we chose a RF due to the limited and imbalanced sample, as it reduces overfitting by training decision trees on subsets of data and features. While SHAP offers model-agnostic explanations at the sample level, it does not capture feature interactions (Lundberg and Lee, 2017).
While our study involved a comparatively large sample size consisting of 89 voluntary participants and a study area covering the city of Osnabrück, the limited geographic scope and timing of the data collection restricted the evaluation of different meteorological conditions and differences in air quality. The filtering constraint added for objective assessment of a road segment, which excluded OSM street segments traversed by less than 3 runs, added limitations in terms of measurable environmental diversity. Rural, less frequently cycled areas, exhibiting distinct environmental characteristics, were excluded due to this. Considering that different cities have inherent and diverging environmental stress conditions (Teixeira et al., 2020), the data collection should therefore be replicated at other cities.
Additional considerations should go into the selection of an algorithm to detect stress from physiological parameters. Although stress was measured based on individual baselines and deviations of filtered skin conductivity reactions (SCR) to alleviate the effect of physical activity on skin conductivity measurements, the methodology proposed by Moser et al. (2023) is based on laboratory test data, where study participants did not perform any physical activity. Hence, the algorithm should be evaluated at different, topographically more diverse cities, to measure the effect of elevation, humidity, speed of movement, and physical exertion on measured stress (Beermann and Sieben, 2023; Mohsen Nazemi et al., 2025). In general, cities where field studies are conducted should be selected based on size, geographical location and the availability of open data sources to provide environmental context for subjective active mobility experiences and potential confounding factors.
(Ballantyne and Berragan, 2024). However, future studies are needed to evaluate how much this data differs from OSM for the described purpose, and the quality of the information that is added based on ML techniques.
Discussion of results
Previously mentioned methodological choices and limitations concerning the availability, granularity and quality of external (open) data sources also affected the results of our study on different levels. The stress assessment under varying meteorological conditions yielded insignificant results, likely due to the imbalanced sample of runs, where most cycling trips took place during pleasant weather conditions. While Meteostat provides historical data, limited granularity — especially for air quality measurements — prevented segment-level analysis. Future studies should include onboard environmental sensors to address this gap.
A RF model trained on features derived from open data yielded promising results (accuracy: 86.07%, recall: 91.89%, precision: 82.69%, F1-score: 86.98%), indicating that environmental covariates influence cyclists’ stress. Considering that MOS are rare events, handling class imbalances is an important preprocessing step before modelling, which we addressed by randomly undersampling non-stress road segments, and splitting the resulting data into independent train- and test sets for evaluation. Resulting subsets, each consisting of 680 randomly drawn road segments with evenly balanced stress labels, may have pushed the model towards learning to predict the positive class, which is shown by the high recall value for correct stress classifications (class (1) in Table 4). The relatively small sample size could have also introduced some overfitting, which we tried to mitigate by the selection of a RF, consisting of 50 independent Decision Tree (DT) models, each trained on a different subset of samples and features, essentially coping with potential overfitting.
However, with an overall F1-score of 86.98% across 40 iterations of random subset selection, the model learned to capture the underlying associations between spatial context and perceived stress in cycling.
The resulting model, combined with global and local feature importance methods, showed that urban and traffic design elements, including mode-specific infrastructure such as sidewalks and bicycle paths, were important factors that led to more comfortable experiences in cycling activities. The variable ’sidewalk’, which is per labelling policy of the Cityscapes dataset (Cordts et al., 2016) differentiated from the ’road’ class by the presence of a (raised) kerb, also encompasses cycling lanes, and showed a positive relationship between mode-specific mobility infrastructure and increased cycling comfort. This is reflected by the importance values of features in Figures 4 and 5 and in line with previous findings of other studies conducted by Panter et al. (2008), Titze et al. (2008), and Panter and Jones (2010). Higher feature values in the covariates ’traffic object’ and ’sidewalk’, displayed in Figure 5, corresponded to a higher chance of the model predicting a road segment as non-stressful. Additionally, street segments with higher percentage of visible road view had a higher chance of being classified as non-stressful.
Increased values in the covariate ’Visual Complexity’ tended to push the model’s decision towards stress predictions. Benita and Tunçer (2019) show that a high diversity of visible elements in a scene leads to an overwhelming amount of visual stimuli, which can distract cyclists and lead to stress causing sensory overload. This is supported by our analysis, where streets with high values of visual complexity, are more likely to be classified as stressful. Contrary to previous findings (Marquart et al., 2022; Tran et al., 2020), our analysis showed that areas with higher percentage of green space (measured by NDVI and greenness values) coincided with road segments that were classified as stressful. Light-shadow effects from trees or dense vegetation can reduce visibility along cycling routes, potentially raising stress due to safety concerns. This explanation would be supported by the elevated NDVI values in Figure 5, where NDVI is essentially a quantification of horizontal greenness, and pushes the model’s decision towards classifying a road segment as stressful.
Dynamic covariates, specifically ’human’ and ’vehicle’, summarised as pixel counts of persons, riders, cars, motorcycles, and bicycles visible in scenes, ranked among the most important features in the model’s classification of stressful versus non-stressful areas. However, SHAP values of these variables showed that the model relates increased values in ’human’ and ’vehicle’ to non-stressful streets, which raises some questions concerning the applicability of using SVI as data source for capturing dynamic road user interactions. Restricting the analysis to open data sources with feature selection based on importance scores introduces some additional bias through data availability constraints. Documented data gaps and incomplete attribute coverage within the study area systematically excluded relevant environmental variables, resulting in a restricted feature space that may overemphasize stationary attributes while limiting the representation of dynamic, visibility-related factors which are approximated through SVI.
Since road user interactions can create unpredictable traffic conditions (Markkula et al., 2023), future research should explore their impact on stress. In a follow-up study, SVI-based results could be compared with those from first-person video to better assess the role of dynamic elements information from both OSM and Mapillary.
Conclusion
In this paper, we presented a multi-modal methodology that leverages openly available datasets, combined with individual environmental perceptions captured quantitatively through wearable sensor technologies, to better understand stress factors in urban cycling activities. By analysing open data-based static and dynamic environmental features through feature importance methods at global and local scales, we identified key environmental covariates that influence cyclists’ stress levels (
Addressing
Within the proposed methodology, we trained a RF on the subset of relevant environmental features to categorize road segments as stressful or non-stressful. High average performance metrics (accuracy: 86.07%, precision: 86.67%, recall: 85.92%, F1-score: 85.92%) showed that our model captures the relationship between the stress potential of road segments and the influence of the surrounding environmental characteristics (
However, the availability, quality and granularity of the data plays an important role and may leave out some relevant confounding factors, which cannot be accounted for. Future research should address the effects of dynamically changing attributes such as the behaviour of other road users through first-person video footage.
While our dataset was collected through an extensive field study that spanned several months, with a sample size of 89 study participants, who volunteered to wear the Empatica E4 wrist band on their daily cycling trips and covered a large proportion of the city Osnabrück, the study design, duration and geographic scope had major implications on identifiable (environmental) stress covariates. Results of this work should be investigated at other cities, ideally with a larger sample size and topographically more diverse study area. Considering that our use case was exclusively related to cyclists’ stress responses, we also encourage future research to adapt the proposed approach by extending it with other data sources (e.g. air quality, meteorological, or first-person view video data) and other modes of mobility (e.g. walking, jogging, driving).
Footnotes
Acknowledgements
This research was funded by the Austrian Science Fund (FWF) through the project “Urban Emotions” (reference number I-3022) and by the German Federal Ministry for Digital and Transport (BMDV) through the project ESSEM (reference no. 19F2195A). Approval of the research activities including ethical and experimental considerations was granted by the Austrian Science Fund (FWF) through the Urban Emotions project (reference number I-3022), and performed in line with the 2013 WMA Declaration of Helsinki. The authors thank the participants for their time and effort, informed consent was obtained from all subjects involved in the study.
Funding
The author(s) disclosed receipt of the following financial support for the research, authorship, and/or publication of this article: this research was funded by the Austrian Science Fund (FWF) through the project “Urban Emotions” (reference number I-3022) and by the German Federal Ministry for Digital and Transport (BMDV) through the project ESSEM (reference no. 19F2195A / 19F2195C).
Declaration of conflicting interests
The author(s) declared no potential conflicts of interest with respect to the research, authorship, and/or publication of this article.
Data Availability Statement
Data sharing not applicable to this article.