
Abstract
This featured graphic visualises internal migration flows in Bulgaria using settlement-level census data from 1934 to 1946, highlighting how topography and local factors shaped migration and urbanisation. By combining spatial interaction models (SIMs) and edge-path bundling techniques, we reveal fine-scale migration corridors and the role of mountainous terrain in influencing mobility. The SIM approach goes beyond aggregate district analysis to provide new insights into rural depopulation and urban growth.
Keywords
Main
Internal migration has been a central driver of demographic change in Bulgaria, particularly in the years following 1934, a period marked by political, economic, and social transformation (Mladenov and Ilieva, 2012; Petrov, 2021). Traditional migration analyses in Bulgaria have relied on aggregated district or municipal data, limiting insight into local migration drivers and environmental effects (Mladenov et al., 2008; Peykovska, 2019). In this study, we employ digitised, geocoded settlement-level census data to analyse migration patterns across 5302 settlements for the 1934–1946 intercensal period.
The data, sourced from the Bulgarian National Statistical Institute (NSI), comprise population counts for each settlement at the 1934 and 1946 censuses. This fine-grained spatial resolution enables us to model estimates for inter-settlement migration flows, moving beyond prior work focused mainly on higher administrative levels. Migration flows were estimated using a spatial interaction modelling framework, with flows between settlements modelled as a function of population size, accessibility (road network distance), and topography (terrain ruggedness derived from SRTM data) (Dennett, 2018; Ramos, 2016; Wilson, 1971). This allowed us to investigate both demographic and environmental determinants of migration during this formative long-term period in Bulgarian urban–rural development (Kabadayi et al., 2024).
Figure 1 illustrates internal migration flows in Bulgaria. Traditional flow visualisation techniques often generate visually overwhelming results due to line overlap and clutter, obscuring underlying spatial patterns (Vrotsou et al., 2017). To address this, we applied a novel edge-path bundling algorithm (Peterka, 2025; Väisänen et al., 2025a, 2025b; Wallinger et al., 2022) to aggregate parallel flows and reveal coherent migration corridors and regional structures. Urban centres emerge as major attractors, while mountainous regions – covering nearly half the country – display distinctive out-migration and lower connectivity. Edge-path bundled (Väisänen et al., 2025a; Wallinger et al., 2022) internal migration flows in Bulgaria (1934–1946) reveal major movement corridors. The line colour and thickness reflect flow magnitude; and settlement marker size shows population count. Only flows above the 95th percentile are shown. The inset on the bottom-rigth corner compares a conventional (unbundled) flow map with the same filters.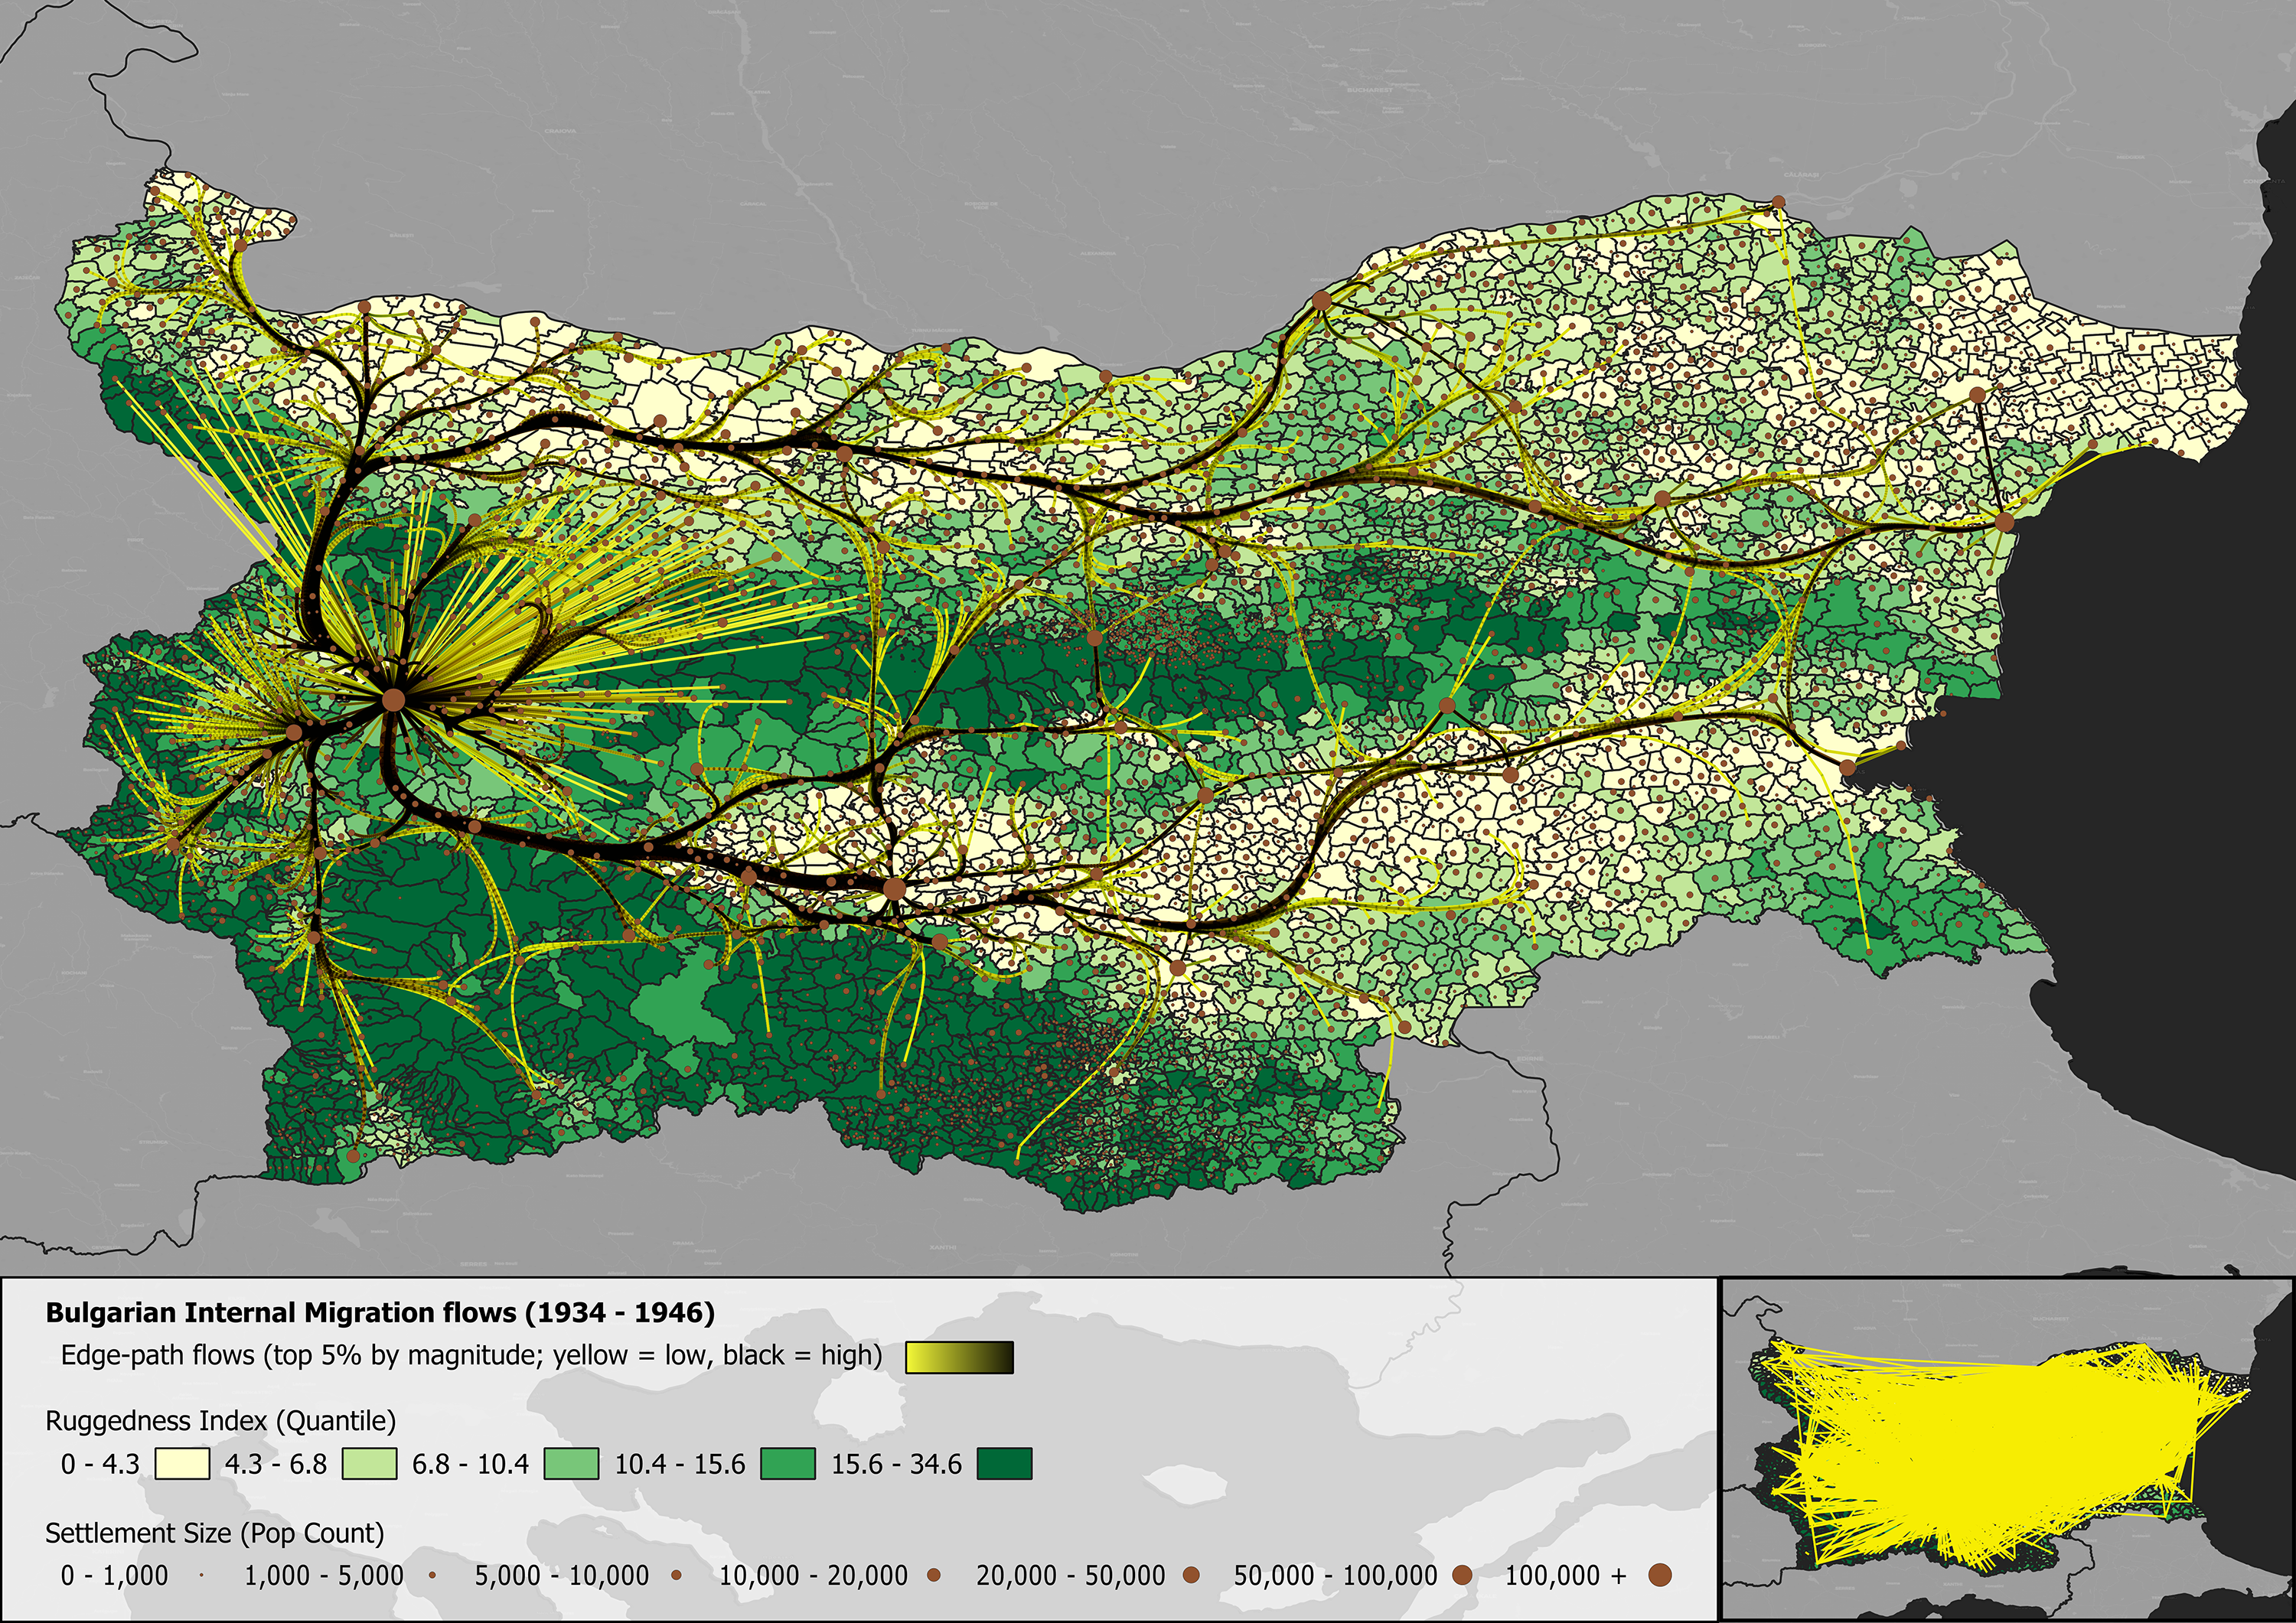
Additionally, the background shading in Figure 1 represents a ruggedness index, classified into quantiles, derived from geographic terrain data. This adds environmental context to migration patterns, suggesting an interplay between geography and migration behaviours. Settlements are marked according to their population sizes, further emphasising urbanisation and rural depopulation trends occurring within this period.
In contrast, the inset on the lower right displays the same dataset, without bundling, clearly demonstrating the complexity and visual clutter that traditional methods produce. This direct comparison highlights the efficacy of bundling in clarifying migration routes and allowing researchers to readily interpret spatial relationships and migration trends. The selected colour palette adheres to principles of inclusive design, specifically optimised for colour-blind accessibility, utilising the scientifically validated ‘ColorBrewer’ scheme (Brewer, 1994; Brewer et al., 2003). In addition, we tested the image using the online image tool of Stevens et al. (Stevens et al., 2024). This ensures that the visual insights presented are accessible to all, making the research more inclusive.
By combining fine-scale census data, spatial interaction modelling, and advanced flow visualisation, our study provides a robust framework for understanding the interplay between migration, landscape, and demographic change. This integrative approach reveals patterns and drivers of mobility that are often lost in aggregate analyses and offers methodological guidance for migration studies in other contexts marked by environmental diversity and rapid urbanisation.
Footnotes
Acknowledgements
The authors gratefully acknowledge the Bulgarian National Statistical Institute for providing census data and the Bulgarian Agency for Geodesy, Cartography, and Cadastre for essential geospatial information.
Funding
The authors disclosed receipt of the following financial support for the research, authorship, and/or publication of this article: Funding support was provided by the UrbanOccupationsOETR European Research Council (UrbanOccupationsOETR, grant agreement ID: 679097 and GeoAI LULC Seg, grant agreement: 101100837, PI: M. Erdem Kabadayi) and by the UK Research and Innovation Future Leaders Fellowships (grant references: MR/Y011856/1 and MR/S01795X/2, PI: Ana Basiri). The funders had no role in study design, data collection and analysis, decision to publish, or preparation of the manuscript.
Declaration of conflicting interests
The authors declared no potential conflicts of interest with respect to the research, authorship, and/or publication of this article.
Data Availability Statement
Population data is available on the Bulgarian National Statistics Institute (NSI) website.