
Abstract
The emerging generative artificial intelligence (generative AI) model, Stable Diffusion, is increasingly recognized as a promising tool for efficiently translating public preferences and ideas into spatial design representations. At the same time, deep learning techniques and crowdsourcing methods have enabled the large-scale collection of public walking preference data. This study introduces an innovative approach that leverages the Stable Diffusion model, combined with extensive public walking preference data, to create a workflow for generating revitalized street scenes aimed at enhancing subjective walking preferences. Compared to existing GAN-based methods, the approach used in this study is more efficient to train and generates more realistic and controllable outputs. The approach was tested and validated using data from Tokyo’s Setagaya ward, confirming its effectiveness. This workflow represents a significant advancement in street design and redevelopment, delivering practical value and innovation by equipping designers and planners with rapid visual insights in the early design stages. Additionally, it fosters democratic urban design by utilizing crowdsourced data as training input for generative AI models.
Keywords
Introduction
Pedestrian-prioritized street designs at the micro-scale are increasingly common in urban areas worldwide, as they align closely with people’s everyday perceptions and needs (Millstein et al., 2013). Since 2020, the Tokyo Metropolitan Government has launched several streetscape transformation initiatives aimed at converting public spaces, where diverse people gather and interact, into pedestrian-friendly, people-centered zones, promoting a “comfortable and walkable urban center” (MLIT, 2021; Tokyo Metropolitan Government, 2023). These initiatives include widening sidewalks, adding accessible features, providing seating, promoting ground-level retail, increasing building permeability, introducing greenery and water features, and creating a connected pedestrian network. Various ongoing projects across Tokyo highlight the city’s commitment to becoming a more pedestrian-friendly megacity (MLIT, 2021).
By aligning practical street design and transformation with the theoretical foundations of modern urban design, the city has witnessed a simultaneous shift toward human-centered design, which requires an understanding of “what people perceive and prefer” (Choi et al., 2016). Hence, in the design process, evaluating people’s subjective preferences toward the street environment is crucial as solely focusing on objective factors, such as the number of street element installations, is not sufficient (Qiu et al., 2023). Recently, with the development of online crowdsourcing methods and their integration with deep learning technology, innovative approaches have been proposed for the large-scale collection and prediction of people’s environmental perceptions and preferences (Dubey et al., 2016; Huang et al., 2024; Ogawa et al., 2024).
Understanding public perceptions and preferences is one aspect; however, automatically incorporating and translating these perceptions and preferences into actual design solutions is another. Generative artificial intelligence (generative AI), specifically Generative Adversarial Network (GAN) models, is seen as a technology capable of achieving this purpose. However, the limitations of GANs in realistic rendering and controllability (Joglekar et al., 2020) restrict their widespread application. By contrast, Stable Diffusion models have emerged as a promising avenue for creating highly controllable and lifelike spatial design representations that reflect subjective attitudes (Mishra et al., 2023). This new technique provides a visible and intuitive understanding for designers and space users, facilitating design decision-making processes (Kapsalis, 2024). Nonetheless, the integration of crowdsourced survey data with Stable Diffusion to improve environmental perceptions and preferences for urban spaces remains nascent, especially in street design characterized by a lack of discussion on a reliable workflow. Therefore, the present study addressed this gap by exploring a workflow to automatically generate street designs that improve walking preferences using crowdsourced surveys and Stable Diffusion models.
Literature review
Quantification of human perceptions and preferences
Quantitative measures such as stated-preference surveys and behavior mapping have long been employed to collect public perceptions and preferences for an extended period. The connection between spatial perception and associated design elements has been observed (Ewing and Handy, 2009; Gehl et al., 2006). However, these investigations have frequently employed manually collected limited datasets, using labor-intensive and time-consuming methods.
With the rise of online crowdsourcing and computer vision technologies, more studies are focusing on automatically or semi-automatically assessing people’s visual perceptions and preferences. Dubey et al. (2016) used Google Street View (GSV) data and an online interface to collect large, crowdsourced datasets (Place Pulse) through pairwise image comparisons. They also developed a neural network to predict human-labeled comparisons, a method later expanded in other studies. For instance, Zhang et al. (2018a) applied this approach to urban perception analysis in Beijing using Tencent Street Views. Oki and Kizawa (2022) introduced 22 dimensions to describe urban perceptions, using GSV-based surveys to map public impressions. Similarly, Ogawa et al. (2024) assessed urban perceptions in Tokyo using ZENRIN street views, while Larkin et al. (2022), Huang et al. (2024), and Nagata et al. (2020) quantified walking preferences using crowdsourcing and image-based DCNN models.
Although combining crowdsourced public attitudes with deep learning models facilitates large-scale prediction of environmental visual perceptions, it remains challenging to reshape environmental scenes based on perceived attitudes.
Generative artificial intelligence in urban design and analysis
The emergence of GANs in 2014 revolutionized image generation research. Previous studies have indicated that supervised GAN algorithms such as DC-GAN, pix2pixGAN, Urban-GAN, CycleGAN, and StyleGAN excel at acquiring knowledge regarding urban morphological layouts (Fedorova, 2021; Huang et al., 2022; Quan, 2022) and authentic micro-scale environmental characteristics (Ito et al., 2024; Joglekar et al., 2020; Noyman and Larson, 2020; Wijnands et al., 2019; Yamanaka and Oki, 2022). Notably, Joglekar et al. (2020) as well as Yamanaka and Oki (2022) investigated the utilization of perception scores to filter image data, training GAN models to generate environmental scenes that reflect diverse perceptual preferences. However, limited controllability over generation outputs and low fidelity in reproducing real-world details remain challenges for applying GAN-based methods effectively (Joglekar et al., 2020; Yamanaka and Oki, 2022).
In recent years, the development of Stable Diffusion models has been a key advancement in fields like art, physics, mathematics, and spatial design. Based on Latent Diffusion Models (Rombach et al., 2022), Stable Diffusion generates better image outcomes than GAN models. These models have become powerful tools, offering insights across various fields and supporting decision-making. While their use in urban design and planning is still limited, examples include Mishra et al. (2023), who proposed a method for improving road design to reduce accident risks, and Ma and Zheng (2024), who used Stable Diffusion to generate building façades. Kapsalis (2024) explored the application of Stable Diffusion in urban design and the potential of plugins like inpainting.
Generative AI, particularly the Stable Diffusion model, has emerged as a promising tool for urban design. However, its application in street design remains relatively limited, and few studies have investigated its use based on perceptions or preferences.
Methodology
Research framework
This study developed a workflow to automatically generate photorealistic and controllable street scenes based on people’s walking preferences and to evaluate the quality of the generated outputs. The workflow began with the quantification of subjective walking preferences using crowdsourced data (Figure 1(a)), followed by the selection of highly-rated street view images as training data. These images were then used to train Low-Rank Adaptation (LoRA) models (Hu et al., 2021) (Figure 1(b)). Next, the trained LoRA models were employed to perform low-rank adaptation on the Stable Diffusion model’s weights, in combination with ControlNet (Zhang et al., 2023) and 3D models to generate improved street scenes (Figures 1(c) and 1(d)). Finally, a series of evaluations were conducted to assess the quality, controllability, and preference improvement of the generated results (Figure 1(e)). (a) Quantify the public preference; (b) screen images and train LoRA model; (c) generation and control; (d) generate improved scene; (e) generation evaluation.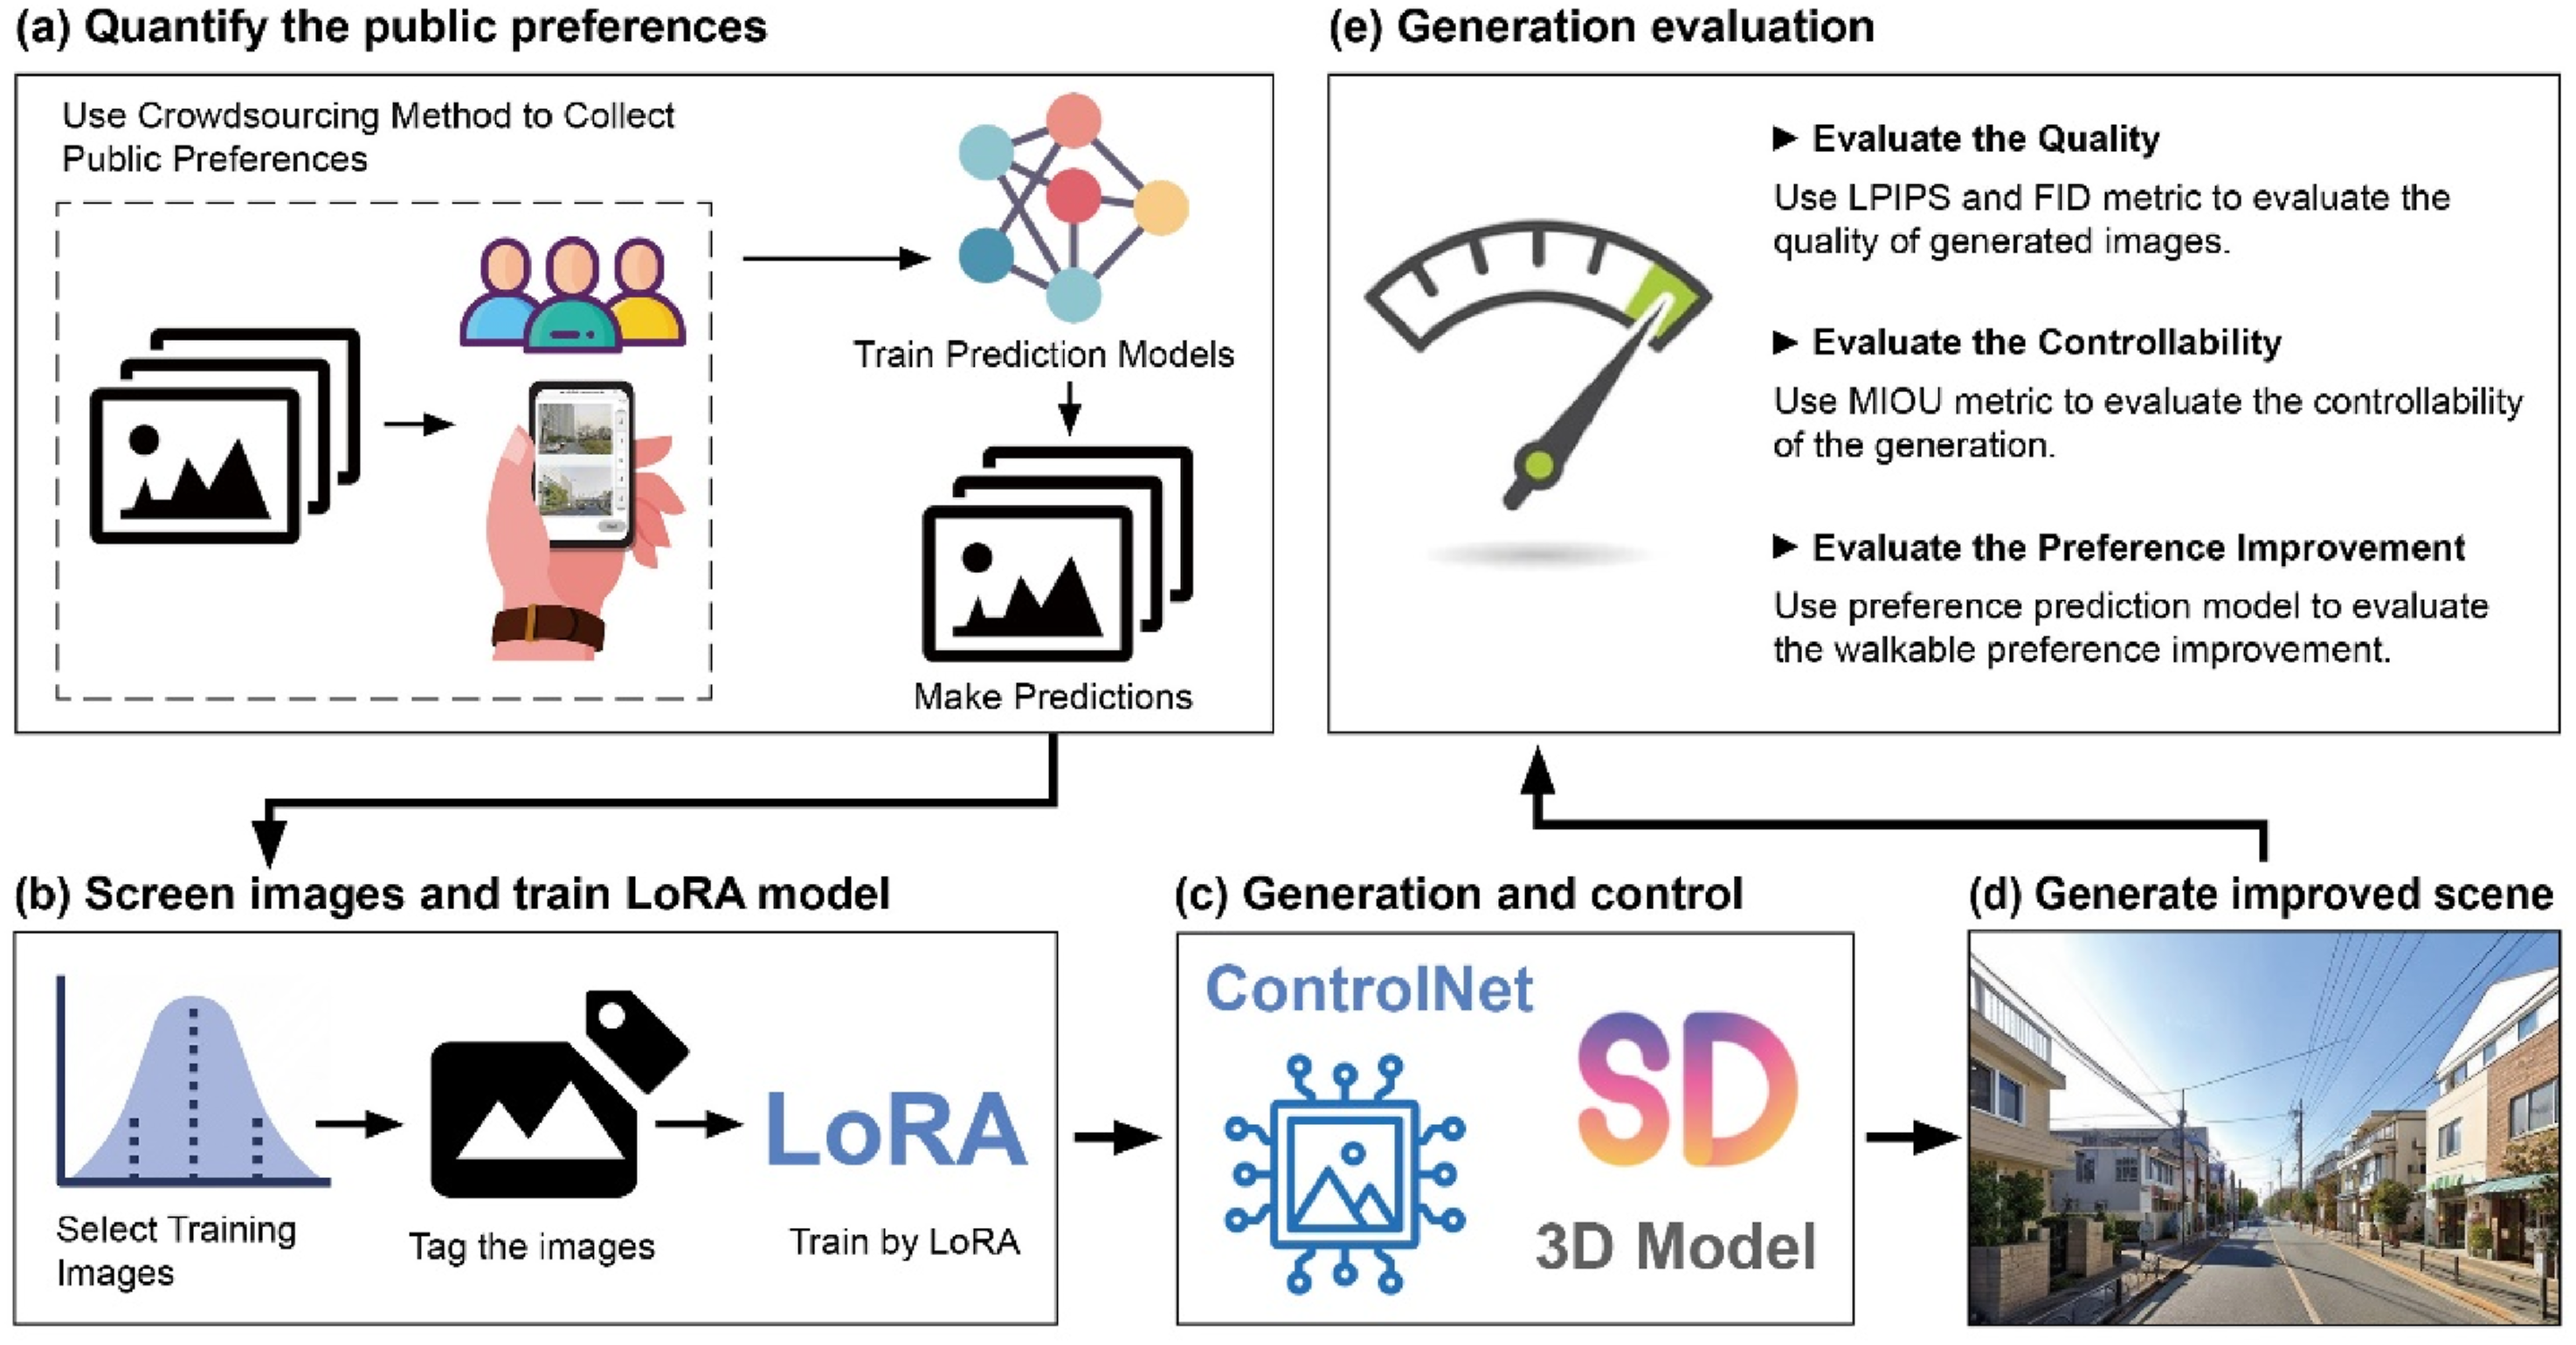
Case study area
The feasibility of the proposed workflow was demonstrated and evaluated using the Setagaya ward in Tokyo as a case study. Setagaya ward is one of Tokyo’s 23 special wards in the southwestern part of the city, bordering the Shibuya, Meguro, Ota, and Suginami wards (Figure S1). It is one of Tokyo’s largest and most populous wards known for its residential neighborhoods, offering a blend of urban convenience and suburban tranquility. It is also home to many parks, temples, and cultural sites, making it a popular area for families and those seeking a quiet environment close to the heart of Tokyo (Setagaya Ward, 2023).
Street view data
This study leveraged GSV images as the data source for quantifying walking preferences and testing generated output. We utilized the road network from the Digital Road Map (DRM) (Sumitomo Electric System Solutions Co., Ltd, 2020) to collect the GSV images and established a 30-m interval for image collection. This approach enabled us to acquire images at designated GSV points and convert them into approximately 110,000 perspective images with foreground and background views.
Key dimensions of preferences for walking
Perceptual and behavioral preferences are two critical aspects of perceived walkability that reflect pedestrians’ experience and their willingness to interact with their environment (Jun and Hur, 2015). In this study, we referred to Alfonzo’s hierarchy of walking needs model to determine the evaluation dimensions of perceptual preferences (Alfonzo, 2005). Alfonzo (2005) hierarchically organized the five levels of perceptual needs, presenting them as antecedents of the walking decision-making process. These hierarchical levels include feasibility, perceived accessibility, safety, comfort, and interest in pleasurability (Alfonzo, 2005). Safety, comfort, and interest directly relate to street-level walking behavior and the environment (Adkins et al., 2012; Alfonzo, 2005). Therefore, we focused on these three dimensions to represent the public perceptions of street-level built environments.
We examined behavioral preferences through the lens of street functionality and their capacity to evoke public preferences in two types of visually assessed walking behaviors: walking preference and lingering preference. The concept of “walkability” refers to the extent to which streets are optimized for pedestrian traffic and entice people to choose them as pathways. An ideal streetscape should accommodate walking and serve as a hub for communal activities, fostering a sense of place and encouraging social interactions (Jones and Boujenko, 2009). This principle, referred to by contemporary urban planners as “sticky streets,” delineates spaces where pedestrians are naturally inclined to linger and immerse themselves in a vibrant public life (Zapata and Honey-Rosés, 2022). Therefore, this study focused on two dimensions—walking preference and lingering preference—to represent the public’s behavioral preferences regarding walking environments.
People’s perceptual and behavioral preferences for walking
To assess individual attitudes toward perceptual and behavioral preferences, we employed a deep learning technique that integrated crowdsourced datasets with deep convolutional neural networks (DCNN) to predict preference scores from a visual perspective. Our methodology is based upon prior studies (Huang et al., 2024; Ogawa et al., 2024) and consists of two main phases: (1) obtaining data on visual preferences through a crowdsourced survey and (2) training the inference model.
People’s perceptual and behavioral preferences for walking
We used two crowdsourced survey datasets based on pairwise image comparisons to gather people’s perceptual and behavioral preferences for walking. Both datasets followed the same structure and were collected via a mobile-based crowdsourcing platform. They used street view images from Setagaya ward, collected by a professional Japanese survey company, targeting residents in Japan. The respondent pool had an approximately equal gender ratio and a diverse age distribution.
The first survey dataset included 1000 street view images, each randomly paired with 10 others to create 10,000 image pairs, assessed by 40 different respondents. The survey covered 22 environmental perception dimensions (Ogawa et al., 2024). Respondents compared image pairs and answered questions, such as “Which street looks safer?” using a five-point scale (Figure 2(a)). Conducted in December 2022, the survey involved 38,525 respondents and generated 400,000 responses, with each respondent providing an average of 10.4 answers (Ogawa et al., 2024). For this study, we focused on the dimensions of safety, comfort, and interest, as these are considered most relevant to the walking experience (Adkins et al., 2012; Alfonzo, 2005). (a) Image comparison survey interface (original translated from Japanese to English); (b) a network to infer perceptual and behavioral preferences for walking; (c) training accuracy.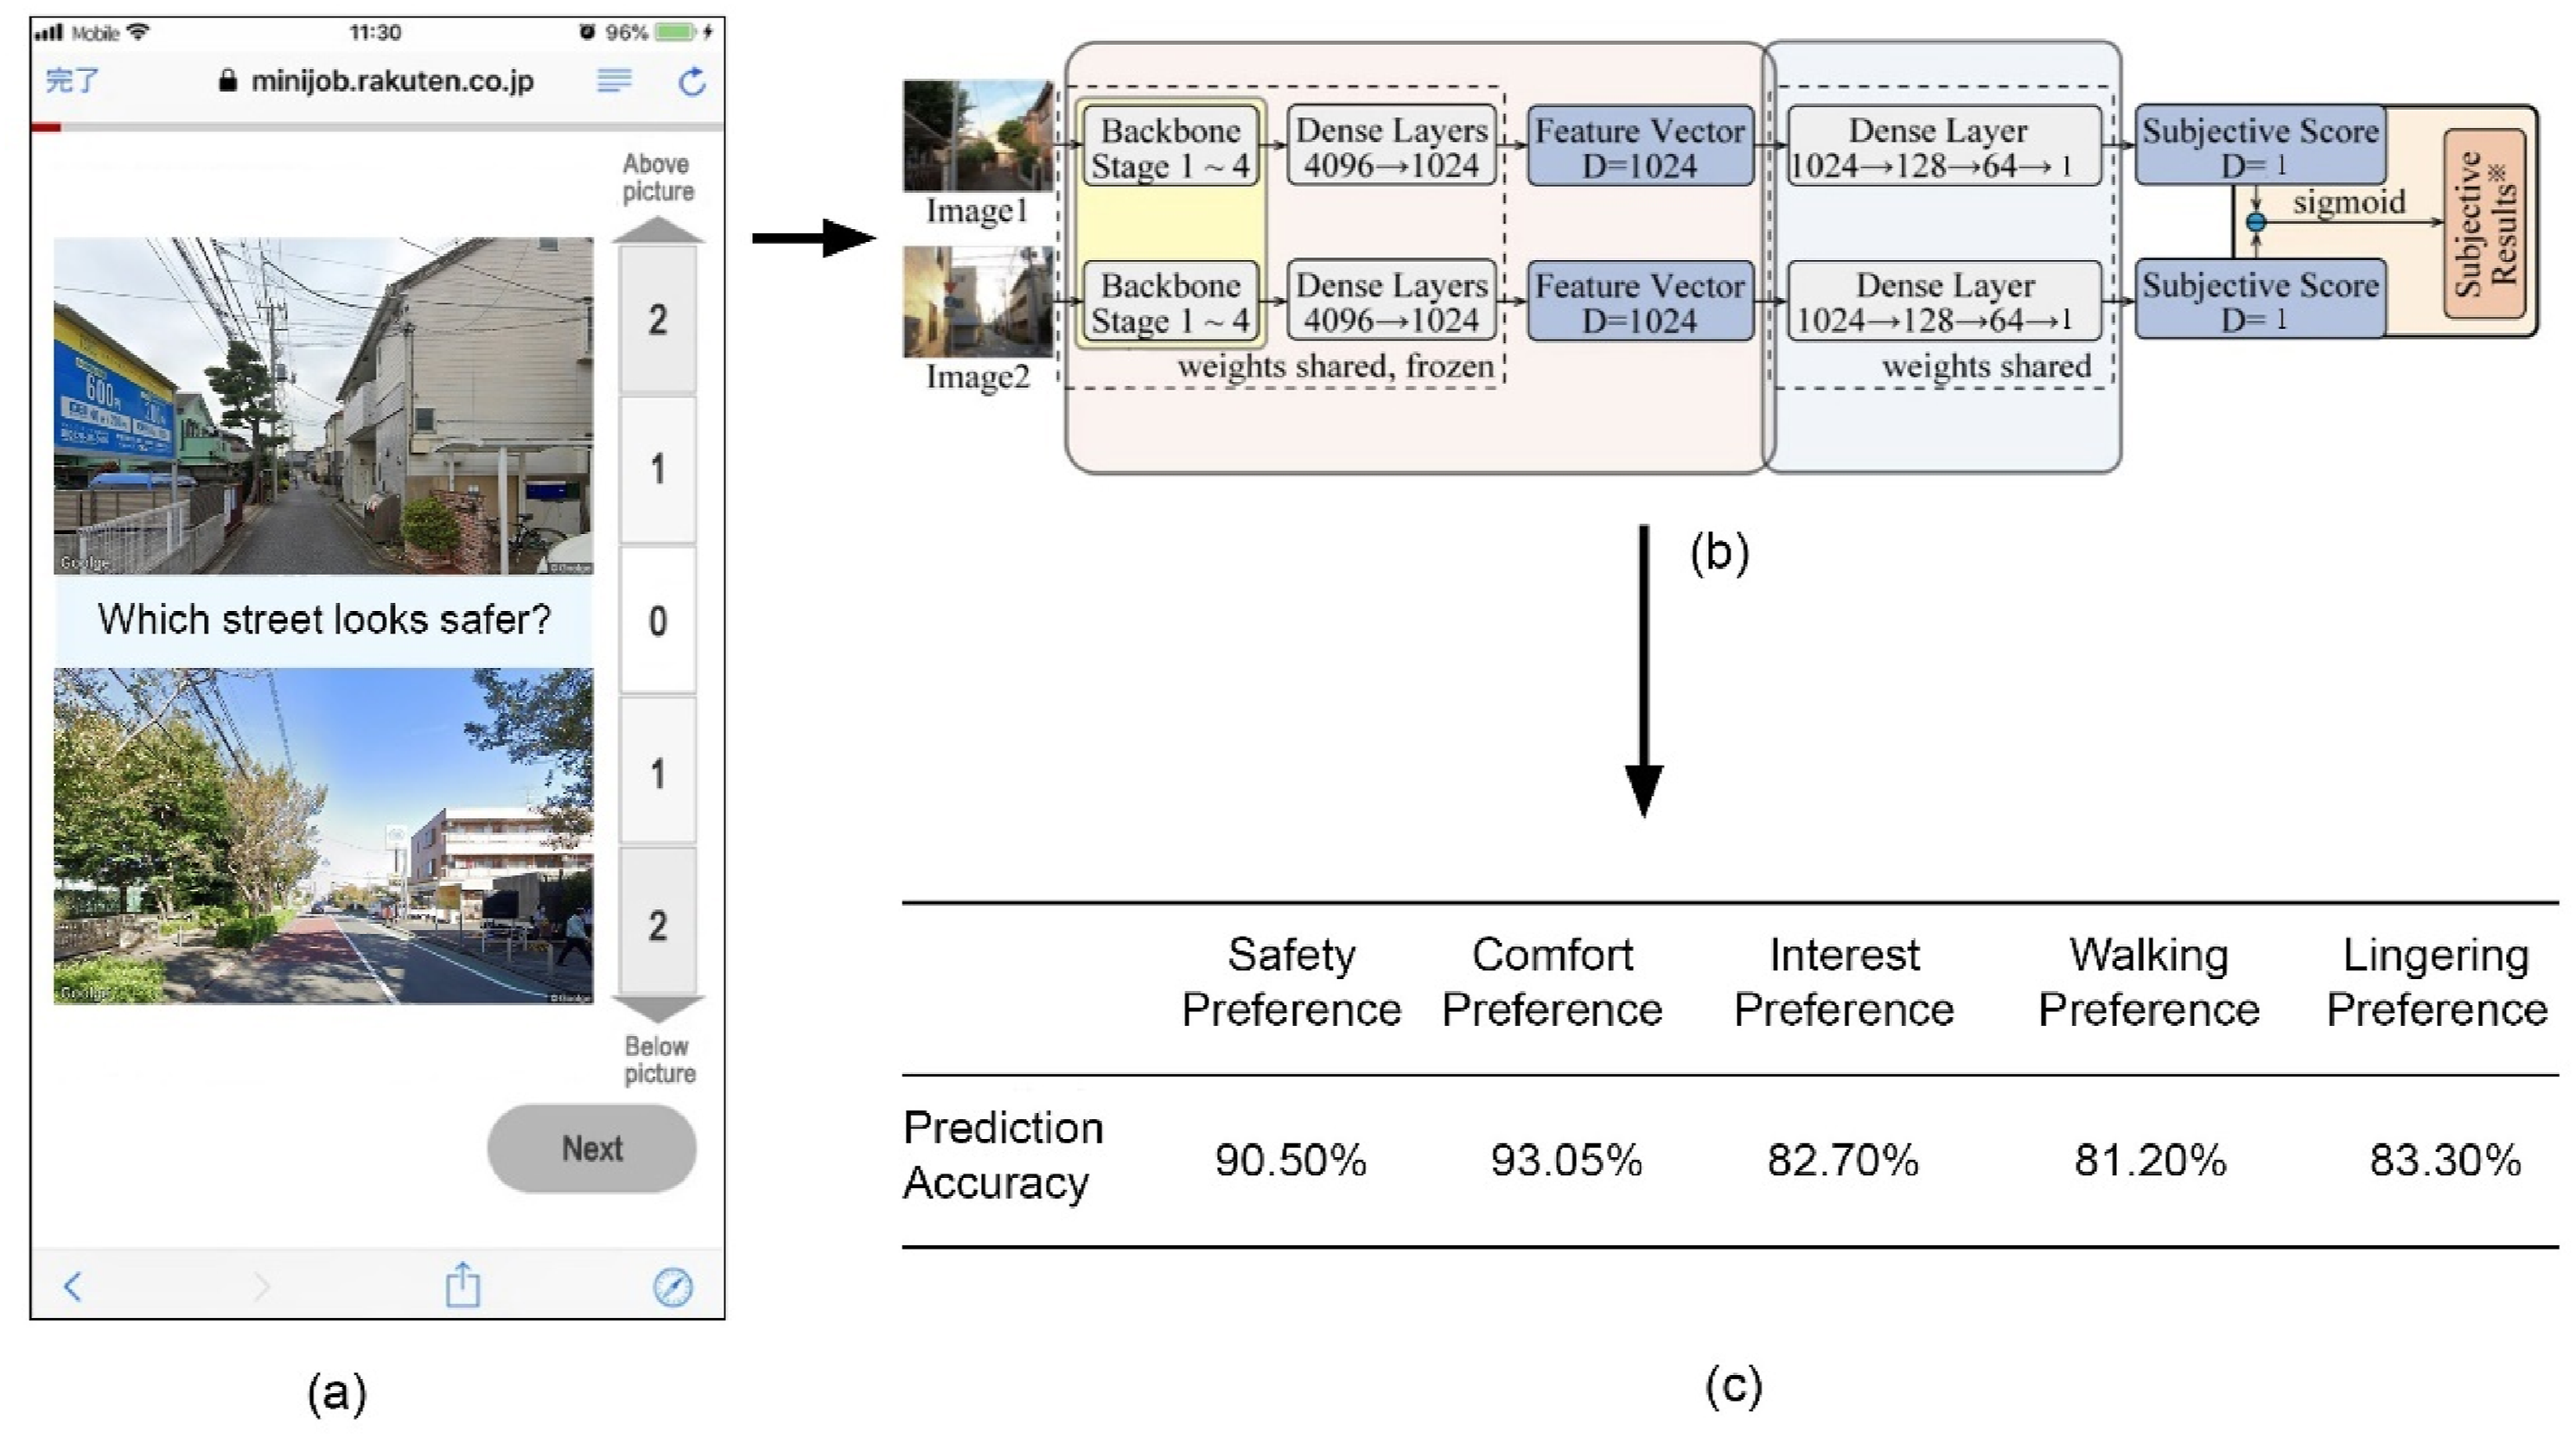
The second survey focused on behavioral preferences, specifically walking and lingering preferences. It involved 1200 images, resulting in 12,000 image pairs, each evaluated by 10 respondents. Respondents answered questions, such as “Which street is preferable for walking?” Conducted in February 2023, the survey engaged 18,333 respondents and collected 120,000 responses, with each respondent providing an average of 6.5 answers (Huang et al., 2024).
Training perceptual and behavioral preference prediction models
To train the perceptual and behavioral preference prediction models, we initially preprocessed and converted the survey responses related to image comparisons into binary classification labels (Figure 2(b)). Subsequently, we utilized a ConvNeXt V2 network (Woo et al., 2023) to extract the image features. The extracted features were then fed into a Neural Network to generate two predicted scores. The score differences were used for binary classification, with a sigmoid function mapping the differences to a 0–1 range for loss minimization.
Accuracy was used as the evaluation metric for the three perceptual and two behavioral preference prediction models, reflecting their reliability in classifying validation results (Figure 2(c)).
Prediction model application
We utilized trained perceptual and behavioral preference prediction models to predict the GSV scores across all street scenes in the Setagaya ward. These scores were subsequently normalized to their respective categories using the min-max normalization method. Figure 3 showcases examples of the predicted high and low-ranking perceptual (Figure 3(a)) and behavioral preferences (Figure 3(b)). These normalized scores were then used to prepare datasets for LoRA training. (a) Example results of predicted perceptual preferences and (b) predicted behavioral preferences.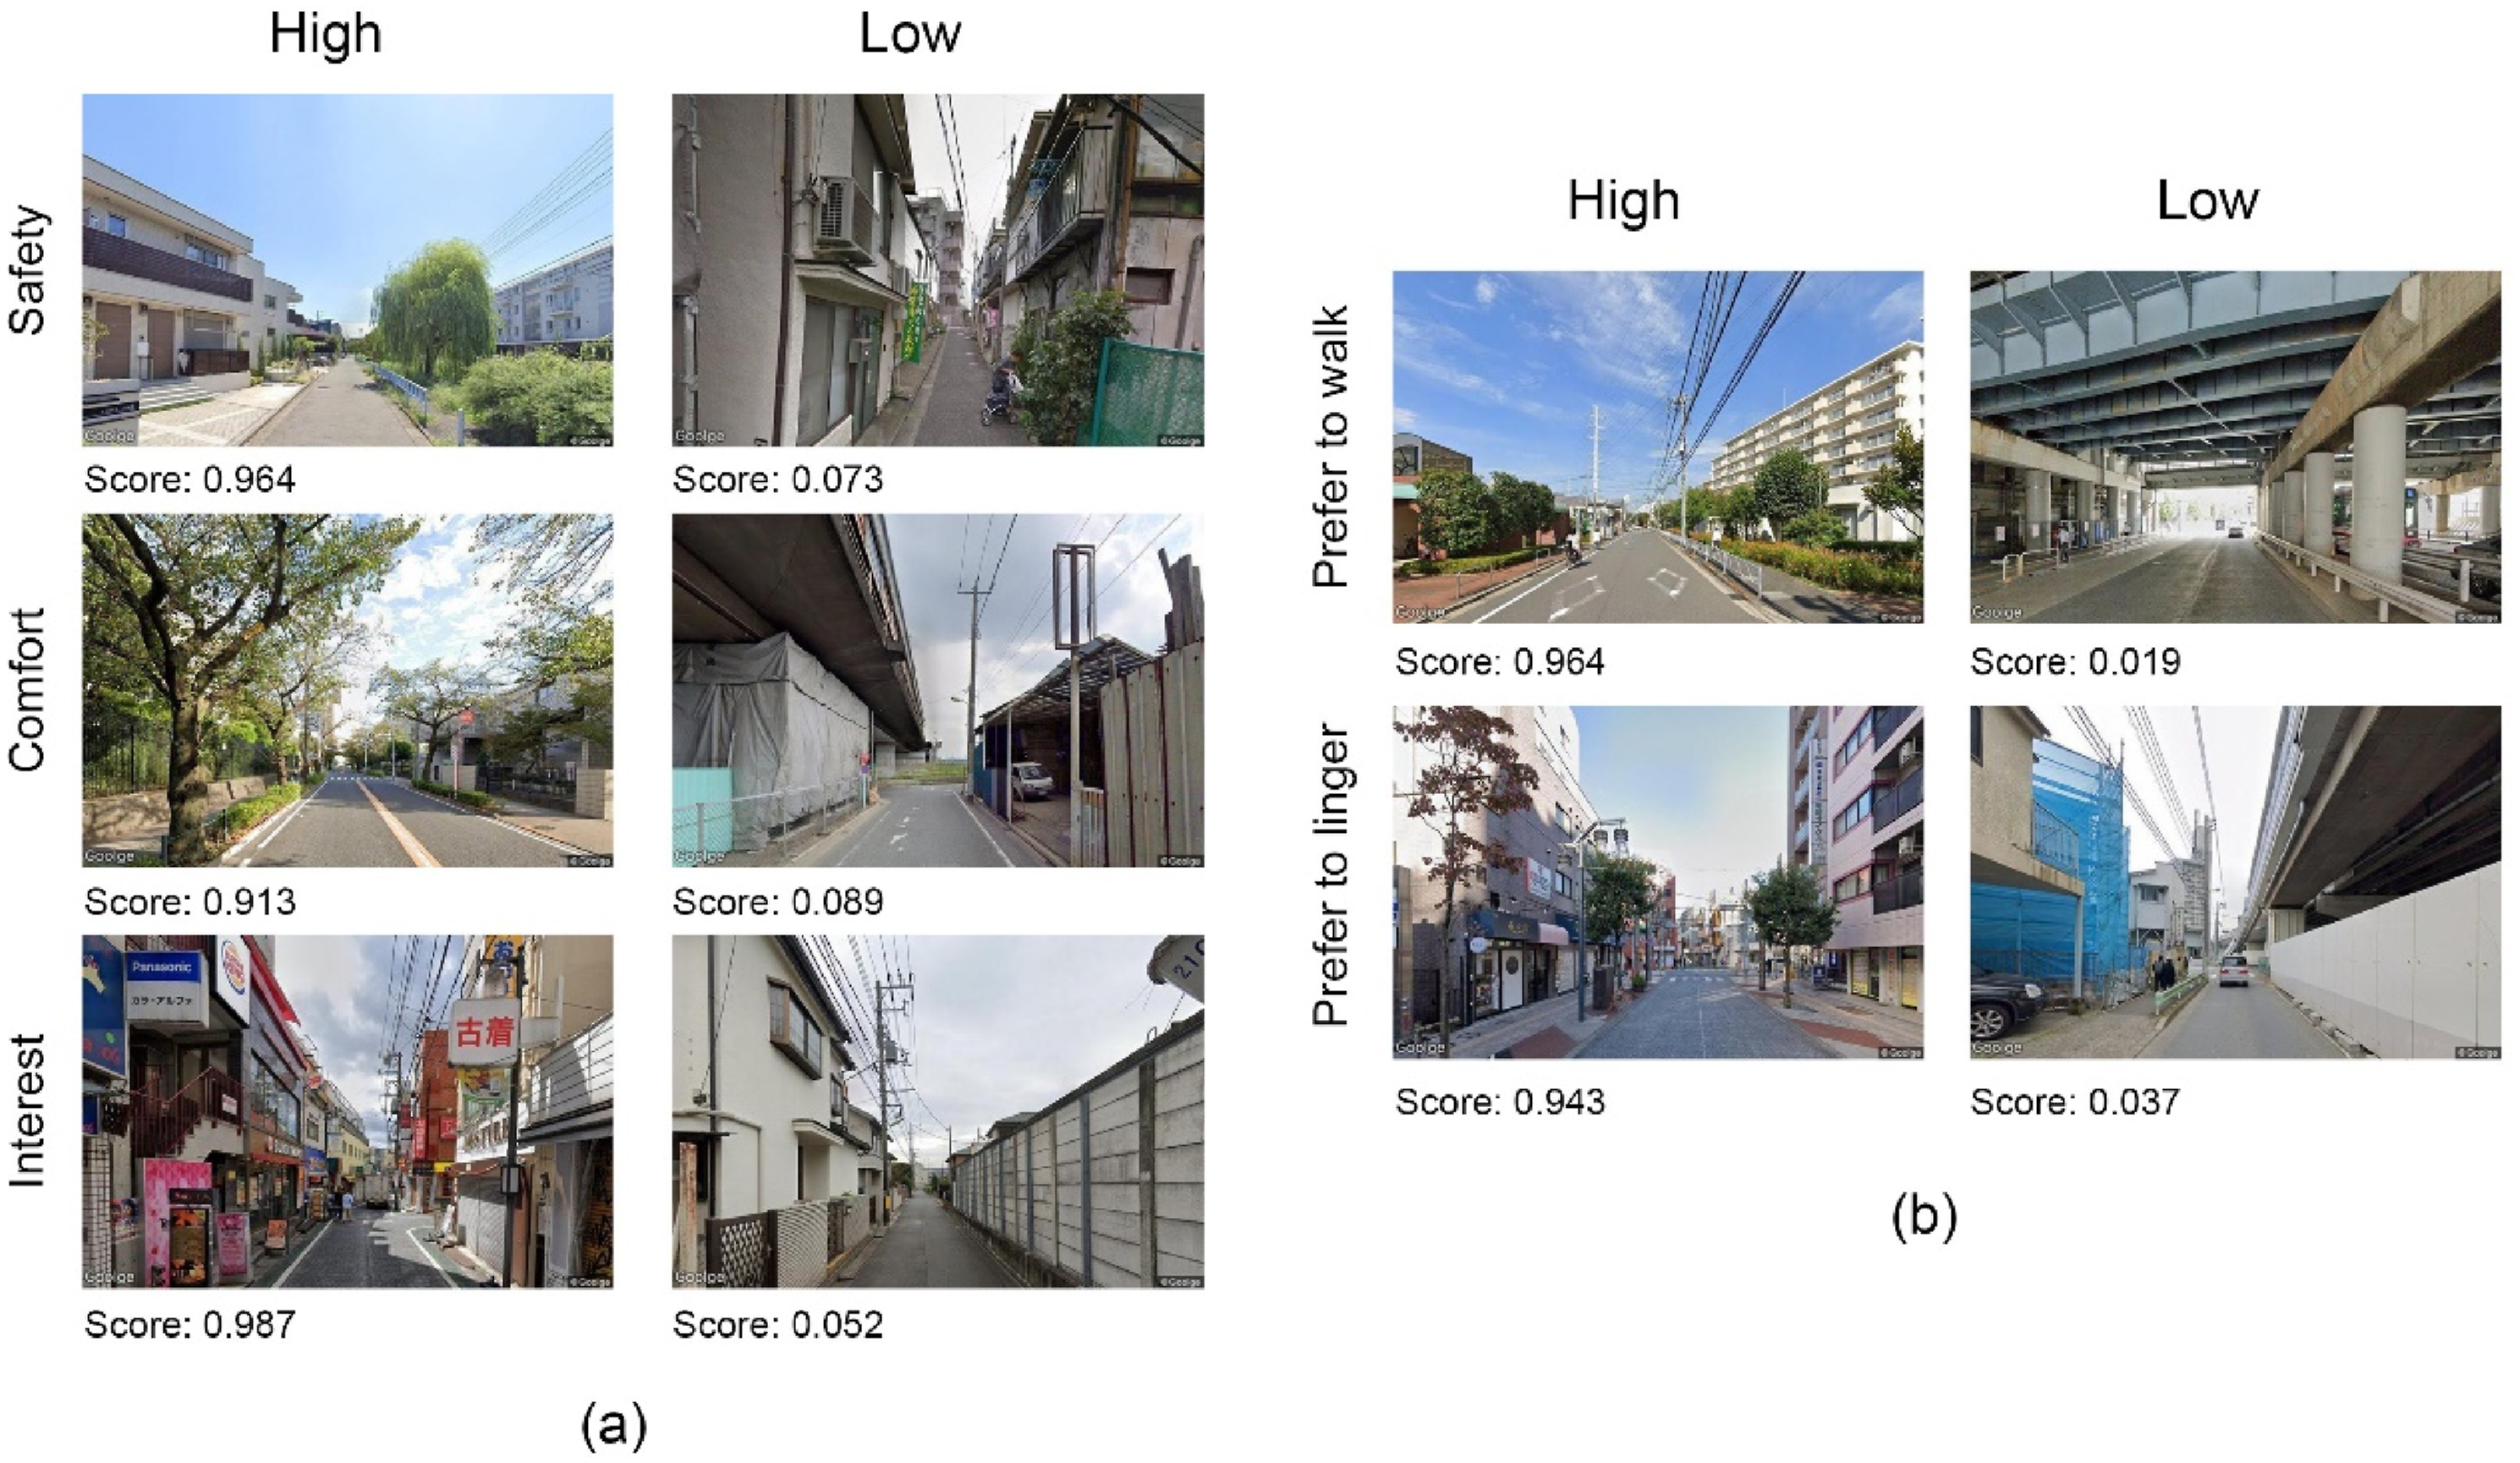
Walkable street scene generation and evaluation
Stable diffusion image-to-image model
Stable Diffusion can handle various image generation tasks, including text-to-image, image-to-image, image editing, and image inpainting. This study focused on image-to-image tasks, where an initial image is used alongside a prompt to generate a new image through a diffusion-denoising process.
The image-to-image model consists of four main components: Text-Encoder, VAE-Encoder, U-Net, and VAE-Decoder (Figure S2). First, the prompt text and the original image are encoded to create Latent Features using the VAE-Encoder. These features are then processed by the U-Net-based image optimization module in Stable Diffusion. Finally, the optimized Latent Features undergo iterative refinement and are passed through the VAE-Decoder to reconstruct the final pixel-level image (Rombach et al., 2022).
Low-rank adaptation
Fine-tuning the model is crucial to ensure Stable Diffusion generates content that aligns with our goal of enhancing people’s walking preferences. However, due to Stable Diffusion’s large parameter count, directly training or fine-tuning it can be time-consuming and resource-intensive.
To address this issue, we used LoRA, a highly efficient technique for fine-tuning large models. LoRA enables smaller models to achieve fine-tuning results similar to full models, even with smaller datasets, significantly improving efficiency (Hu et al., 2021). This approach allowed us to align Stable Diffusion’s output with walking perceptions and behavioral preferences while optimizing computational resources.
Dataset for LoRA training
Two LoRA training datasets were created based on walking preferences, consisting of four steps. First, we filtered street view images from Setagaya ward using perceptual and behavioral preference scores. We selected images with high scores in safety, comfort, and interest, summing these scores to create a total score for each image. From this, we chose 200 images above the 99th percentile, based on prior research indicating that this number is sufficient for LoRA training (Ma and Zheng, 2024). Similarly, we selected another 200 images based on high scores for “prefer to walk” and “prefer to linger” (Table S1). Second, the selected images were resized to a consistent resolution of 768 × 512 pixels, with the Stable Diffusion Upscaler tool used to enhance their resolution. Third, the images were tagged using the WD14 tagger to extract key features such as “building,” “road,” “sky,” and “sidewalk,” while excluding less relevant tags like “bench” or “shop.” Training dataset 1 was tagged with the trigger word “perceptualpreference” and dataset 2 with “behavioralpreference” (Table S1). Finally, we classified streets by their category (arterial, collector, or local) using the DRM’s street width classification system. Images were assigned trigger words based on their street category, improving the precision of LoRA’s learning (Table S1).
Generation via ControlNet models
Using the Stable Diffusion model alone for image-to-image generation can be unpredictable, as it may deviate from the spatial logic of reference images without proper control, resulting in outputs that significantly differ from the original scene or even defy logical coherence. To address this, we incorporated ControlNet (Zhang et al., 2023) (Figure S3). It is an extension model designed to guide the generation process through external control inputs. It combines the traditional Stable Diffusion model with additional conditioning information, allowing generated images to better follow specific user-defined constraints. ControlNet introduces extra control layers that enable image generation to be adjusted for details like layouts, structures, styles, or other features. This method enhances the accuracy of generated images, especially in tasks that require specific styles or structures. The advantage of ControlNet lies in its flexibility, allowing users to fine-tune the generated content through explicit instructions.
ControlNet offers various models tailored for different tasks. In this study, we tested five common models for scene control tests: Canny, which detects short edges to help control for boundaries; MLSD, which extracts multi-level lines through edge segmentation to capture intricate structural details; Lineart, which focuses on simple artistic lines to guide the generation process; Depth, which provides depth information to control the spatial feeling of the scene; and Segmentation, which classifies image regions based on semantic meaning to control object boundaries (Figure S3).
Generation via the 3D model and ControlNet mask image
Incorporating 3D street models to generate ControlNet mask images enables precise control over the spatial dimensions of street elements, such as the width of sidewalks and roadways. In the early stages of Tokyo’s urban development, streets were often quite narrow. However, as urbanization progressed, road widening has become necessary in street renewal projects to accommodate emergency vehicles and provide evacuation space, given the country’s susceptibility to natural disasters (Tokyo Metropolitan Government, 2017). At the same time, pedestrian-oriented goals require the expansion of sidewalks for improved accessibility. However, relying solely on ControlNet’s pre-configured features in Stable Diffusion often falls short in providing the level of accuracy needed to control these spatial dimensions effectively.
To tackle this challenge, we integrated a 3D street model with ControlNet to achieve finer control over spatial dimensions. The process began by constructing a 3D model of the street that accurately aligned with the perspective of street view images. Based on the project’s design specifications, we then adjusted the 3D model to meet the spatial dimensional requirements. Next, we transformed the updated 3D model into a mask image, suitable for use with Segmentation ControlNet as a control guide for image generation. The decision to use Segmentation ControlNet was driven by its ability to provide enhanced spatial precision through structured image segmentation, such as differentiating between foreground and background or isolating specific objects. This capability directly impacts the positioning and relationships of elements within the image (Zhang et al., 2023), making it particularly effective for our objectives.
Evaluation of generation quality and controllability
To evaluate the quality and controllability of image generation, as well as their relationship with parameter settings, we used two common metrics: Learned Perceptual Image Patch Similarity (LPIPS) (Zhang et al., 2018b) and Fréchet Inception Distance (FID) (Heusel et al., 2018).
LPIPS measures local feature similarity between images, simulating human perception of image quality (Zhang et al., 2018b). To compute LPIPS, a reference dataset of real images is needed for comparison with the generated images. In our study, we used the street view dataset from LoRA training as the reference. We extracted features from both the generated and reference images using a pre-trained VGG-16 network, and then calculated the feature distance. Lower LPIPS scores indicate that the generated images are more similar to the reference, reflecting better generation quality.
For controllability, we assessed how different ControlNet models and control weight settings impacted the generated images. To do this, we used the FID metric, which measures global differences between the generated images and reference images, considering structure, style, and color (Heusel et al., 2018). Unlike LPIPS, which focuses on local features, FID evaluates overall characters. We computed the FID score by extracting features using a pre-trained InceptionV3 model and then calculating the distance between the feature distributions. Lower FID scores indicate better alignment with the reference’s global feature distribution, reflecting higher generation quality.
Finally, to evaluate the accuracy of incorporating the 3D model in controlling spatial dimensions of design elements within street scene generation, we used the Mean Intersection over Union (mIoU) metric to compare the overlap between the sidewalk and roadway areas in the generated images and the ground truth control mask.
Evaluation of preference enhancement
To evaluate whether the proposed workflow improves walking preferences, we used the preference prediction models. First, we calculated scores for images both before and after generation across multiple dimensions, and then computed the differences between these scores.
Generation and evaluation
LoRA model training
We trained two LoRA models using the prepared LoRA training datasets and the SD-Trainer LoRA script. LoRA Model 1 focused on improving street walkability from a perceptual preference perspective, while LoRA Model 2 aimed to enhance street scenes based on behavioral preferences. The base model for fine-tuning was the v1.5 Stable Diffusion model, chosen for its well-established ecosystem, which offers a wide range of available models and plugins, as well as its relatively low hardware requirements. Training was conducted on an NVIDIA GeForce RTX 3090 with 32 GB of memory. Key training parameters are listed in Table S2, and Figure S4 shows the decreasing loss values during the training process of both models.
Evaluation of generation quality
We began by evaluating the image generation quality of two trained LoRA models across different street types (arterial, collector, and local streets). We tested the generation at LoRA weights of 0 (no LoRA), 0.4, 0.8, and 1, generating 100 images for each weight setting. The image generation was performed using the DPM++ SDE Karras sampler with 30 sampling steps, a CFG scale of 7, and a denoising strength of 0.6. The results are presented in Figure 4. Evaluation of generation results via different LoRAs and weights.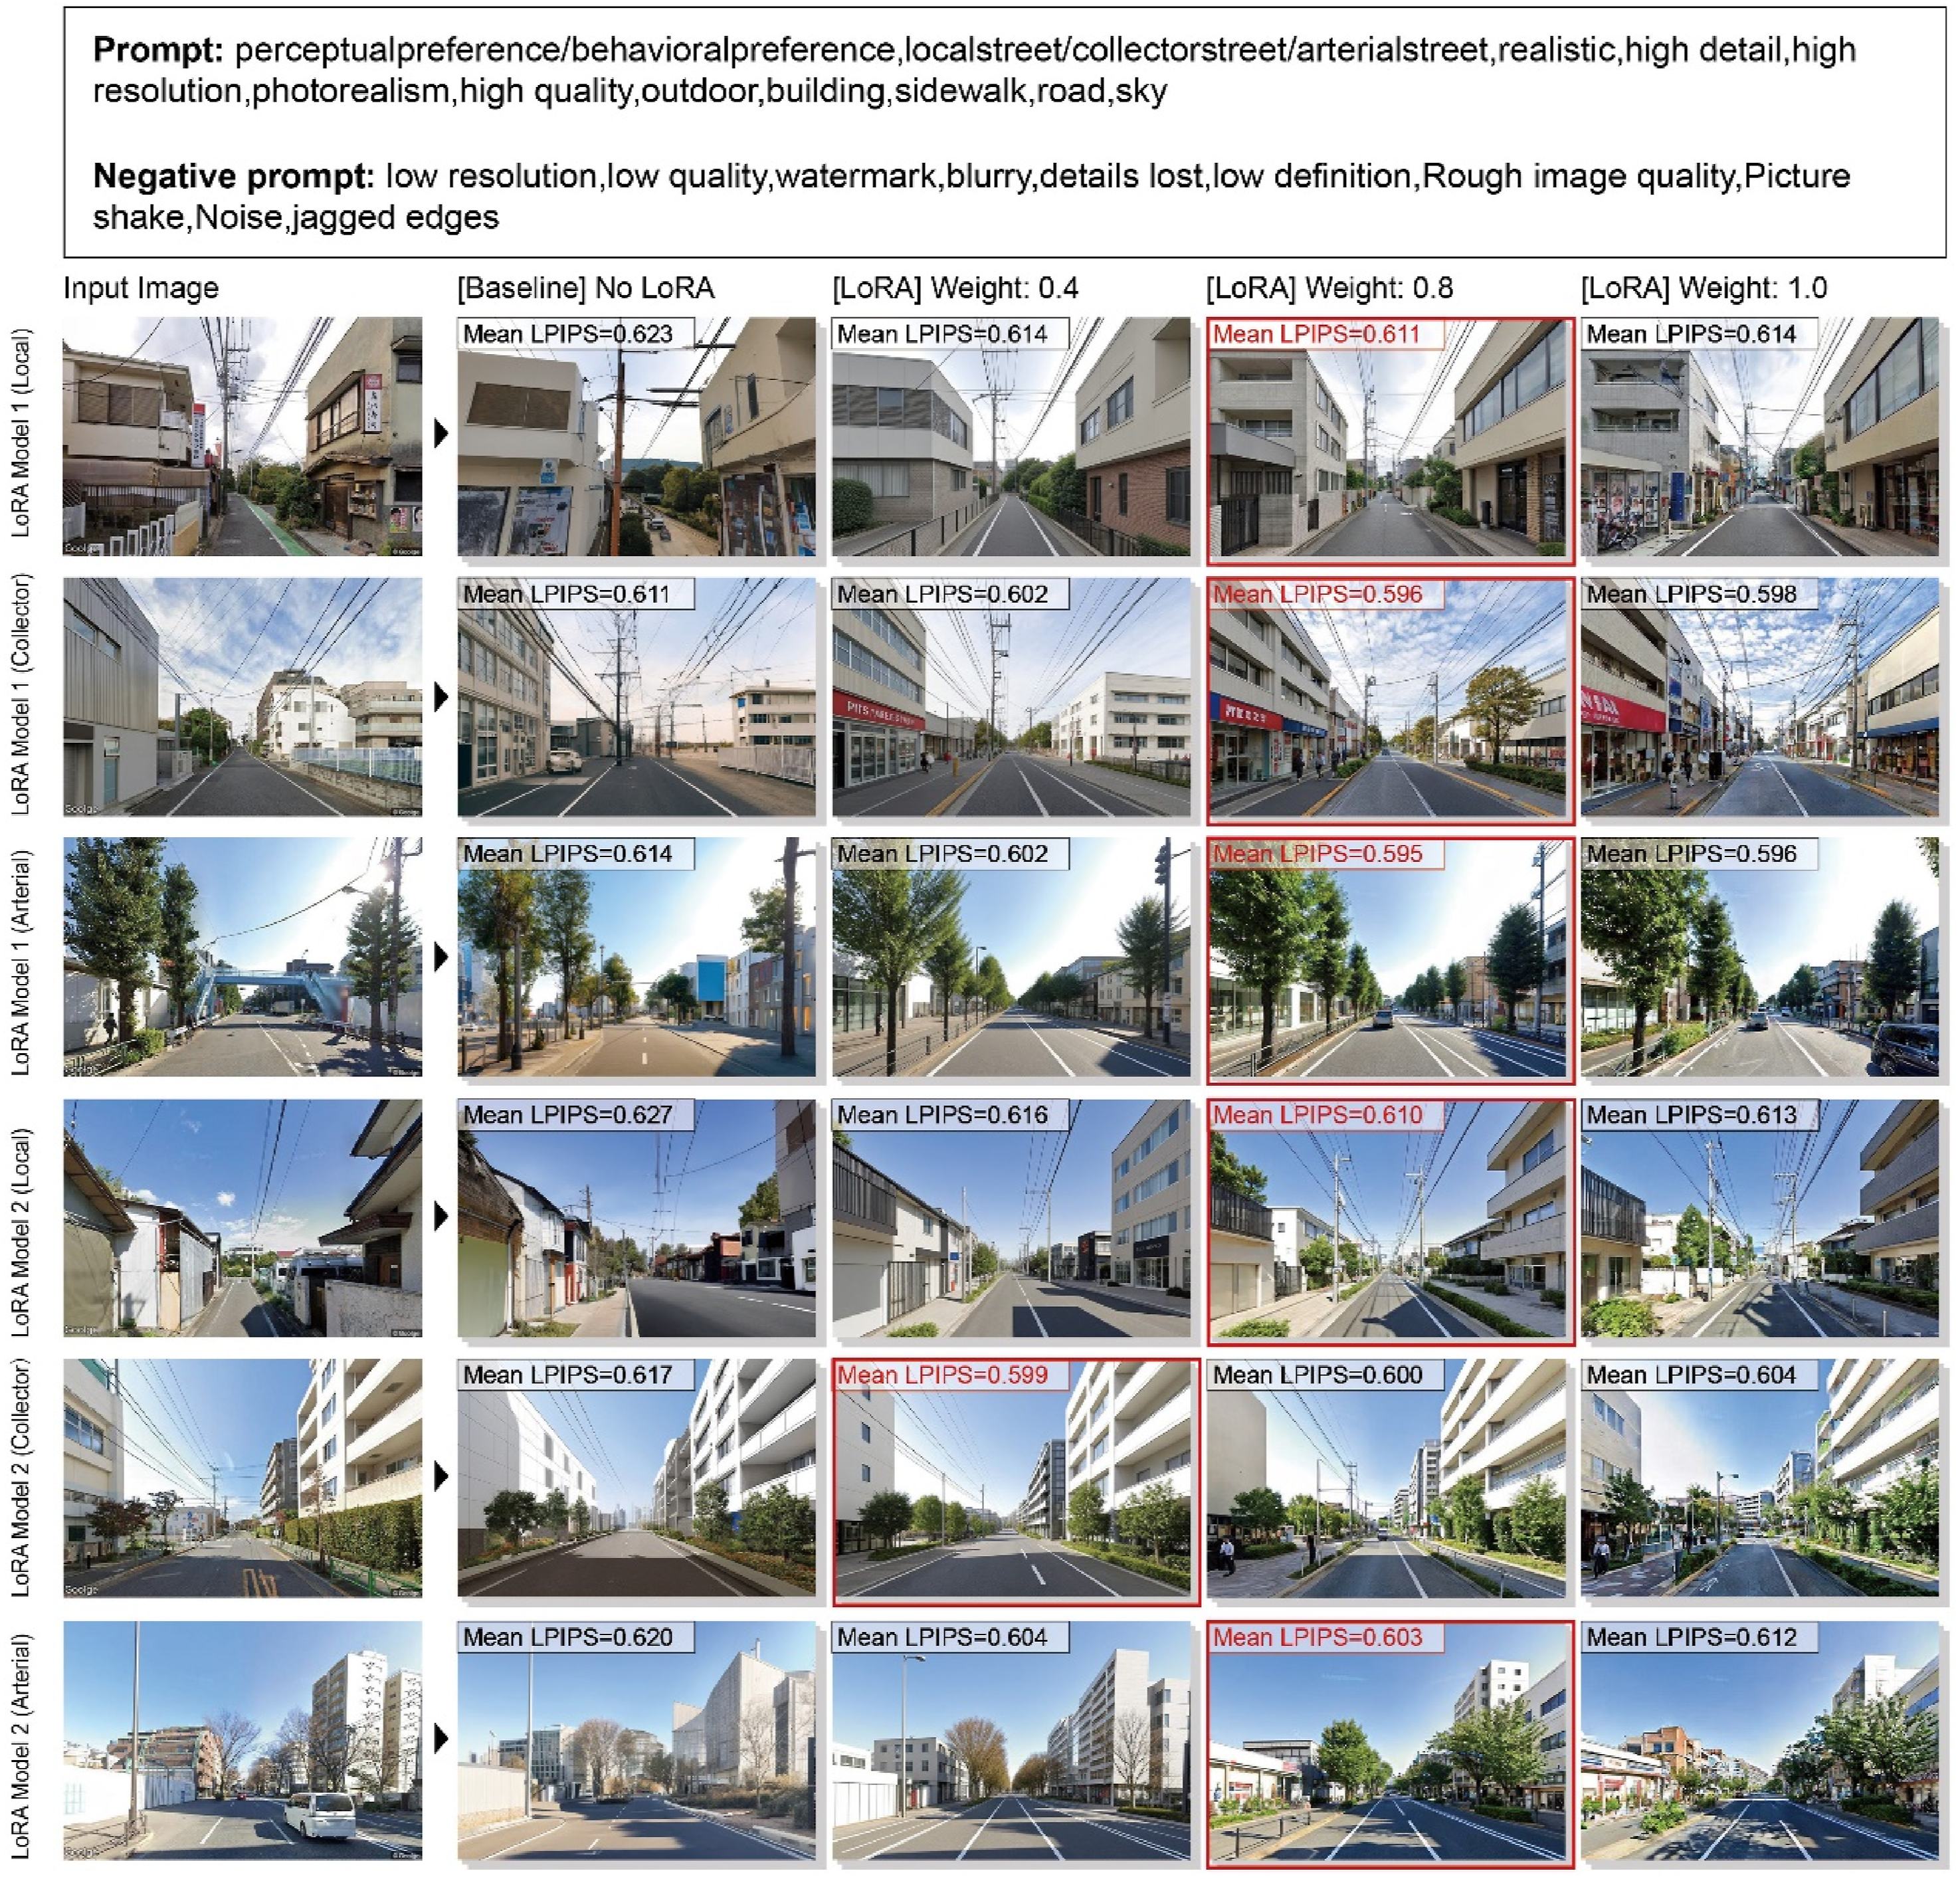
To evaluate the image quality, we applied the LPIPS metric and calculated the average LPIPS score for each set of generated images. The analysis revealed that, compared to the baseline (no LoRA), incorporating LoRA had a noticeable effect on the generated images. Specifically, at an LoRA weight of 0.8, both LoRA models produced images with lower LPIPS scores in most test cases, indicating the best performance in image quality at this weight setting.
Evaluation of controllability
Evaluation of controllability via different ControlNets
We evaluated the control capabilities of different ControlNet models—Canny, MLSD, Linear, Depth, and Segmentation—as well as the impact of varying control weights on global structural features during image generation. For this evaluation, we used LoRA Model 1 and a local street scene as a case study. For each ControlNet model, we applied control weights of 0.4, 0.6, 0.8, and 1.0, generating 100 images for each weight setting. We then computed the mean FID score for each set of generated images to assess their quality.
The results showed that the Depth model (Figure 5), with control weights between 0.6 and 0.8, achieved the lowest FID scores, indicating that they are most similar to the real scenes used as references in terms of global structural features. Evaluation of generation results via different ControlNet models and weights.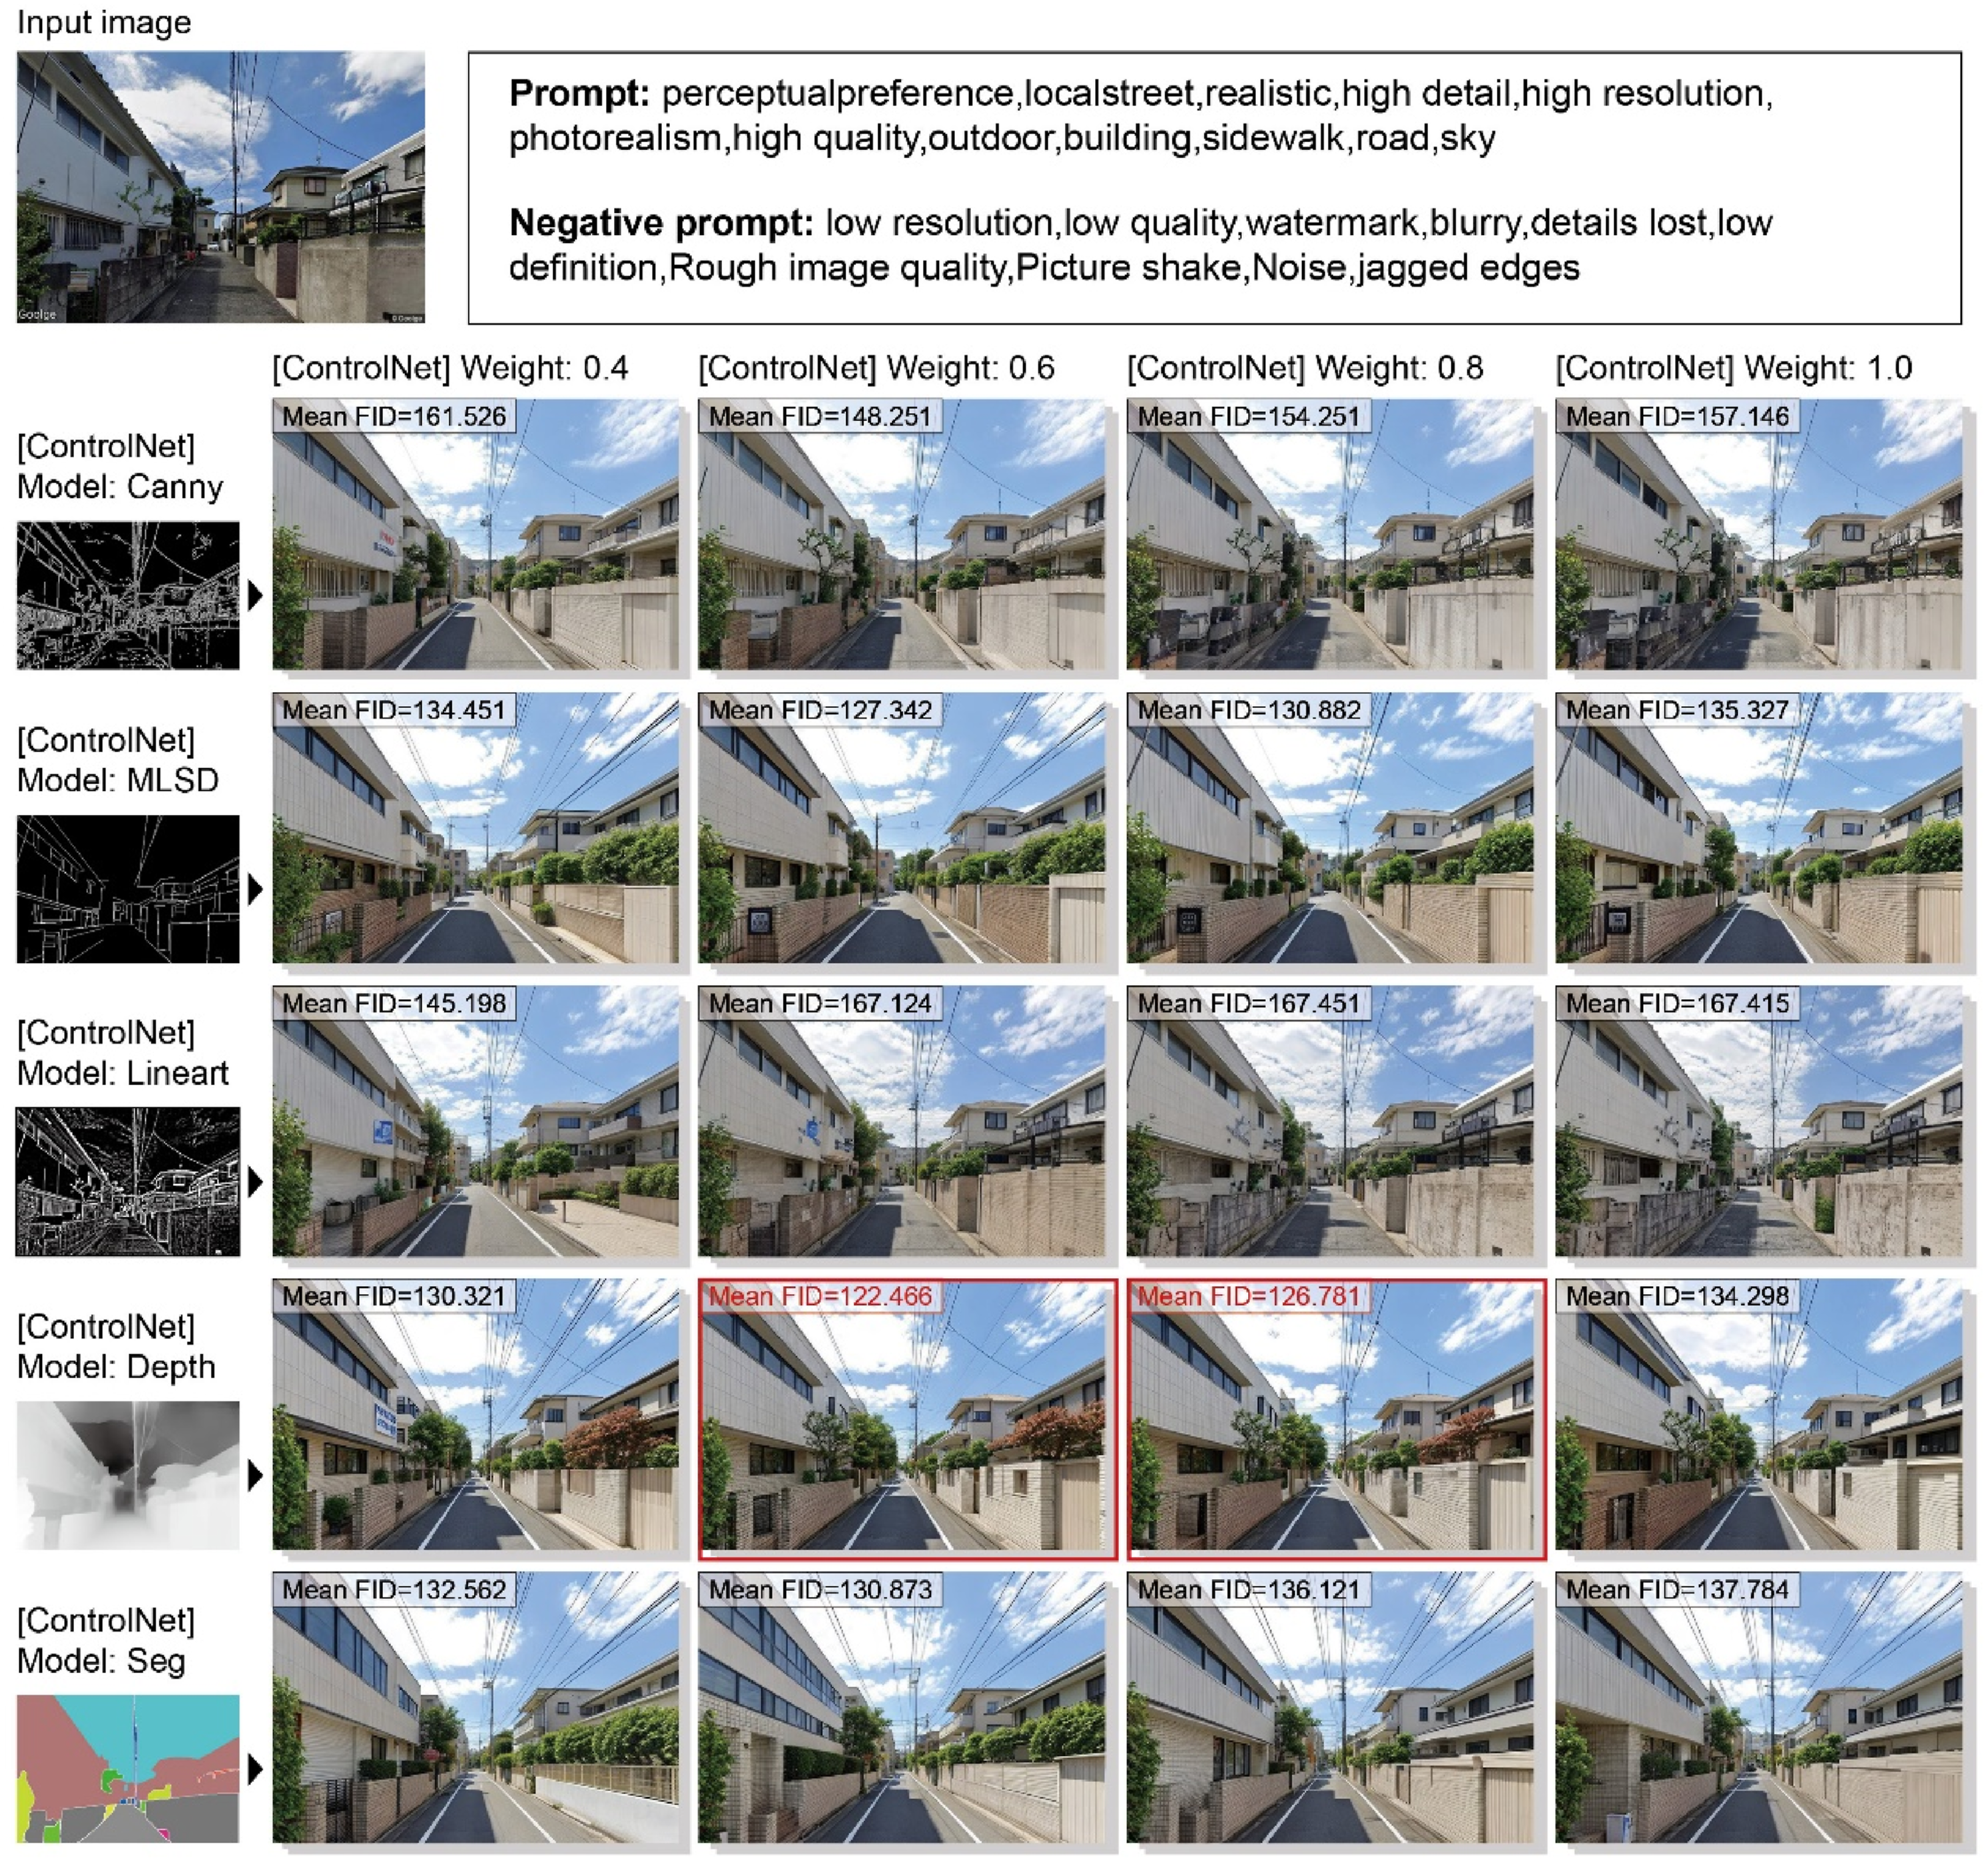
Evaluation of controllability via a 3D street model and ControlNets
We selected a planned road redevelopment project in Setagaya Ward, Tokyo, as a detailed case study to evaluate the effectiveness of our method in controlling specific design elements during the image generation process (Figure 6(a)). The project, located along Auxiliary Route No. 54 (Figure S5), spans from Kamisoshigaya 4-chome to Kamisoshigaya 5-chome. This stretch is a key segment prioritized for redevelopment under Tokyo’s Fourth Road Improvement Plan (Tokyo Metropolitan Government, 2017). Scheduled for completion between 2023 and 2032, the project involves widening the road from 9 m to 15 m, adding an additional driving lane, and incorporating 3-m-wide sidewalks on both sides (Tokyo Metropolitan Government, 2024). (a) Select the case study scene; (b) build a 3D model of the original street scene; (c) incorporate the planned expansions of the sidewalk and roadways in a new 3D model; (d) generate a mask image; (e) generate images based on the mask image; (f) segment the images; (g) calculate the mIoU.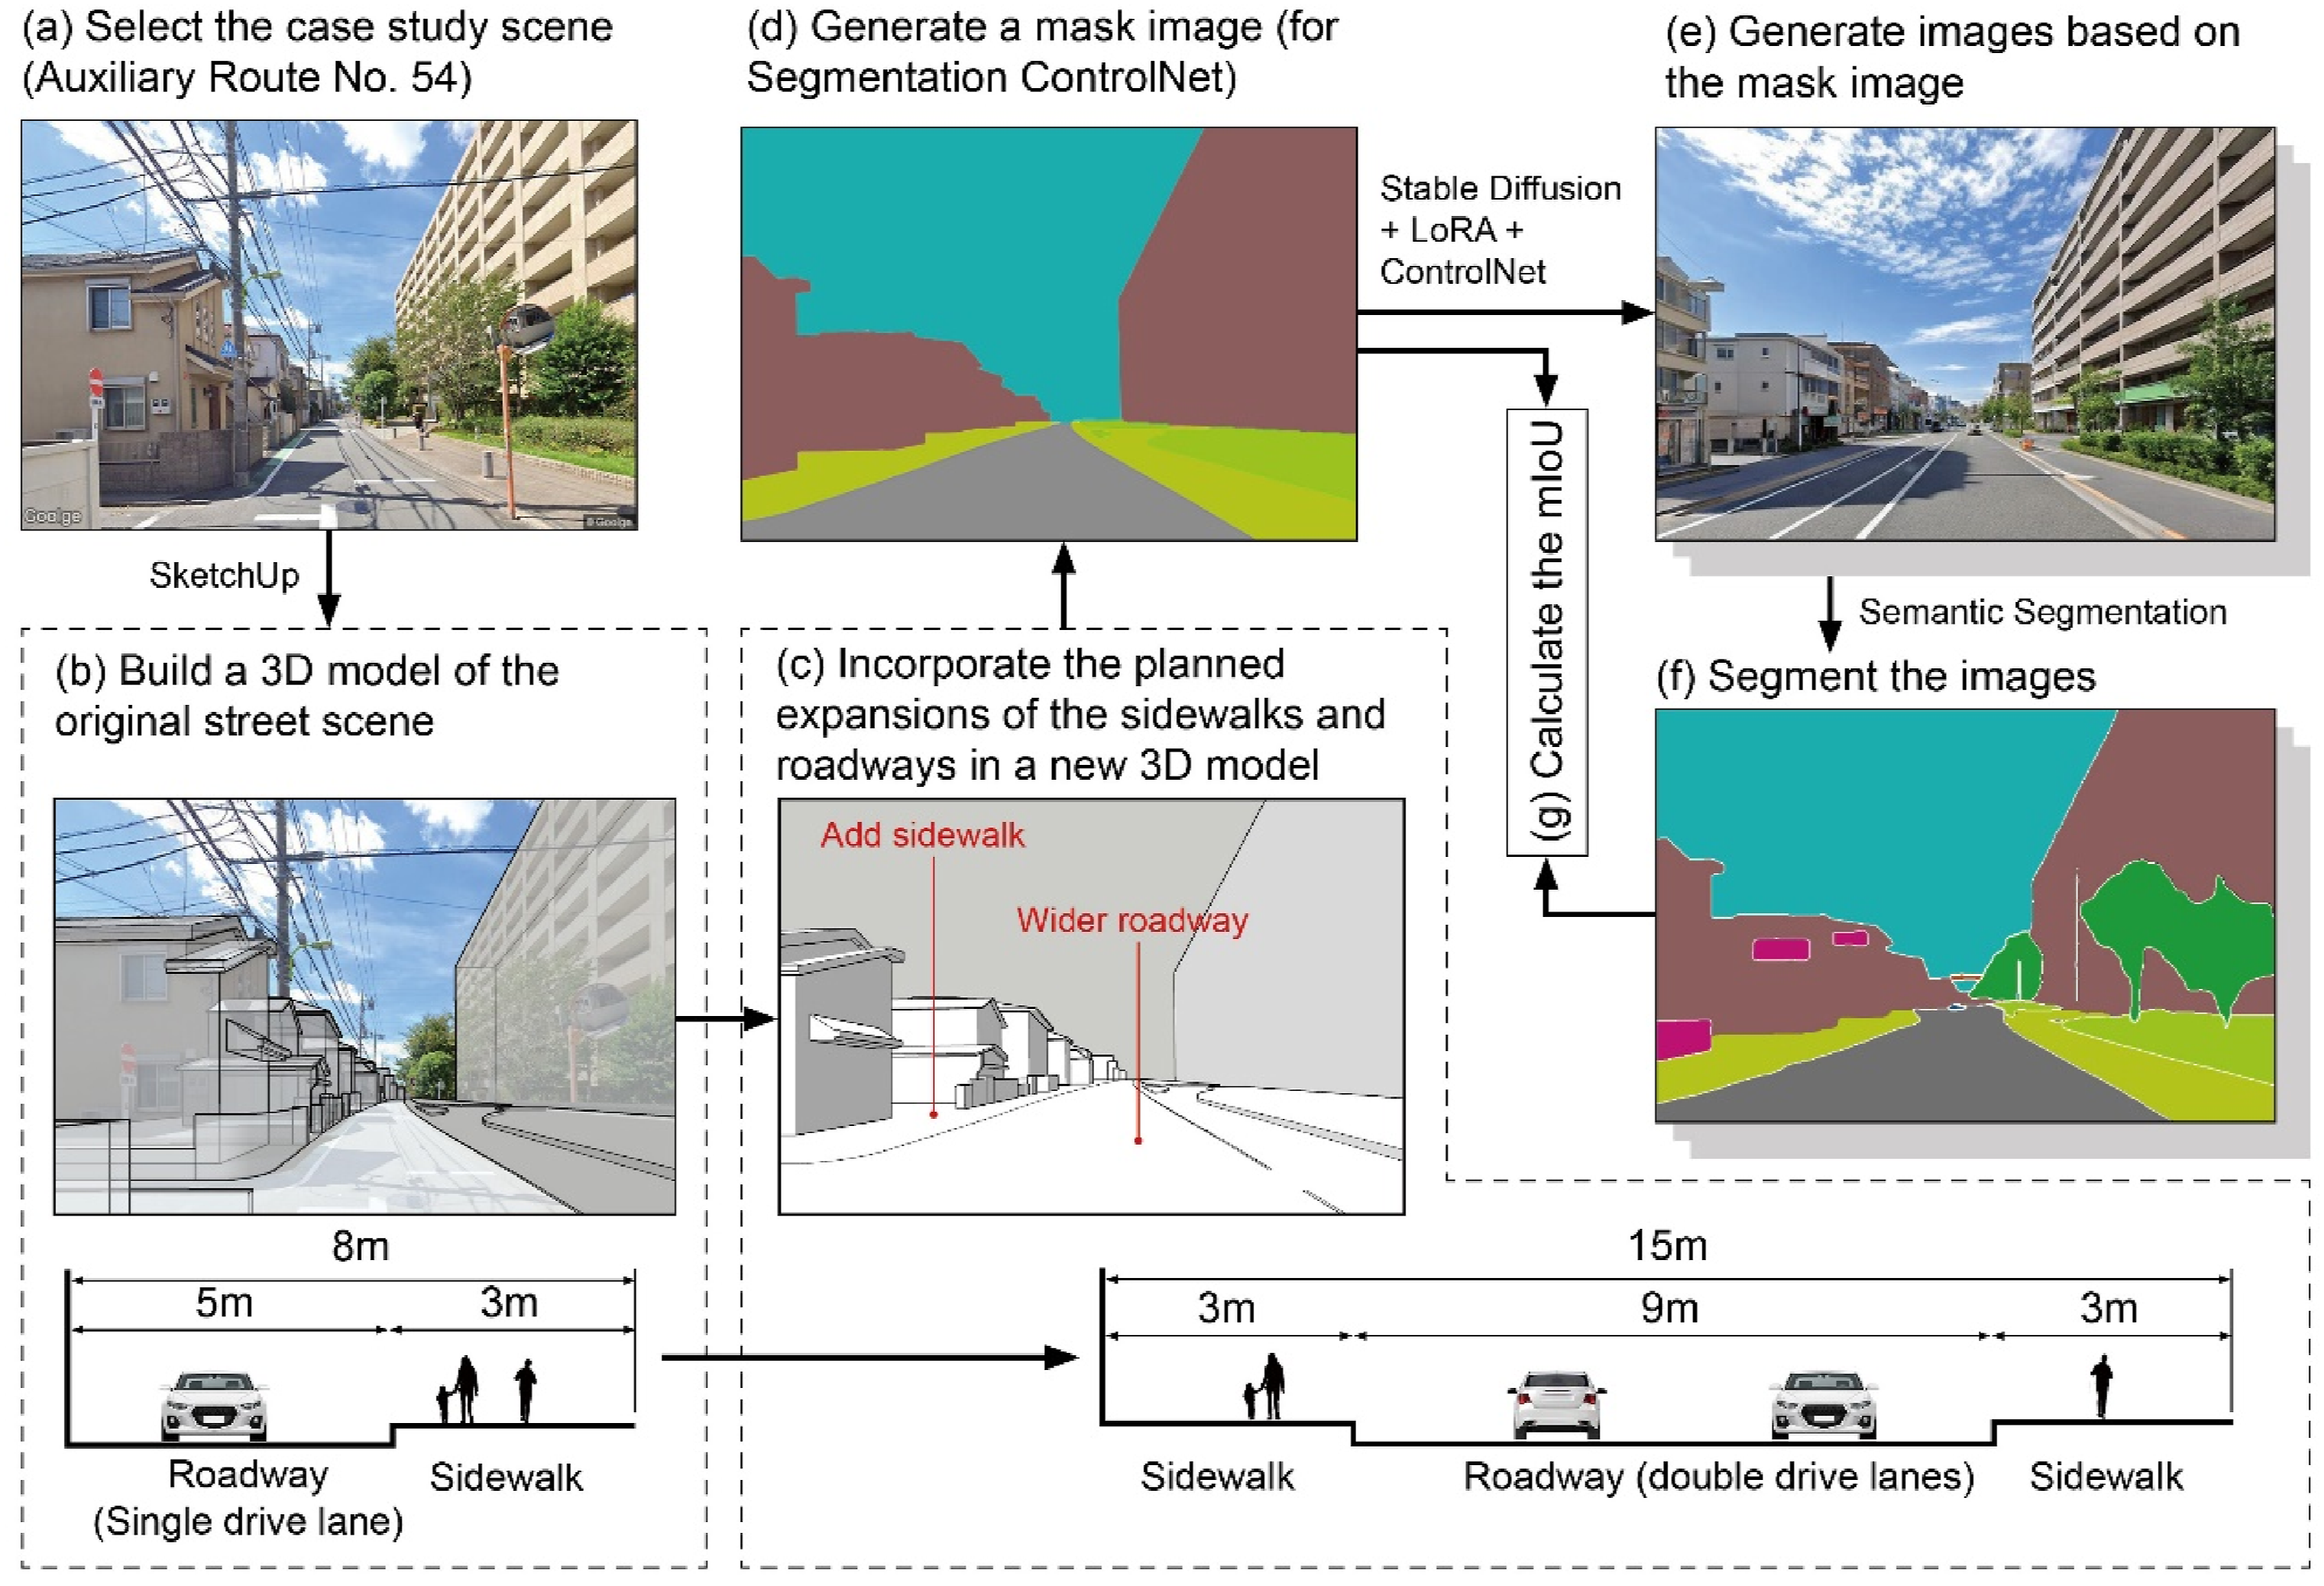
We first constructed the street’s 3D model using SketchUp 2022’s Match Photo function (Figure 6(b)). We then modified the model to incorporate the planned expansions of the sidewalks and roadways, resulting in a new 3D model that reflects the planned dimensions (Figure 6(c)). This updated 3D model was subsequently used to generate a mask image compatible with ControlNet’s Segmentation model (Figure 6(d)). Using this mask image as the segmentation input for ControlNet, with the trained LoRA model, we randomly generated 100 images of the updated street scene (Figure 6(e)).
To evaluate the reliability of spatial dimension control in the generated images, we performed semantic segmentation to create segmentation maps for all 100 generated images (Figure 6(f)), using the same color-coding scheme as the mask image generated from the 3D model. Next, we assessed the alignment between the pixel areas corresponding to the sidewalks and roadways in the segmentation map and those in the mask image generated from the 3D model by calculating the mIoU (Figure 6(g)). The results yielded an average mIoU value of 0.783, demonstrating a high level of accuracy in controlling the dimensions of the specific design elements.
Evaluation of preference improvement
To evaluate whether the trained LoRA models improve people’s perceptual and behavioral preferences for walking, we compared the preference scores of images before and after generation. First, we generated 100 images for each of three street types—arterial, collector, and local streets. Then, using the trained preference prediction models, we scored both the original and generated images and analyzed the differences.
For LoRA Model 1, the results showed the average percentage of score improvement across both perceptual and behavioral preference dimensions for all street types (Figure 7(a)). Specifically, for arterial streets, the improvements were as follows: 7.66% for safety, 8.73% for comfort, 21.10% for interest, 30.34% for preference to linger, and 27.22% for preference to walk. For collector and local streets, the improvements were: 10.08% and 14.46% for safety, 16.48% and 22.89% for comfort, 31.27% and 18.48% for interest, 33.64% and 23.09% for preference to linger, and 30.05% and 21.22% for preference to walk, respectively. Figure 7(b) – (d) illustrate examples of the generated images for different street types using LoRA Model 1. (a) Average improvement of perceptual and behavioral preferences in optimized street scenes generated by LoRA Model 1; (b) arterial street example generated by LoRA Model 1; (c) collector street example generated by LoRA Model 1; (d) local street example generated by LoRA Model 1.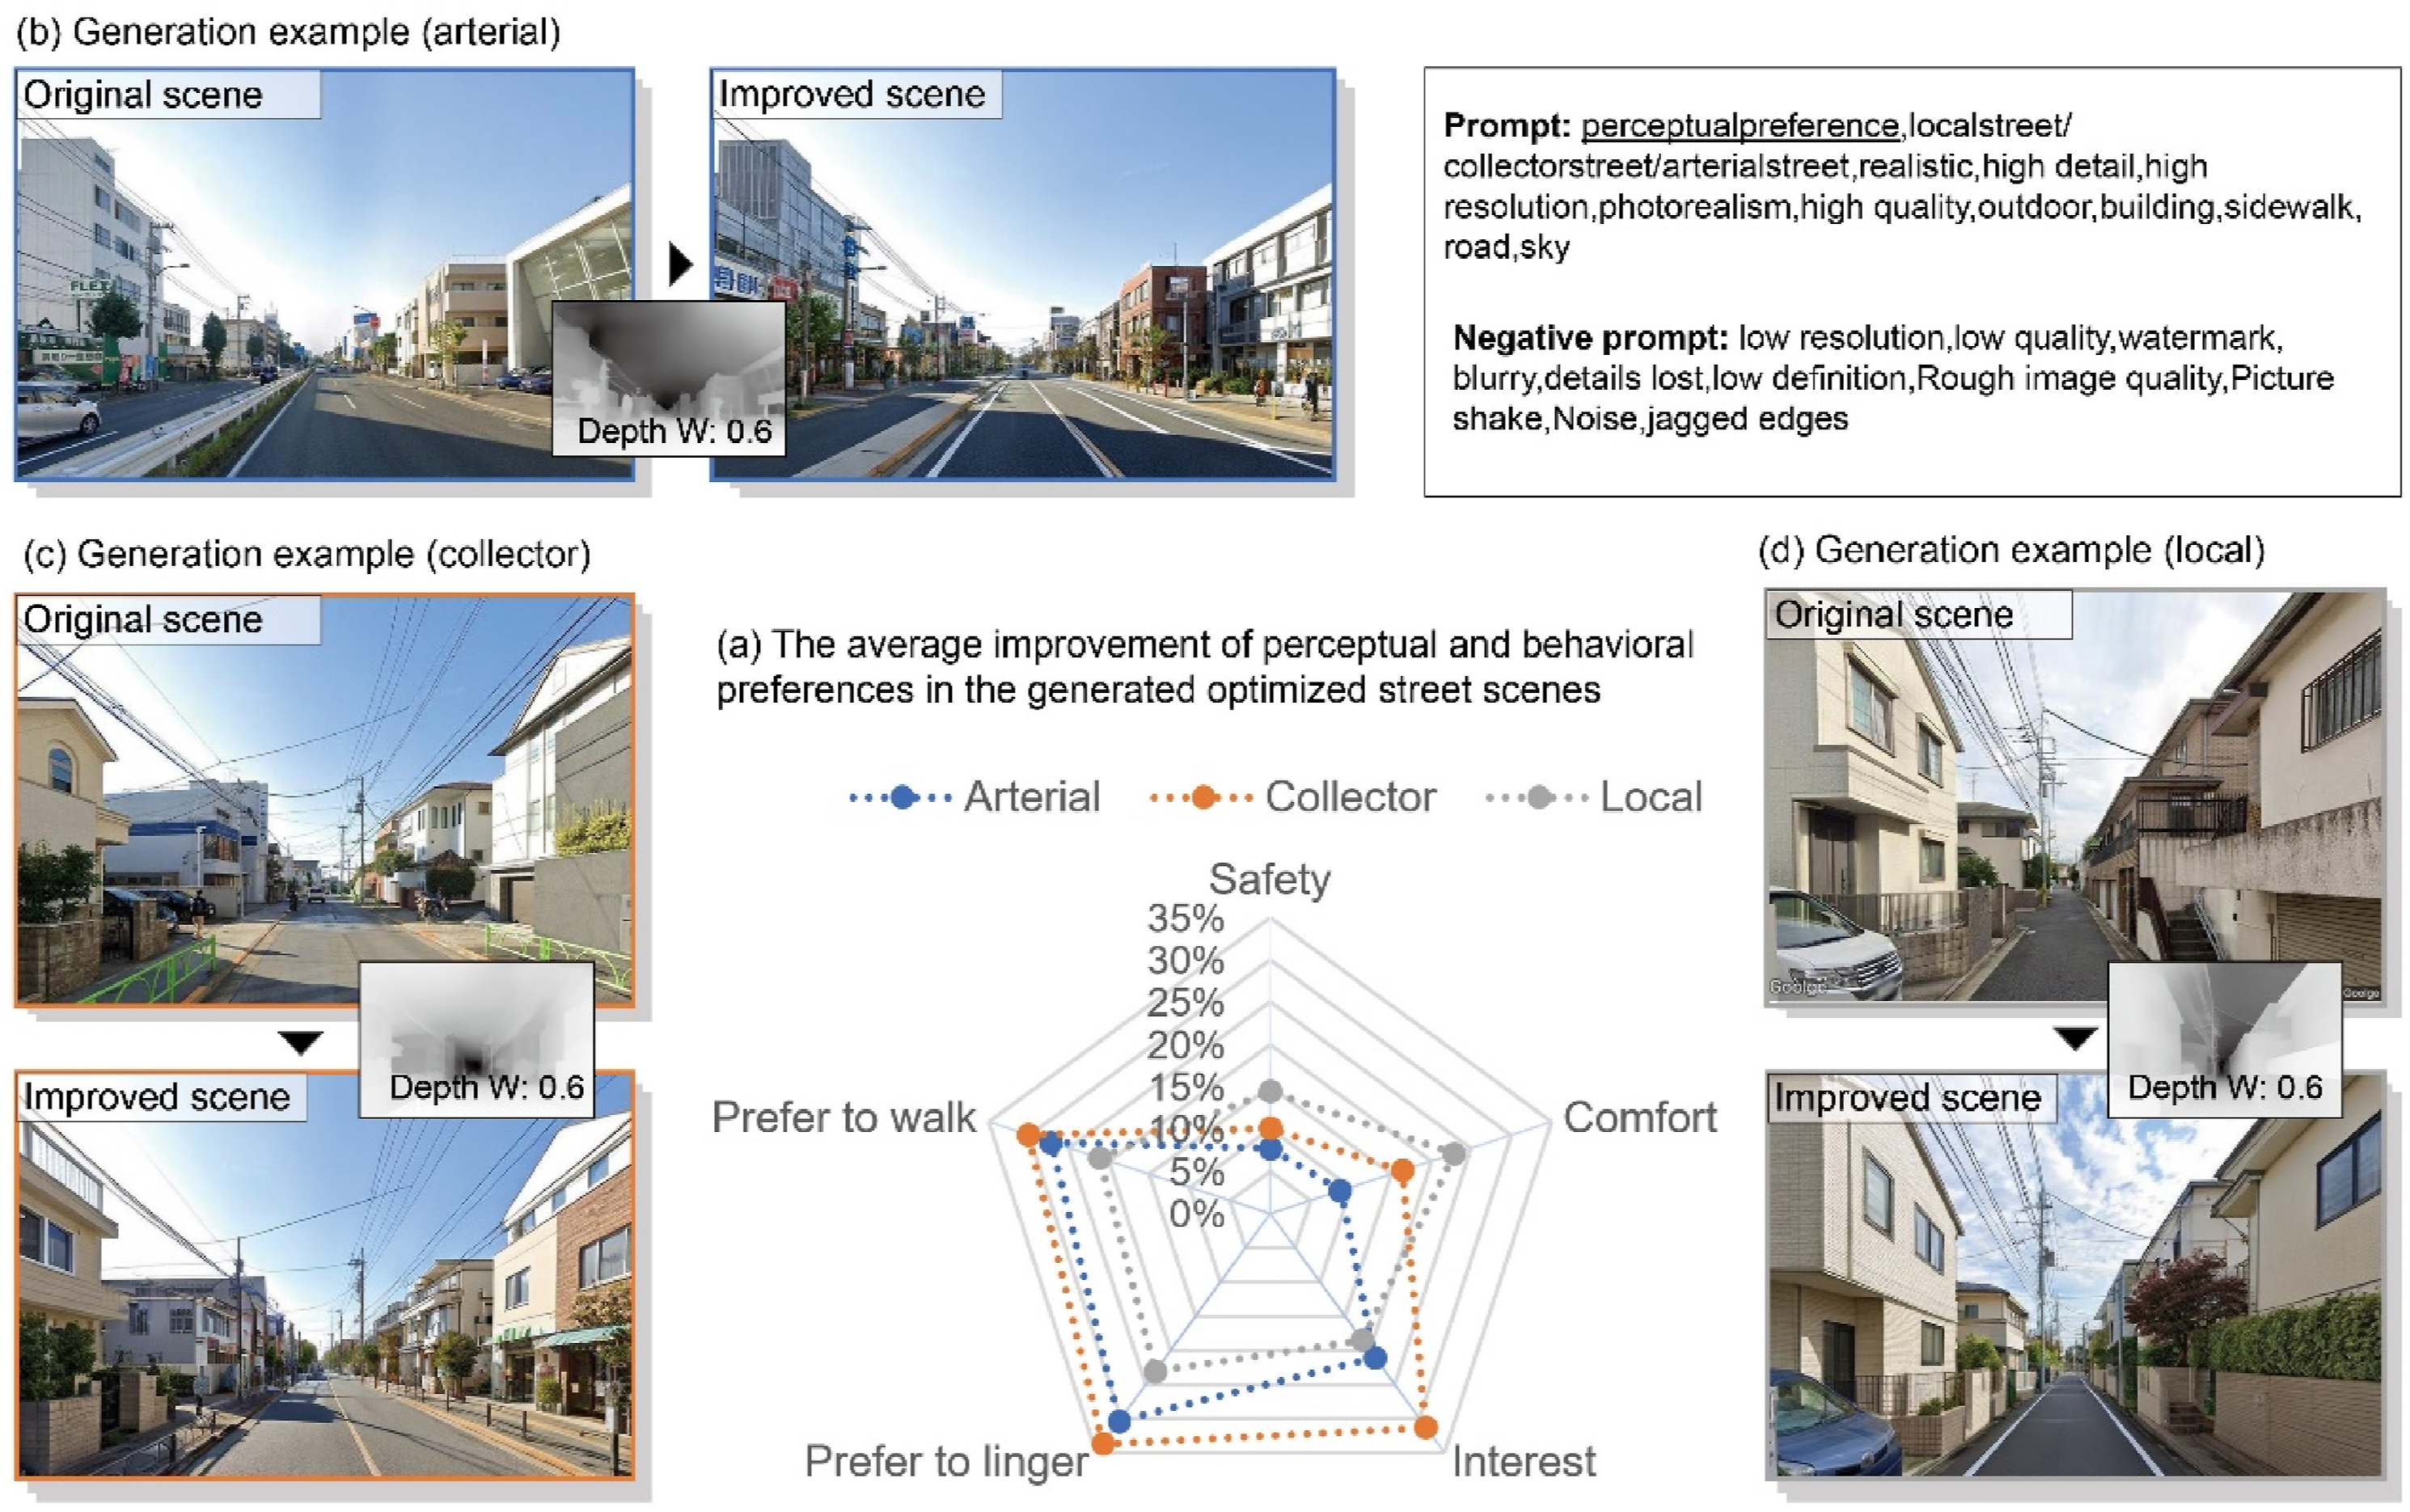
Figure 8 presents the average improvements in walking-related perceptual and behavioral preferences for street scenes generated using LoRA Model 2, compared to the original street scenes. For arterial streets, the improvements in safety, comfort, interest, preference to linger, and preference to walk were 2.15%, 5.86%, 17.43%, 28.56%, and 31.69%, respectively. By comparison, for collector and local streets, the improvements were as follows: safety increased by 11.43% and 10.35%, comfort by 17.08% and 19.99%, interest by 26.63% and 17.63%, preference to linger by 30.68% and 22.19%, and preference to walk by 28.41% and 25.13%, respectively (Figure 8(a)). Figure 8(b)–(d) illustrate examples of the generated images for different street types using LoRA Model 2. (a) Average improvement of perceptual and behavioral preferences in optimized street scenes generated by LoRA Model 2; (b) arterial street example generated by LoRA Model 2; (c) collector street example generated by LoRA Model 2; (d) local street example generated by LoRA Model 2.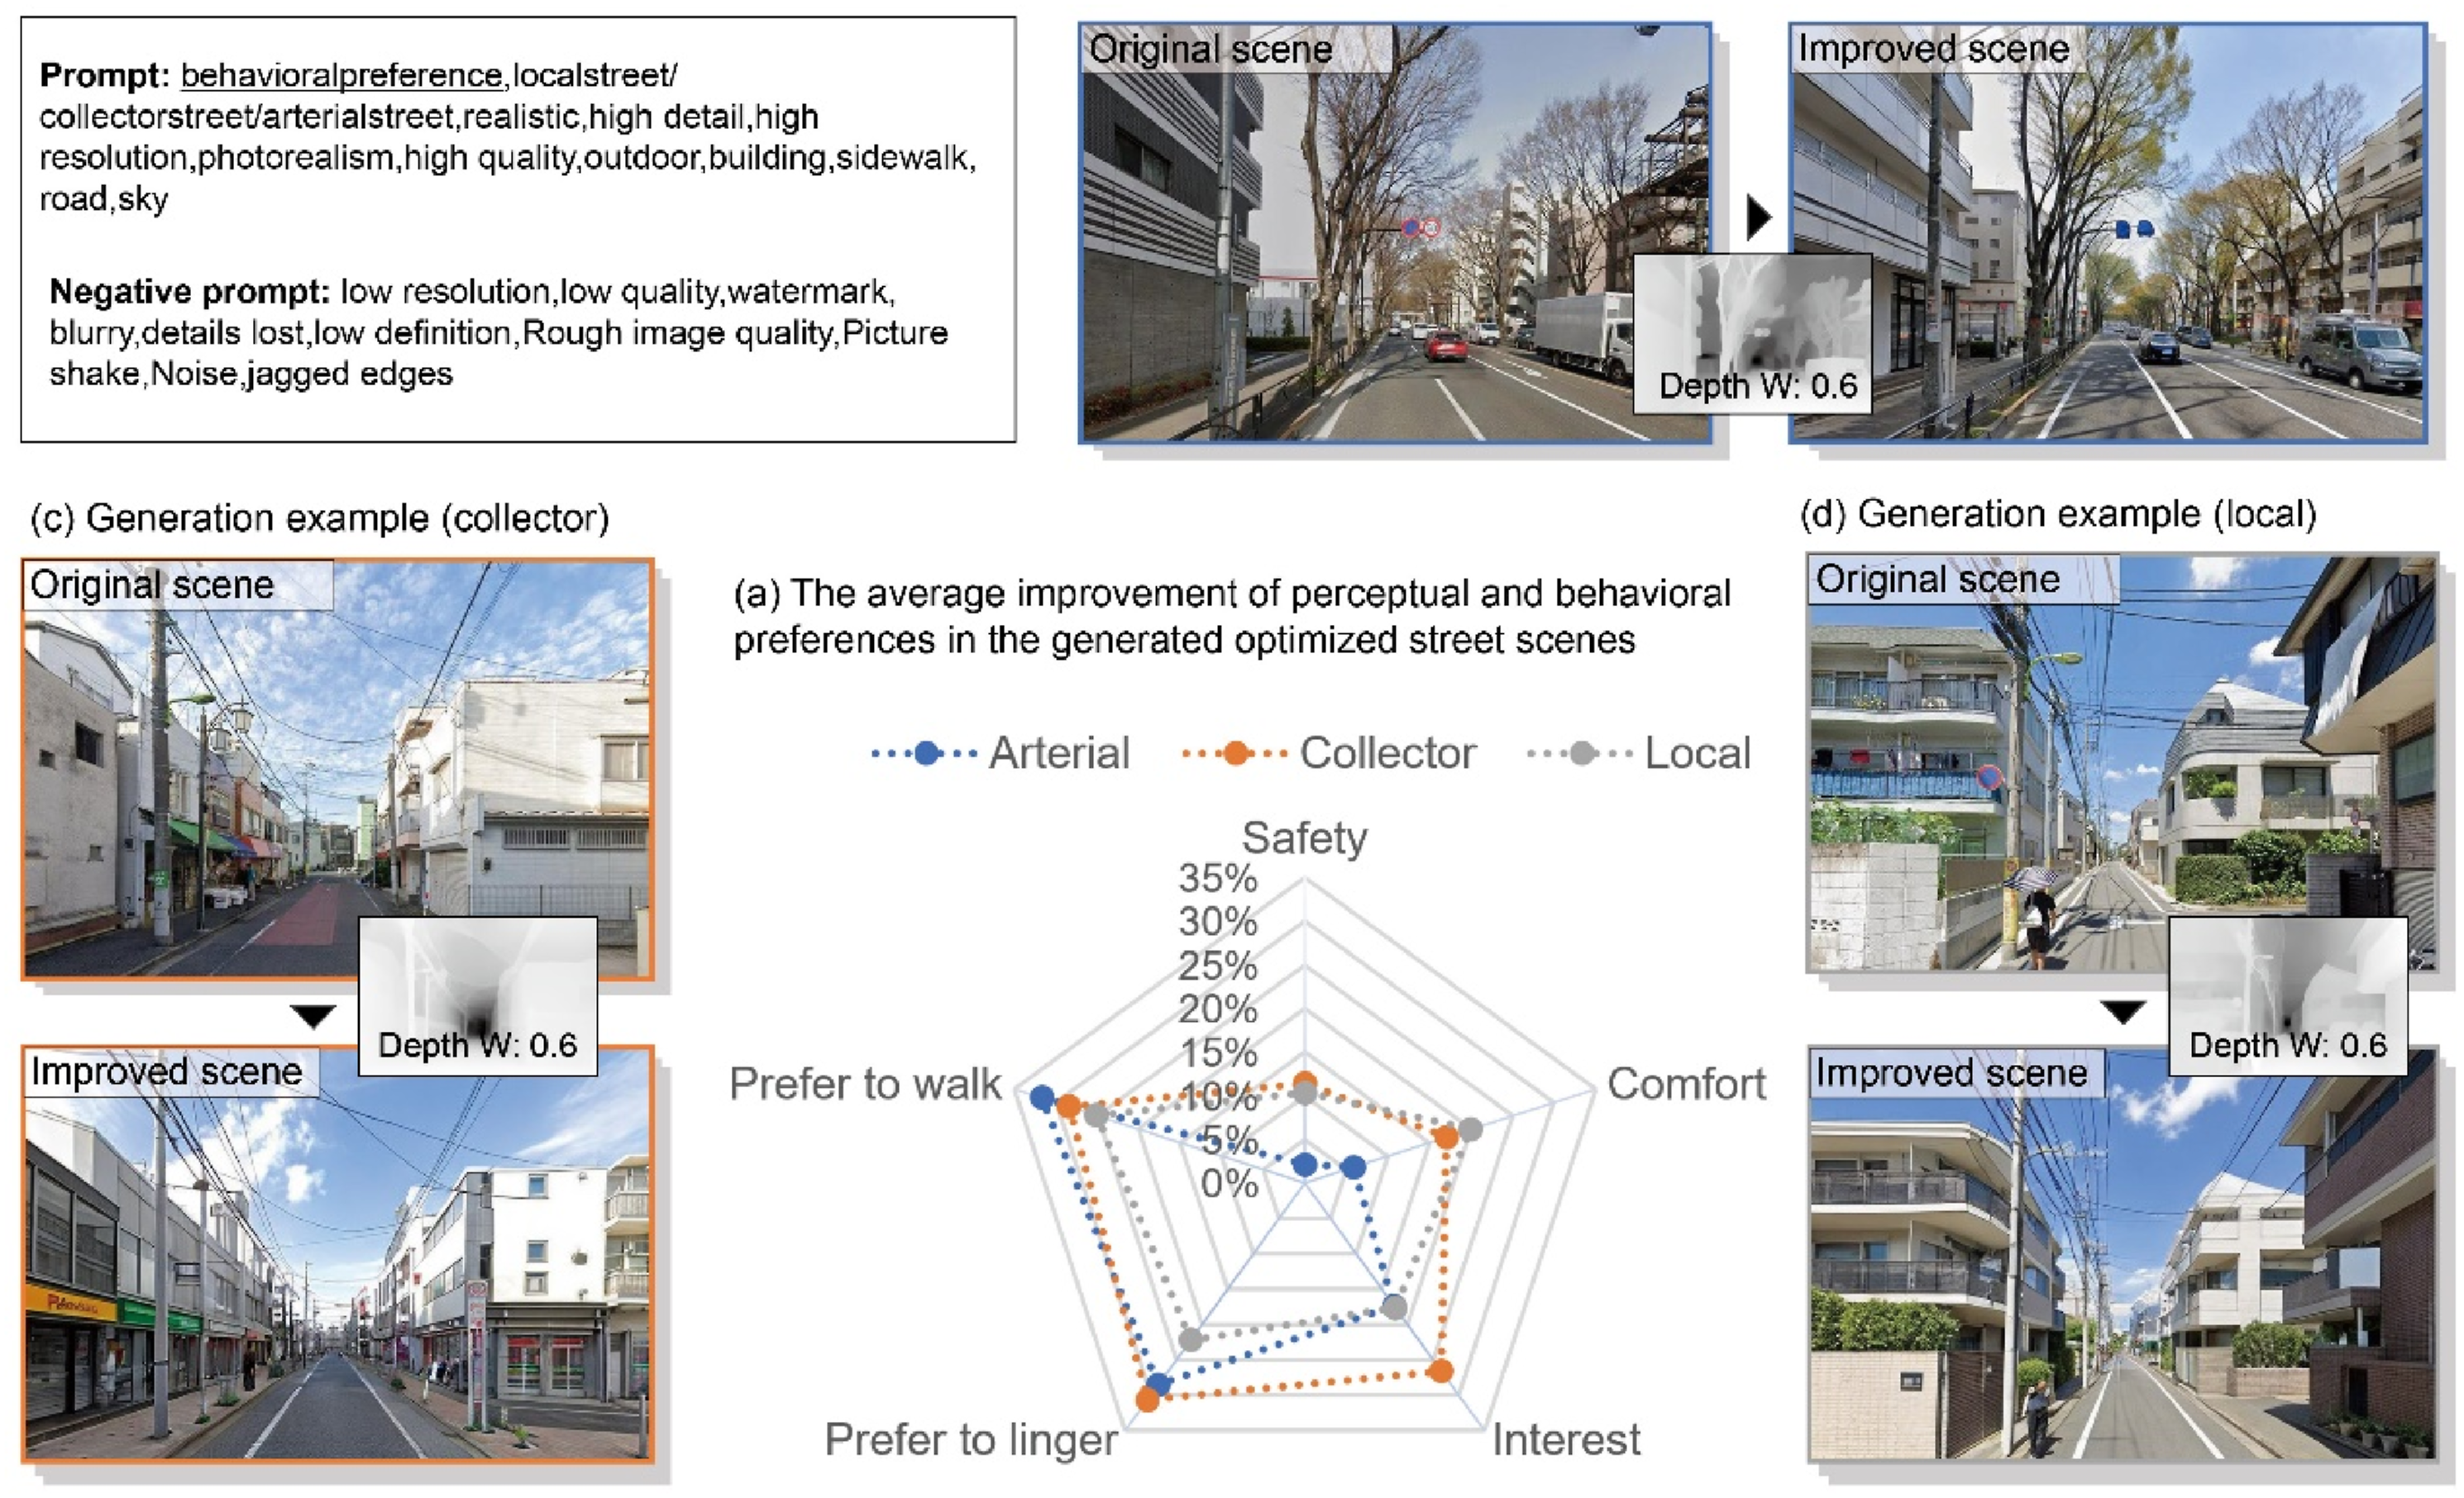
Discussion
This study employed two crowdsourced survey datasets specifically designed for Tokyo’s street environments, comprising over 500,000 responses from more than 50,000 respondents across Japan. While capturing respondents’ perceptual and behavioral preferences regarding street view images, the datasets also included demographic information such as gender and age. Both datasets achieved a gender balance and cover a broad spectrum of age groups, making them representative in terms of demographics. As a result, the generated street scenes are expected to accurately reflect the preferences of the general public.
Compared to existing GAN-based methods (Joglekar et al., 2020; Yamanaka and Oki, 2022), our approach using Stable Diffusion offers several significant advantages. First, fine-tuning Stable Diffusion with LoRA provides a major benefit over GAN training, particularly when handling limited training data. GANs typically require large datasets to balance the generator-discriminator dynamics and produce diverse, realistic outputs. By contrast, LoRA employs low-rank matrices in specific layers of the Stable Diffusion model, allowing for efficient updates with fewer parameters and smaller datasets. This enables LoRA to effectively capture target features and fine-tune the model for accurate image generation, even when data is limited. Second, Stable Diffusion excels in generating high-fidelity street scenes through its gradual denoising process, which transforms random noise into clear, detailed images. This results in enhanced detail retention and more realistic outputs. Testing across various street categories has shown that the generated results maintain high fidelity throughout, achieving consistent quality across all street categories. Third, the Stable Diffusion-based workflow offers superior control over image generation, addressing a key limitation of previous GAN-based approaches. Using ControlNet during the generation process ensures the global structural features of the image are preserved, preventing the generated result from deviating too far from the original scene. Furthermore, by integrating 3D models and ControlNet, our Stable Diffusion-based method can precisely adjust the size of design elements during generation, tailoring the design to specific needs—such as optimizing pedestrian spaces or ensuring traffic flow in emergency scenarios. Finally, through quantitative comparisons between original and generated street scenes, we demonstrate that our proposed Stable Diffusion-based workflow effectively enhances walking-related dimensions of public perceptual and behavioral preferences.
Integrating crowdsourced preferences with Stable Diffusion into a unified workflow and embedding it into the practical design process can offer a significant value in several key areas. First, our approach can enable designers and planners to quickly generate intuitive and visually compelling conceptual proposals during the early stages of design. This not only allows for a more intuitive assessment of different schemes but also facilitates clearer communication and collaboration with clients, enhancing the overall decision-making process. Second, incorporating public preference data to train the model enables public attitudes to directly influence street design, offering an innovative way to facilitate public participation or co-design. Similarly, our method offers a more efficient alternative to traditional social experiments (MLIT, 2021), which often require time-consuming and costly temporary spatial modifications to test user behavior and gather feedback. In bypassing these complex steps, our approach directly generates public feedback, significantly streamlining the design process.
Conclusion
This study developed a workflow to generate revitalized street scenes at the micro-scale, enhancing walking preferences using crowdsourced surveys and Stable Diffusion models. Our evaluation highlights the workflow’s ability to produce realistic images, deliver precise control, and optimize training efficiency, while significantly improving perceptual and behavioral preferences in the generated street scenes. Moreover, our approach provides practical value for street design by offering rapid visual insights in the early design stages and supporting democratic design processes through crowdsourced input for AI models. These advancements contribute to the creation of human-centered and sustainable urban environments.
However, some limitations exist. First, during the training of our LoRA models, we focused primarily on visual preferences, neglecting other sensory perceptions such as sound and smell, which may have introduced bias. Future studies should incorporate a broader spectrum of sensory data. Second, although we used a single type of street view image, the workflow is adaptable to other image sources. Future research should test this method on diverse datasets to ensure its generalizability. Lastly, our study concentrated on static features and did not account for dynamic factors such as traffic flow or day–night variations. Future work could integrate these dynamic elements into the generation process.
Supplemental Material
Supplemental Material - Enhancing people’s walking preferences in street design through generative artificial intelligence and crowdsourcing surveys: The case of Tokyo
Supplemental Material for Enhancing people’s walking preferences in street design through generative artificial intelligence and crowdsourcing surveys: The case of Tokyo by Lu Huang and Takuya Oki in Environment and Planning B: Urban Analytics and City Science.
Footnotes
Acknowledgments
We extend our sincere gratitude to Zenrin and JoRAS for providing essential street view and map data, as well as other critical resources facilitated by Center for Spatial Information Science (CSIS). Additionally, we are grateful to the CSIS Sekimoto Lab and Rakuten Corporation for their valuable contribution of crowdsourcing survey data. These contributions were fundamental to the execution and success of our research.
Declaration of conflicting interests
The author(s) declared no potential conflicts of interest with respect to the research, authorship, and/or publication of this article.
Funding
The author(s) disclosed receipt of the following financial support for the research, authorship, and/or publication of this article: This research was funded by JST SPRING under Grant Number JPMJSP2106, and JSPS KAKENHI under Grant Number JP22K04490.
Ethical statement
Data availability statement
Supplemental Material
Supplemental material for this article is available online.
References
Supplementary Material
Please find the following supplemental material available below.
For Open Access articles published under a Creative Commons License, all supplemental material carries the same license as the article it is associated with.
For non-Open Access articles published, all supplemental material carries a non-exclusive license, and permission requests for re-use of supplemental material or any part of supplemental material shall be sent directly to the copyright owner as specified in the copyright notice associated with the article.